


Article Highlights:
-
The index funds used extend the reach of the S&P 500 into smaller companies, value-oriented stocks and real estate.
-
Popular stocks and certain sectors can become overweighted in market-cap indexes; equal-weight indexes solve this problem.
-
The average market capitalization of holdings underlying the portfolio’s ETFs are much smaller than the S&P 500.
The need for a simple, basic long-term approach for those who do not want to be active investors prompted AAII founder James Cloonan to develop the Level3 Passive Portfolio while writing his book “Investing at Level3” (www.level3investing.com).
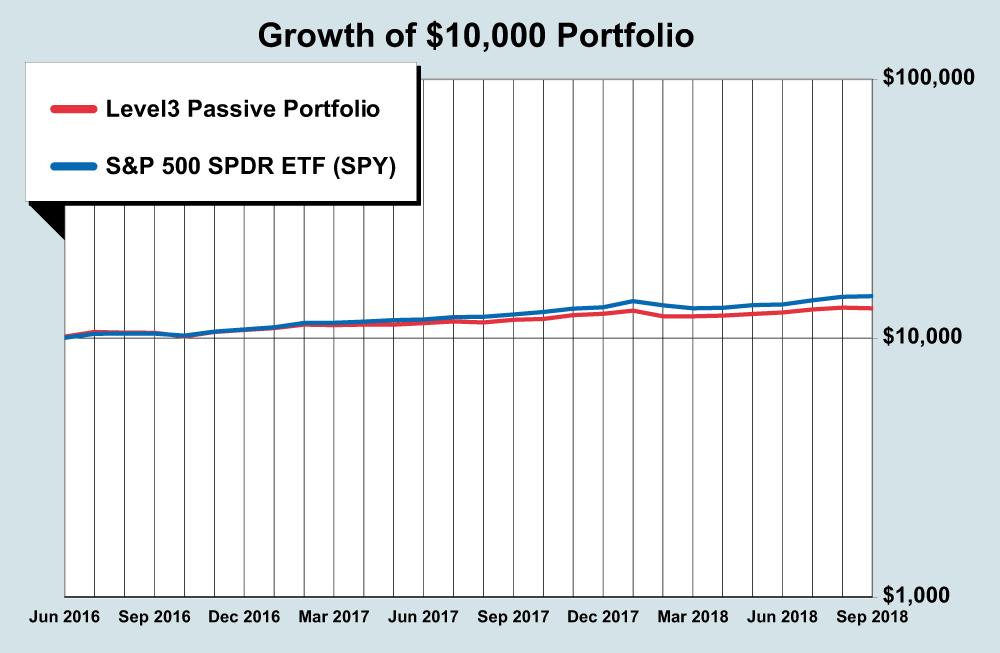
The Level3 Passive Portfolio is composed of four exchange-traded funds (ETFs) that can serve as a complete equity portfolio for investors. It can also be used as a core base of an equity portfolio for those who may wish to select individual stocks and actively managed funds on a limited basis but keep most of their portfolio in index funds. We started tracking the actual portfolio on May 31, 2016, as shown in Figure 1.
Cap Weighting Versus Equal Weighting
The ETFs selected for the Level3 Passive Portfolio are based upon long-term observations and research on market segments and strategies that had performed well relative to the most popular market benchmark, the S&P 500 index.
Large-cap stocks as measured by the S&P 500 have offered investors a long-term annual rate of return of around 10%. The Level3 Passive Portfolio looks at how investors can potentially improve upon the long-term return of the market-cap-weighted S&P 500 by incorporating index funds that extend the reach of the S&P 500 into smaller companies, value-oriented stocks and real estate. As a portfolio, it is more diversified than the S&P 500, which may reduce portfolio downturns influenced by the impact of a few sectors dominating the movement of the capitalization-weighted S&P 500 at a given point in time. But like any approach that seeks to be different from the market, it will also undergo periods of underperformance and outperformance.
In a capitalization-weighted index, such as the S&P 500, the proportional weights of the companies in the index are determined according to the total market value of their outstanding shares. Apple Inc. (AAPL), Microsoft Corp.  (MSFT), Amazon.com Inc. (AMZN), Berkshire Hathaway Inc. (BRK.B) and Facebook Inc. (FB) are the top five components of the S&P 500 and account for 14.20% of the SPDR ETF that tracks the index. With a capitalization-weighted index, popular stocks can become an overweighted segment of the index, leaving the less popular and potentially underpriced stocks underweighted. By design, smaller companies compose a smaller percentage of capitalization-weighted indexes.
The Invesco S&P 500 Equal Weight Portfolio ETF (RSP) invests in the stocks that make up the S&P 500, but weights the holdings equally, with the holdings rebalanced quarterly. In effect, each quarter, the fund is selling the relative winning stocks that are potentially overvalued and investing the proceeds into last quarter’s losers, which might be undervalued. Because the stocks are held in equal proportion, the top five holdings of the equally weighted Invesco S&P 500 Equal Weight ETF make up only 1.16% of total assets versus 14.20% of the market-cap-weighted S&P 500 that holds the same stocks.
In a capitalization-weighted index, sector weighting can also start to become concentrated. The SPDR S&P 500 ETF (SPY) follows the S&P 500. Currently, the top five sectors consist of:
-
Technology, 22.7%
-
Financial Services, 15.8%
-
Health Care, 15.0%
-
Consumer Cyclical, 11.9%
-
Industrial, 10.4%
In contrast, the Invesco S&P 500 Equal Weight ETF has its holdings distributed in the following top five sectors:
-
Consumer Cyclical, 15.0%
-
Industrials, 14.7%
-
Financial Services, 14.4%
-
Health Care, 12.7%
-
Technology, 12.3%
The largest obvious difference is with the technology holdings. Their market participation has become more concentrated recently with more money pouring into a handful of technology holdings. The technology sector makes up 22.7% of the cap-weighted SPDR S&P 500 ETF, but only 12.3% of the equally weighted Invesco S&P 500 Equal Weight ETF.
Below, we report the top five holdings and sectors, along with their weights, for the four ETFs that currently make up the Level3 Passive Portfolio.
Characteristics of the Level3 Passive ETFs
Table 1 provides some characteristics of the ETFs within the Level3 Passive Portfolio and how they compare to the SPDR S&P 500 ETF.
| Fund (Ticker) |
R- Squared (%) |
No. of Holdings |
% of Port |
Avg Mkt Cap ($ Mil) |
Avg P/B (X) |
Yield (%) |
Total Assets ($ Mil) |
Exp Ratio (%) |
Ann’l Total Return (%) |
||
|---|---|---|---|---|---|---|---|---|---|---|---|
|
Top 5 Holdings |
Top 10 Holdings |
||||||||||
| 3-Yr | 10-Yr | ||||||||||
| Invesco S&P 500 Equal Weight (RSP) | 91 | 506 | 1.16 | 2.24 | 27,396 | 2.77 | 1.7 | 16,084 | 0.20 | 15.1 | 12.6 |
| Invesco Russell 1000 Equal Weight (EQAL) | 81 | 970 | 1.47 | 2.48 | 14,115 | 2.54 | 1.4 | 476 | 0.20 | 14.9 | nmf |
| Vanguard Mid-Cap Value (VOE) | 82 | 211 | 5.08 | 10.06 | 13,832 | 2.04 | 2.2 | 9,334 | 0.07 | 13.1 | 12.2 |
| Vanguard Real Estate (VNQ) | 21 | 187 | 28.26 | 39.68 | 12,743 | 2.49 | 4.3 | 31,693 | 0.12 | 7.0 | 7.5 |
| Comparsion: | |||||||||||
|
SPDR S&P 500 (SPY) |
100 | 506 | 14.20 | 21.81 | 109,024 | 3.35 | 1.7 | 280,334 | 0.10 | 17.2 | 11.9 |
| Source: Morningstar, Inc. Data as of 9/30/2018. | |||||||||||
The R-squared column indicates the percentage of a fund’s return that is explained by movements in the S&P 500. It can range from 0% to 100%. An R-squared of 100% indicates that all the monthly movements of the ETF can be explained by movements in the S&P 500. On the other hand, a low R-squared shows that very few of the ETF’s movements can be explained by movements of the S&P 500. The Vanguard Real Estate ETF (VNQ) has an R-squared of 21%. This means that only 21% of the Vanguard Real Estate ETF’s movements over the last 36 months can be explained by movements in the S&P 500. In contrast, the R-squared of the Invesco S&P 500 Equal Weight ETF is 91%, indicating a closer relationship to the S&P 500 over the last 36 months. The lower the R-squared, the greater the potential for diversification when combining assets.
The table also provides the percentage of the portfolio in the top five and top 10 holdings. This figure helps to indicate the level of portfolio concentration and serves as a measure of portfolio risk. The higher the percentage, the more concentrated the ETF is in a few companies, and the more the ETF is susceptible to the market fluctuations of these few holdings. It is worth noting that the measure is boosted for the Vanguard Real Estate ETF, as it holds 10.8% of its assets in the Vanguard Real Estate II Index Fund (VRTPX) which tracks the MSCI U.S. Investable Market Real Estate 25/50 Index. ETF portfolio concentration can be measured in combination with the total number of holdings. A low number of holdings coupled with a high concentration in the top 10 holdings would indicate a highly concentrated portfolio. Since many funds now hold other funds, you need to look at the top holdings (and, if other funds, the holdings of those funds) to determine the actual level of concentration.
Average market capitalization and price-to-book ratio for the ETFs help indicate the typical size of the companies held in the portfolio and the value orientation of the ETF. The average market cap of the SPDR S&P 500 ETF is $109,024 million, whereas all of the holdings in the Level3 Passive Portfolio are much smaller. However, none of the ETFs go into the small or micro range of the stock universe. The Vanguard Mid-Cap Value ETF (VOE) has the lowest average price-to-book ratio of 2.04. This compares to the 3.35 price-to-book average for the SPDR S&P 500 ETF.
The yield calculation looks at the income distribution over the last 12 months compared to the latest net asset value. The Vanguard Real Estate ETF has the highest yield of 4.3%, while the Invesco Russell 1000 Equal Weight ETF (EQAL) has the lowest yield of 1.4%. The SPDR S&P 500 ETF, in comparison, has a yield of 1.7%.
The total assets figure indicates the total dollars invested in the ETF and gauges the interest in the fund’s strategy. The Invesco Russell 1000 Equal Weight ETF has the lowest value in total assets at $476 million, but the expense ratio is not too high at 0.20%.
The three- and 10-year annual compound returns provide a sense of the recent performance of each fund along with a slightly longer perspective. Over the long term, the Invesco S&P 500 Equal Weight ETF has outperformed the SPDR S&P 500 ETF; however over the last few years the SPDR S&P 500 ETF has done better. The Level3 Passive Portfolio has lagged the S&P 500 since its formation (Table 2). This is partly due to the continuing dominance of the mega-cap technology growth stocks for the last several years and partly due to the underperformance of the real estate sector. The principles and research behind the use of equally weighted indexes, value strategies and even smaller-company stocks remain sound. The composition of the Level3 Passive Portfolio is designed to focus on these factors. Unless you are an astute timer, it is generally better to stick with sound long-term investment strategies.
Table 2. Level3 Passive Portfolio Annual Performance
|
Average Annual Return (%) |
Cumulative Growth of $10,000 ($) |
|||
|---|---|---|---|---|
|
Level3 Passive Portfolio |
S&P 500 SPDR ETF (SPY) |
Level3 Passive Portfolio |
S&P 500 SPDR ETF (SPY) |
|
| 2016* | 7.5 | 8.0 | 10,749 | 10,805 |
| 2017 | 15.5 | 21.7 | 12,414 | 13,148 |
| 2018** | 5.1 | 10.5 | 13,046 | 14,522 |
| Since Inception** | 12.1 | 17.3 | 13,046 | 14,522 |
|
*May 31 to December 31, 2016. **Through Sep 30, 2018. Portfolio was started on May 31, 2016. |
||||
Top Sectors and Holdings for Level3 Passive ETFs
The following are the four ETFs that currently make up the Level3 Passive Portfolio. The weights of the holdings in the portfolio may change over time based on experience.
Invesco S&P 500 Equal Weight Portfolio ETF (RSP)
Top 5 Sectors
-
Consumer Cyclical, 15.0%
-
Industrials, 14.7%
-
Financial Services, 14.4%
-
Health Care, 12.7%
-
Technology, 12.3%
Top 5 Holdings (1.16% of assets)
-
L Brands Inc. (LB), 0.23%
-
AES Corp. (AES), 0.23%
-
SCANA Corp. (SCG), 0.23%
-
Foot Locker Inc. (FL), 0.23%
-
Cabot Oil & Gas Corp. (COG), 0.23%
Invesco, the world’s fourth-largest ETF manager, completed its acquisition of Guggenheim Investments’ ETF business back in April and quickly reorganized the Guggenheim ETFs into corresponding ETFs in a tax-free transaction. (All Invesco ETFs, including the acquired Guggenheim funds and the previously owned PowerShares, are now branded under the Invesco name.)
This ETF follows the S&P 500 Equal Weight Index, which equally weights the stocks in the S&P 500. The fund and the index are rebalanced quarterly.
This ETF has outperformed the cap-weighted S&P 500 over the 15 years of its existence. Other indexes also indicate that equal weighting provides higher long-term returns. Equal weighting gives more weight to value stocks and smaller-cap stocks in an index compared to capitalization weighting, which has led to superior performance over the long run.
This fund is given a portfolio weight of 30% in the Level3 Passive Portfolio.
Invesco Russell 1000 Equal Weight ETF (EQAL)
Top 5 Sectors
-
Technology, 13.1%
-
Consumer Cyclical, 12.0%
-
Energy, 11.9%
-
Industrials, 11.7%
-
Consumer Defensive, 11.20%
Top 5 Holdings (1.47% of assets)
-
Marathon Petroleum Corp. (MPC), 0.36%
-
AES Corp. (AES), 0.28%
-
SCANA Corp. (SCG), 0.28%
-
Lamb Weston Holdings Inc. (LW), 0.28%
-
Bunge Ltd. (BG), 0.27%
This ETF includes securities in the Russell 1000 index, which consists of the top 1,000 stocks by capitalization size. This ETF is equally weighted across the nine sector groups, with each security within the sector given an equal weighting. The fund and the index are reweighted at the close of the third Friday in March, September and December. The index is also reweighted at the close of the last Friday in June when the Russell 1000 is reconstituted. This index provides some additional exposure to mid-cap stocks over those found in the S&P 500. Mid-cap stocks historically have had higher returns than large caps. However, it is a newer fund and uses an innovative approach that needs some observation before comparing it to Invesco S&P 500 Equal Weight ETF.
It is weighted at 30% of the Level3 Passive Portfolio.
Vanguard Mid-Cap Value ETF (VOE)
Top 5 Sectors
-
Financial Services, 20.5%
-
Consumer Cyclical, 20.1%
-
Technology, 11.2%
-
Utilities, 10.4%
-
Industrials, 9.0%
Top 5 Holdings (5.08% of assets)
-
NetApp Inc. (NTAP), 1.05%
-
Royal Caribbean Cruises Ltd. (RCL), 1.03%
-
M&T Bank Corp. (MTB), 1.01%
-
Motorola Solutions Inc. (MSI), 1.00%
-
WEC Energy Group (WEC), 1.00%
This ETF tracks the CRSP U.S. Mid Cap Value Index, which targets stocks representing the value and lower-growing half of the mid-cap market and weights the stocks by market capitalization.
CRSP classifies value securities using book-to-price, forward earnings-to-price, historical earnings-to-price, dividend-to-price and sales-to-price ratios. To measure growth, CRSP looks at future long-term growth and short-term growth in earnings per share, historical growth in sales and earnings, current investment-to-assets ratio and return on assets.
Historically, mid-cap value stocks have had higher returns than large-cap stocks or mid-cap growth stocks. The ETF is weighted at 30% of the portfolio.
Vanguard Real Estate ETF (VNQ)
Top 5 Sectors
-
Real Estate, 88.6%
-
Communications Services, 7.7%
-
Basic Materials, 2.7%
-
Industrials, 0.9%
-
Consumer Cyclical, 0.0%
Top 5 Holdings (28.26% of assets)
-
Vanguard Real Estate II Index (VRTPX), 10.80%
-
American Tower Corp. (AMT), 5.39%
-
Simon Property Group Inc. (SPG), 4.60%
-
Crown Castle International (CCI), 3.88%
-
Prologis Inc. (PLD), 3.58%
The Vanguard REIT ETF has completed a transition to a new tracking index, the MSCI U.S. Investable Market Real Estate 25/50 Index.
Prior to this, the Vanguard REIT ETF tracked the MSCI U.S. REIT Index, which includes domestic-equity REITs, or firms that manage properties. This index doesn’t include mortgage REITs or specialty REITs. Under the new index, investors in the ETF will still have exposure to equity REITs and will also gain exposure to certain specialized REITs as well as real estate management and development companies.
Historically, the returns of real estate investment trusts (REITs) have exceeded the returns of the S&P 500 over the long run and provide diversification as well.
The ETF is weighted at 10% of the portfolio.
Portfolio Management Notes
For the Level3 Passive Portfolio, the initial weightings are as previously indicated and shown in Table 3. The approach to rebalancing is to keep it to a minimum.
Table 3. Level3 Passive Portfolio
| Fund (Ticker) | Weight |
YTD Return % |
1-Yr Return % |
Return (%) Since 5/31/2016 |
|---|---|---|---|---|
| Invesco S&P 500 Equal Weight (RSP) | 30% | 7.1 | 13.7 | 37.4 |
| Invesco Russell 1000 Equal Weight (EQAL) | 30% | 7.6 | 14.0 | 36.1 |
| Vanguard Mid-Cap Value (VOE) | 30% | 3.1 | 9.5 | 33.6 |
| Vanguard Real Estate (VNQ) | 10% | 0.6 | 2.0 | 7.9 |
| Weighted Avg of ETFs in Portfolio* | 5.4 | 11.3 | 32.9 | |
| Actual Level3 Passive Portfolio** | 5.1 | 10.8 | 30.5 | |
| Comparison: | ||||
|
SPDR S&P 500 (SPY) |
10.5 | 17.7 | 45.2 | |
|
*A weighted average return of the ETFs in the current Level3 Passive Portfolio. **Performance of actual Level3 Passive Portfolio, including reinvested dividends. Source: Morningstar, Inc. Data as of 9/30/2018. |
||||
While momentum is less of a factor with funds than it might be with stocks and transaction costs for funds can be much less than they are for stocks, rebalancing frequently is a distraction and can make taxes a significant consideration.
You should be able to achieve almost all the rebalancing necessary when you add and withdraw funds or when changes are made in the holdings.
Rebalancing decisions will have to be made by the individual since every investor will add or has added assets at a different time, so everyone’s weights will be different. But the following are some general guidelines:
-
Don’t rebalance any holding unless you have held it for over a year.
-
If a holding is 25% below where it should be in relation to the planned weight, bring it back to the appropriate level by selling some overweighted holdings to provide funds.
-
If a holding is 33% above where it should be in relation to the planned weight, bring it back to the appropriate level by selling the excess and using the funds to buy underweighted holdings.
The next review of the Level3 Passive Portfolio will be in the March 2019 AAII Journal.
Discussion
FREE REPORT

Anton from IL posted over 7 years ago:
Ann from Colorado posted over 7 years ago:
Loren Clark from FL posted over 7 years ago:
eyedoc3 from MI posted over 7 years ago:
Ben Welmaker from TX posted over 7 years ago:
Steve from NY posted over 7 years ago:
Brad from OR posted over 7 years ago:
LUCK from FL posted over 7 years ago:
John from VA posted over 7 years ago:
tiomiguel from AZ posted over 7 years ago:
Balakrishna Nuli from GA posted over 7 years ago:
Robert McLaughlin from VA posted over 7 years ago:
Blaine from CA posted over 7 years ago:
DAVID S from DEU posted over 4 years ago:
You need to log in as a registered AAII user before commenting.
Log InCreate an account