Comparing Six of the Best Backtesting Programs

We evaluate and compare the best backtesting tools to use when looking for a stock or fund to add to your portfolio.

Updated on September 7, 2022

This article pits six backtesting programs against each other to determine which one deserves the individual investor’s loyalty. This is simple, once the criteria for a “good” backtesting tool is specified.

The many criteria used to compare the various programs should let the individual investor reading this article pick the appropriate tool for them.

What Is Stock Backtesting?

Backtesting is used to test a predictive model, such as a stock screen based off a specific strategy, using historical data. Backtesting can be a useful tool to cross-reference and validate specific criteria applied to previous points in time.

In simpler terms, backtesting software needs to be able to screen a selected set of stocks to find stocks that match a list of criteria. The software needs to be able to do this in the past as well, using historical data. It would be nice if the user could simply run their screen at any point in the past, within the software’s investing data.

In order to backtest effectively, investors typically use a blend of fundamental and technical metrics, as well as liquidity constraints, real-world portfolio size limits and other details. Investors might include the limitations of stop-loss orders or create other factors. A good backtesting program would ideally handle all of this easily.

How We Chose the Best Backtesting Tools and Resources

This article aims to examine several platforms that an individual investor would potentially be interested in. We excluded other investing programs based on other factors.

  1. We exclude packages that cost more than $250 a month, because this is presumably more than an individual investor would want to spend. Therefore, we don’t cover some very capable packages, such as Bloomberg, FactSet, Eikon, Palantir and Zacks Research Wizard.
  2. We exclude programs that don’t have easy-to-use automated backtesting, such AAII’s Stock Investor Pro and Old School Value.
  3. We also exclude platforms that require the user to write actual programs, like QuantConnect.

The six programs we include, as well as the top concern for each, are:

  1. Equities Lab (Are its analytics and modeling power worth the initial learning curve?)
  2. Finviz (Do the glitzy heatmaps and news translate to powerful strategy modeling?)
  3. Profitspi (Does it provide enough screening capability to compensate for its simple analytics?)
  4. Portfolio123 (Does it make quantitative investing approachable for the average investor?)
  5. VectorVest (Does this distinguished elder have major modern pizazz?)
  6. GuruFocus (Can this guru backtest well?)

For full disclosure, this article was written by the people of Equities Lab. We tried to be as objective as possible, and we also included detailed analysis of why we gave individual ratings to each company to explain our reasoning.

Comparing the Stock Backtesting Tools

We grade based on factors that we think an individual investor would want their backtesting software to have.

Before we get started, let’s go over the grading system. The grades in this table and all the ones below are as follows:

Some measurements listed in our comparison are less important than others.

The article starts out with a description of each category and a brief side-by-side overview of each company’s score in the broken-down criterion. Then, we include detailed descriptions of why each company scored the way it did for each category. Our categories are power, data, usability, configurability and analytics, as well as an overall category, which combines the others. Finally, we include more on each company, as well as screenshots of the capabilities of each company.

The Backtesting Programs With the Most Power

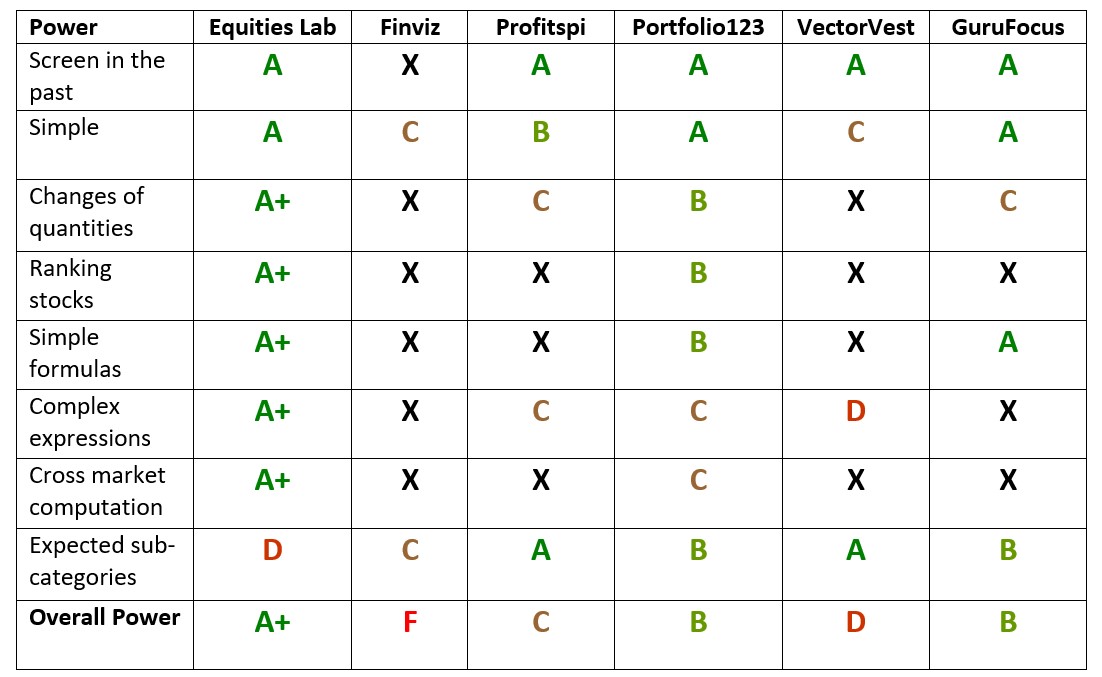
Power is the ability of a program to model what the user is trying to model. Does the program identify what the user wants and deliver it, or does it only deliver a partial product?

There is such a thing as too much power for a program, though, if the complexity is confusing to the point where the user won’t be able to ask for useful data. For example, a C-language programmer can exactly specify what a computer should do, but must know how to code in C, whereas a one-button interface can exactly perform to its very small specifications with little trouble on the part of the user.

This table measures the amount of power in each software with a “reasonable” amount of effort or time. The power measured here is also what can be done within the program, rather than using Excel or another software to compose the results from the screens.

Programs with useful functions, and which can compose those useful functions well, will end up with the edge here. Users need to be able to compare quantities (P/E > 11), rank quantities (P/E in the top 50%), compare quantities across time (P/E larger than last year) and compose these operations together. They also need to be able to create and manage moderately complicated formulas (e.g., Piotroski score).
The Backtesting Programs With the Highest Quality Data

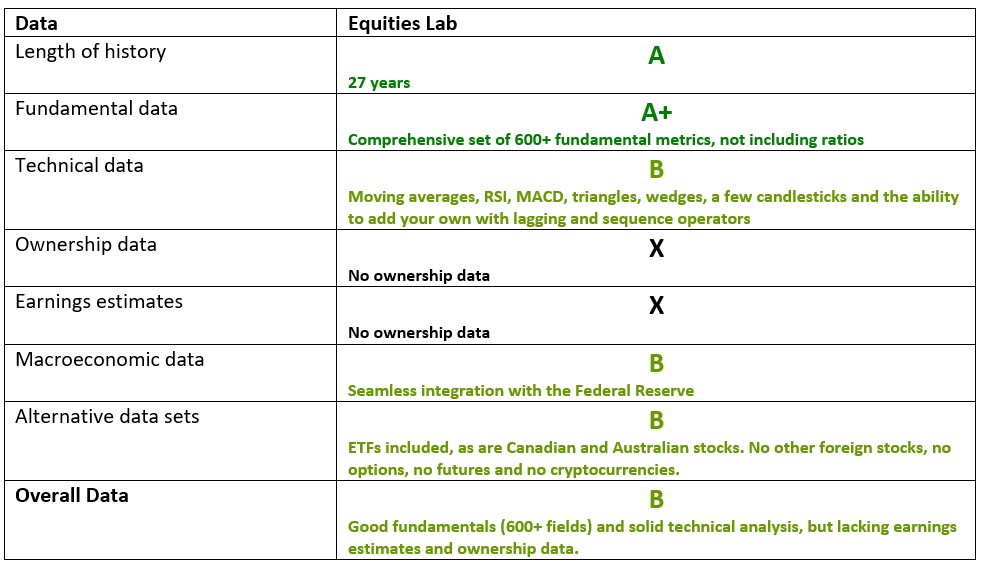
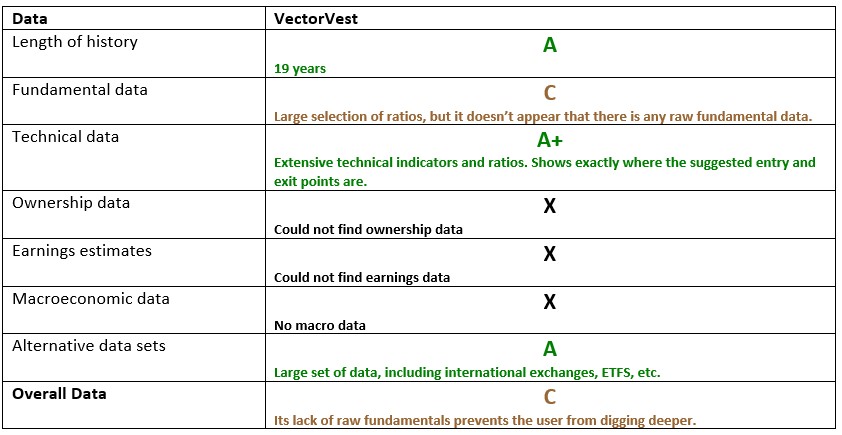
One of the most important aspects of any investment program is the quality of the data with which it runs its backtesting. Shoddy data creates inaccurate screenings of the past, so investors need data that runs through at least one major market cycle, although two market cycles is better.

The data needs to include the fundamentals like earnings, revenue, assets and liabilities. It also needs to enable technical analysis, which means the data must contain the information necessary to play with patterns in price over time. Other macroeconomic data, such as U.S. gross domestic product (GDP) and inflation over time, is also extremely useful, although not strictly necessary.

Investors may also want data that contains earnings estimates, as well as ownership information and foreign data sets. Overall, the amount of data—and how far back that data spans—that a service contains is very important when considering how useful its backtester is going to be.

The Backtesting Programs With the Best Usability

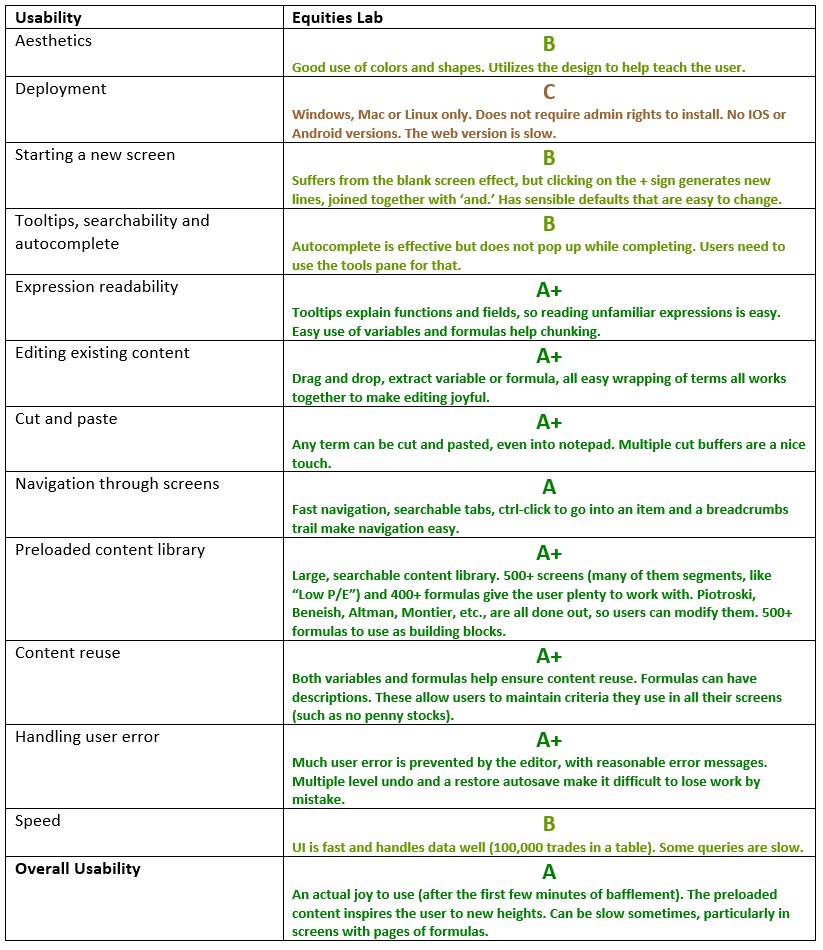
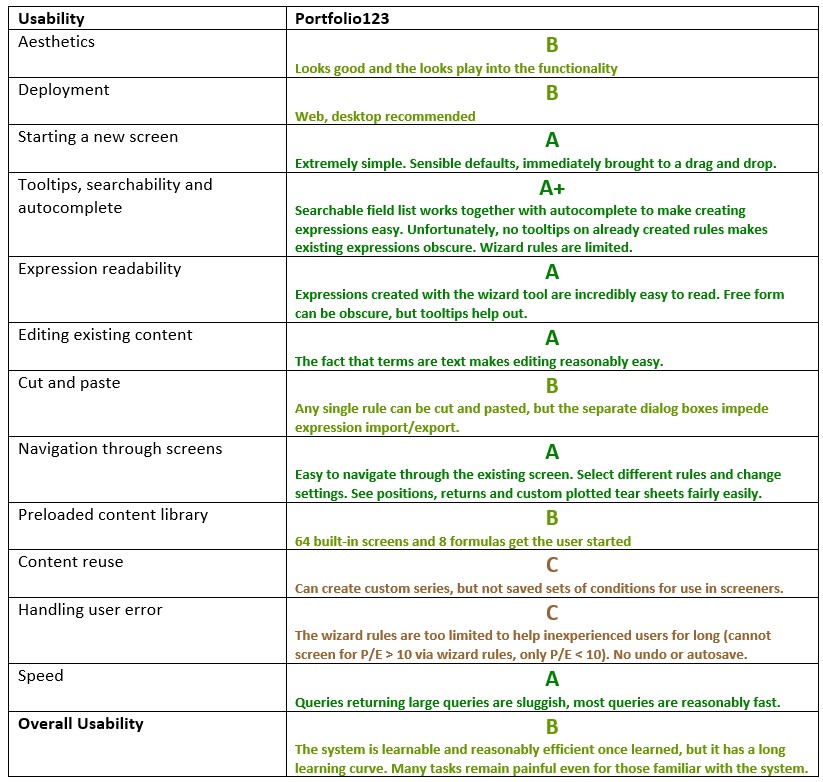
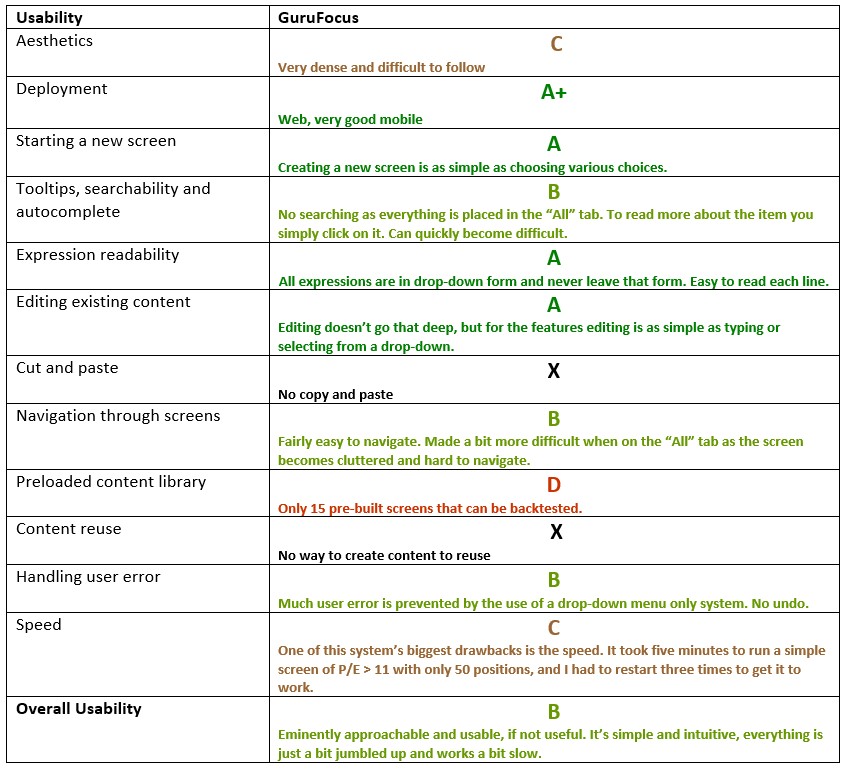
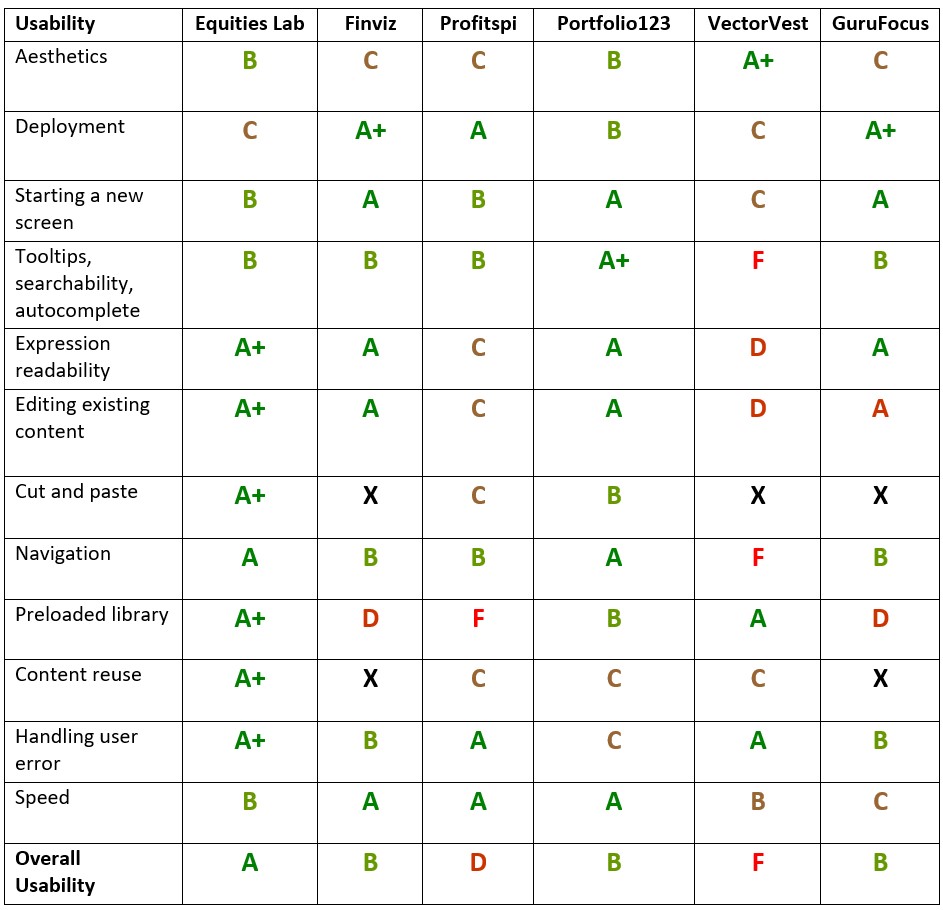
Usability is not the same as simplicity or beauty. It also refers to how easily the user can use the program to get something done, assuming it can be done. Aesthetics, ease of getting started, ease of navigation and speed all matter. However, users need to read and modify what they (or others) have written, so readability and ease of editing matter. Lastly, the pre-built content included enhances learnability and usability.
The Backtesting Programs With Excellent Configurability

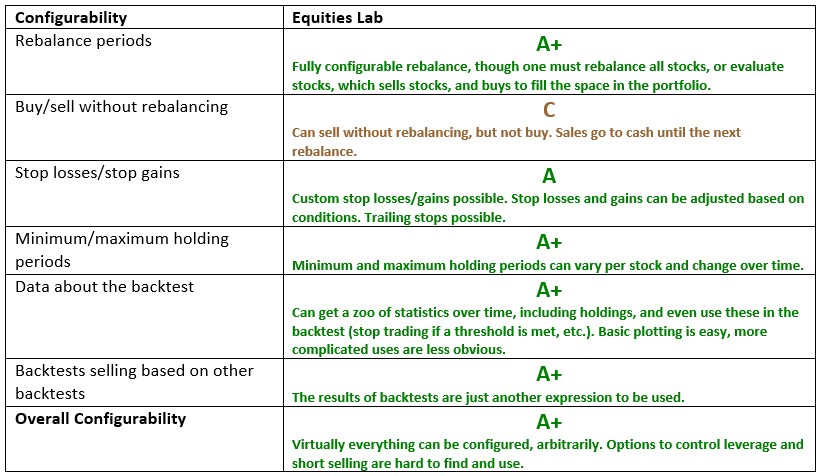
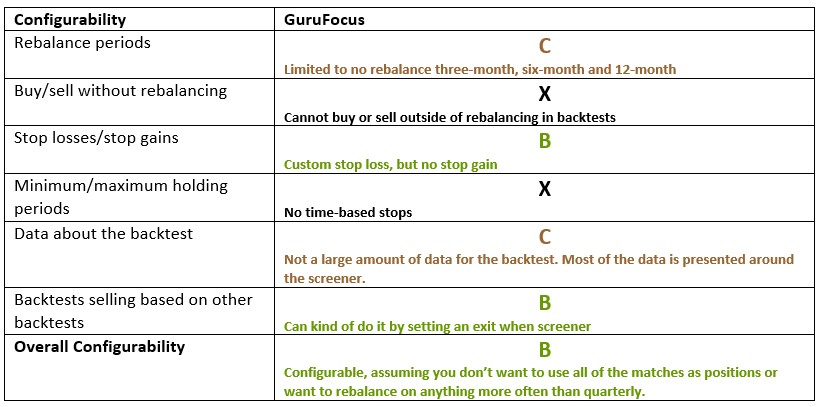
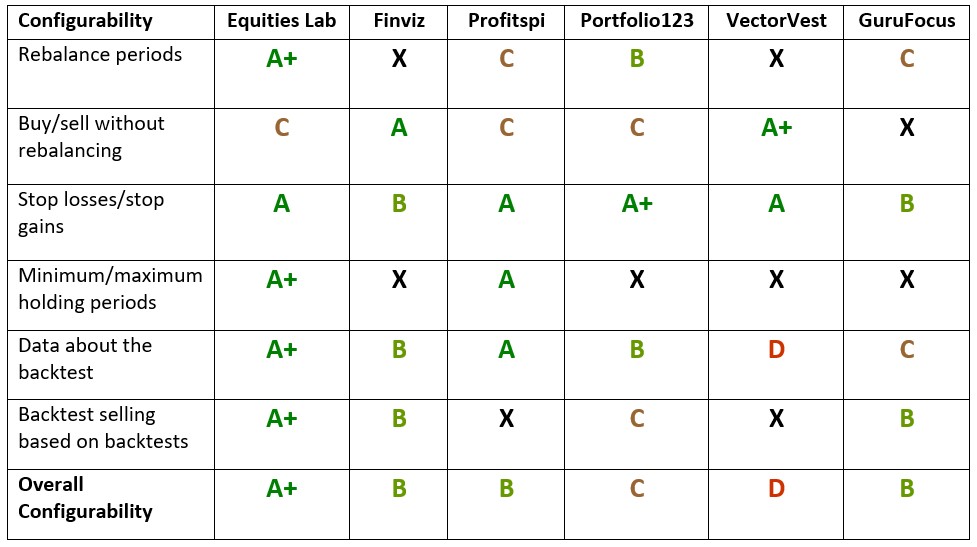
Configurability is the amount of control the user has over the software. More configurability means that users change the software to meet their queries, rather than having to change their queries to meet the software. For people building and tweaking an investment system, it is essential to find and understand the knobs of the software that drive its performance.

Controlling aspects such as when backtests “rebalance,” or replace their holdings with new ones, helps users make sure that their system is robust. For instance, a potential strategy that works when rebalanced monthly, but fails when rebalanced weekly or quarterly, is a disaster.

Similarly, one of the most important parts of investing is preventing losses to the portfolio. Using one stop-loss regime may be habitual; however, having the control to test several would potentially create more earnings. Having a greater range of testing potential lets users be more confident about their backtesting results.
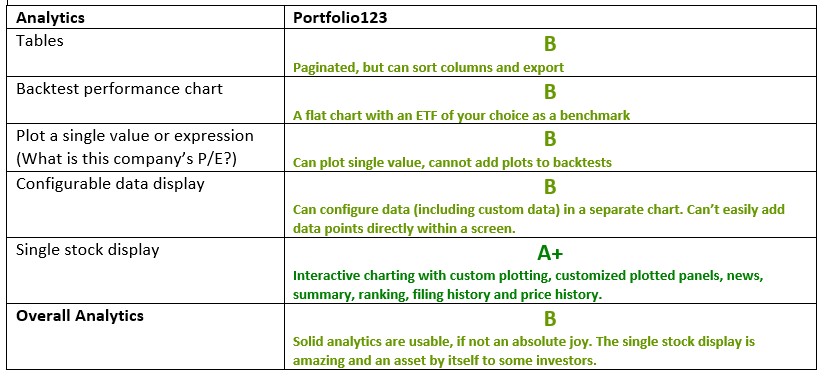
The Backtesting Programs With Top-Rated Analytics

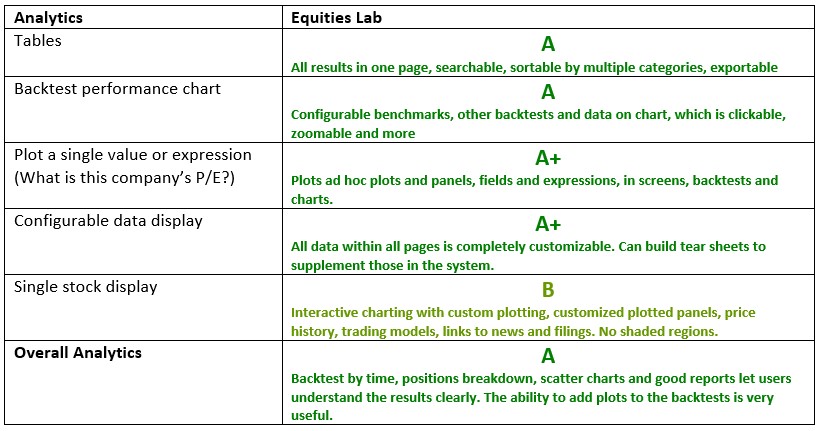
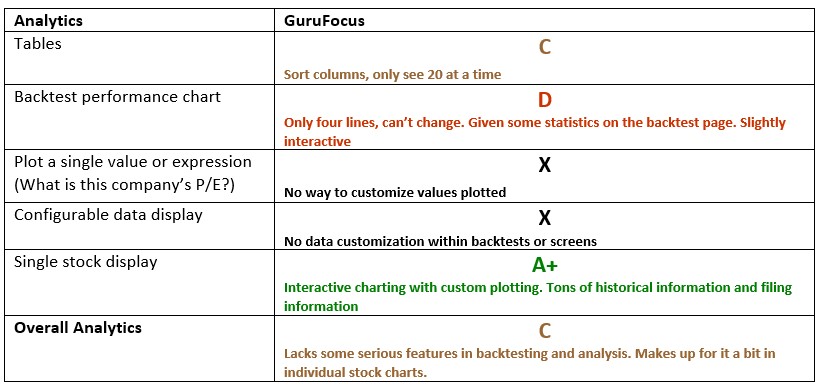
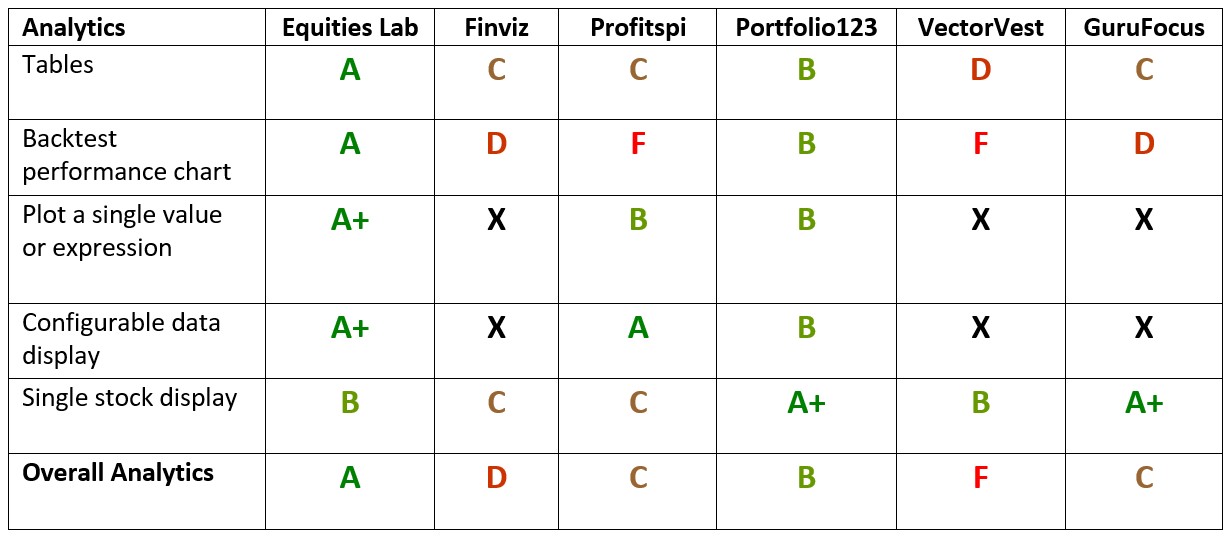
What is the motivation for testing strategies? To get data about how they work! A system that takes all of a user’s input and returns only a single number would be useless. Therefore, a backtester needs to be able to provide as much useful data as possible.

Systems must be able to show a curve of performance for a data set, so that users can see where and how their strategy performed. The more understandable data the system can provide about a given set of inputs, the more useful it is.

Good analytics also make it easy for users to refine their strategy based on the data, and gain assurance that their strategy creates good results. A key to good data presentation is multiple display types, such as charts and tables.
Final Assessment: The Best Backtesting Tools

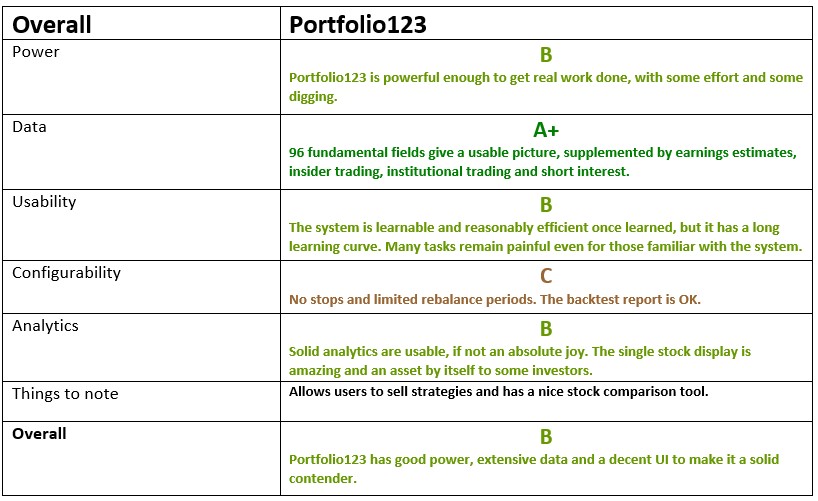
The final assessment pulls all the data from the tables above together into an opinion of how useful the package is for backtesting. Power, usability, configurability and data all matter, but a package that has a clear limitation that makes backtesting impossible or useless will get a low grade regardless of its other criteria.
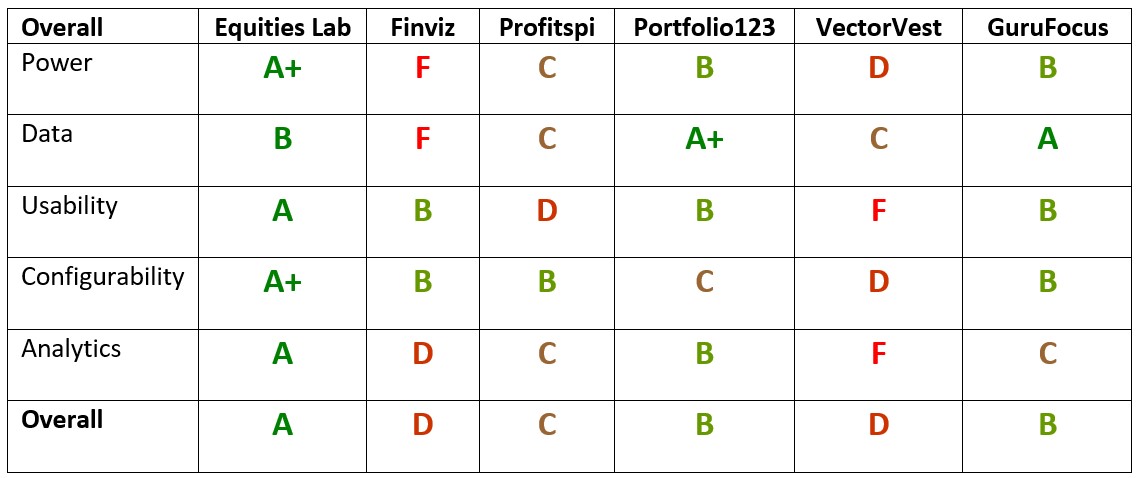
Detailed Comparisons of Each Backtesting Program

Now we include detailed ratings of each company’s score on the criteria, in the form of a broken-down chart for each company. We also include screenshots of each company in action and an overall summary of each backtester’s capabilities.

Detailed Ratings for Equities Lab

More on Equities Lab

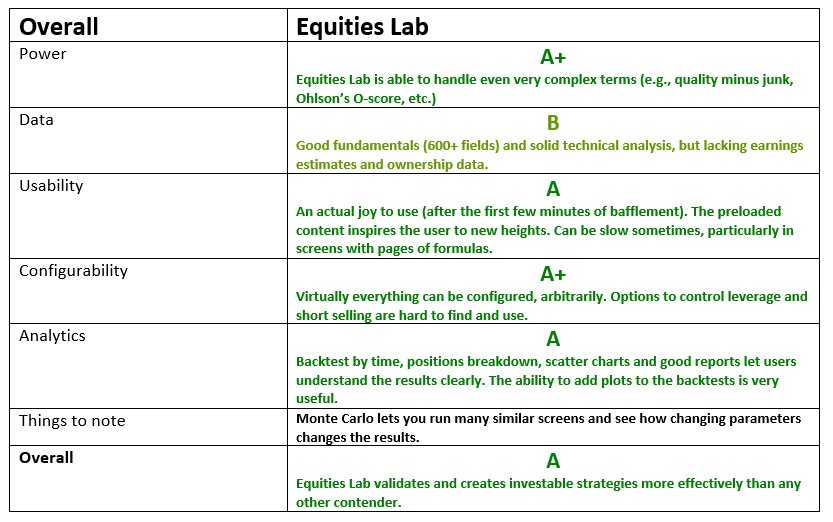
Equities Lab is a software that presents users with a blank slate to start with, and adds structure as needed to express what the user is inputting. This flexibility allows users to handle the sorts of systems that are featured in finance papers, as well as other types of individual investing.
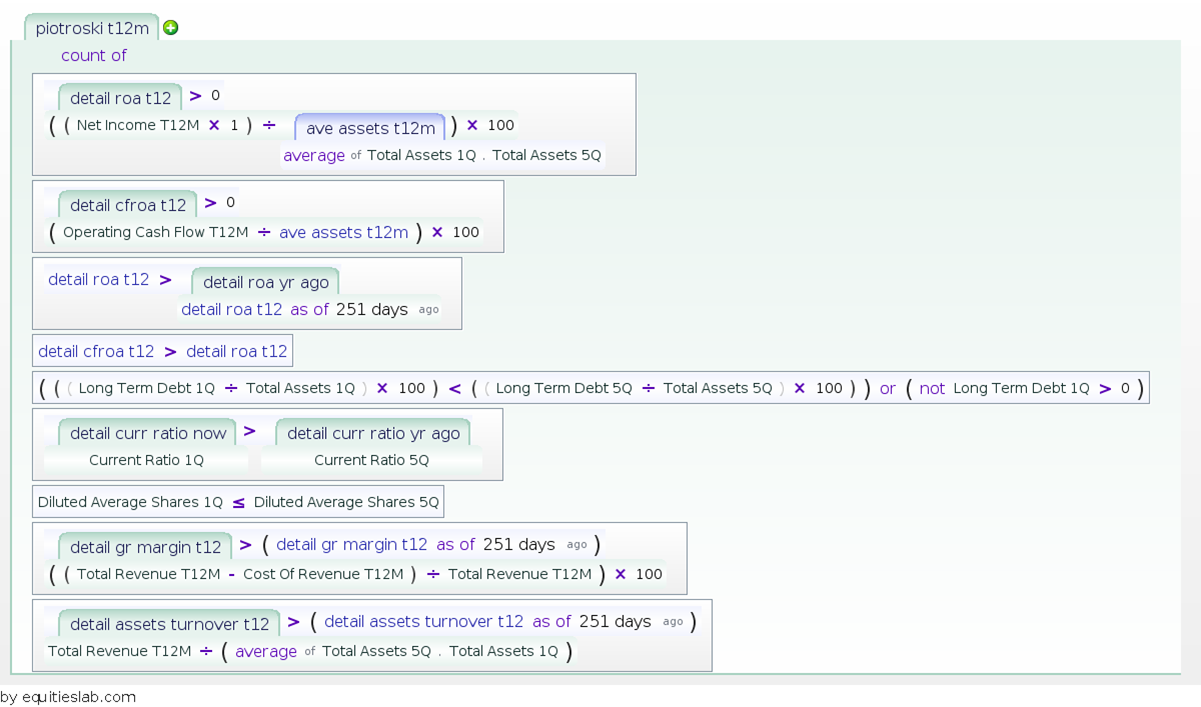
These formulas can be saved, documented and reused, and they can serve as building blocks anywhere. Equities Lab offers a wide range of fundamental data, from standard fields such as TotalRevenue and CostOfRevenue to things like CurrentDeferredRevenue and, finally, all the way to special purpose fields like Properties.

Equities Lab also boasts competent analytics. The data can be mapped, sorted, exported, scatter charted and just plain plotted. The user interface is both approachable and efficient, supporting drag and drop, cut and paste, undo and more.

That said, Equities Lab isn’t perfect either. It has no institutional or insider ownership data, and no earnings estimates. More irritatingly, it doesn’t have historical index membership, making screens like “Find the largest 50% of the S&P 500 by total assets” impossible. Yes, one can fake it by using the same rules S&P does, but it’s not the same.

Detailed Ratings for Finviz
More on Finviz

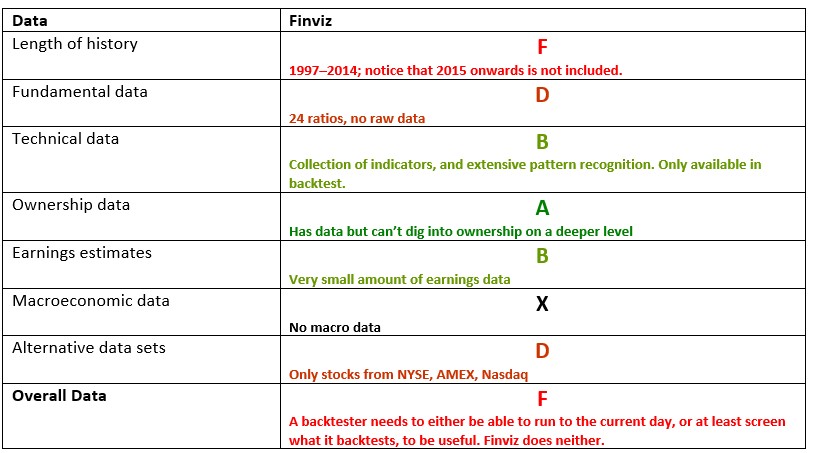
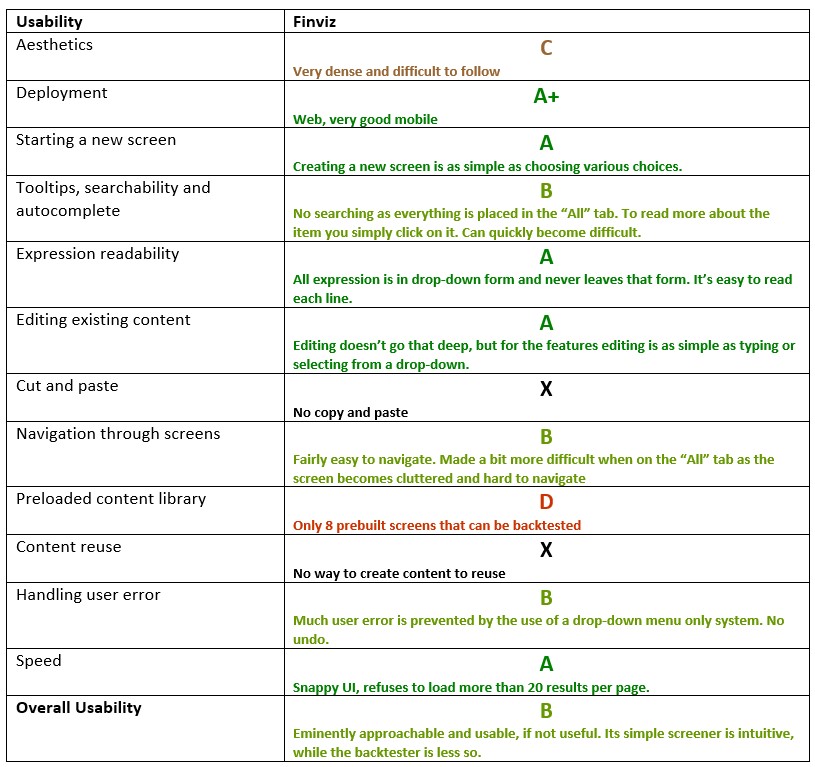
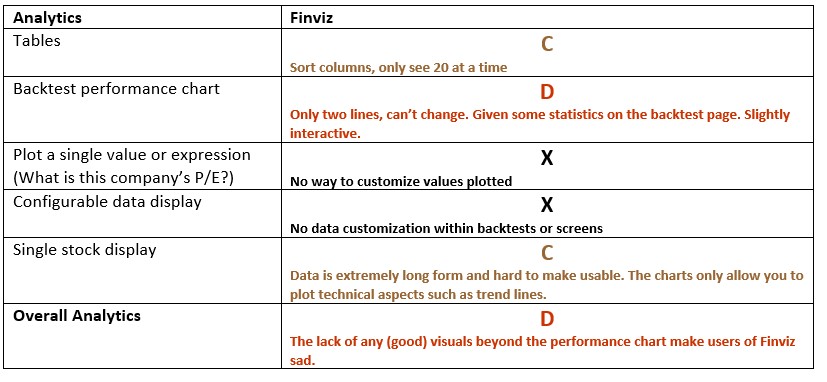
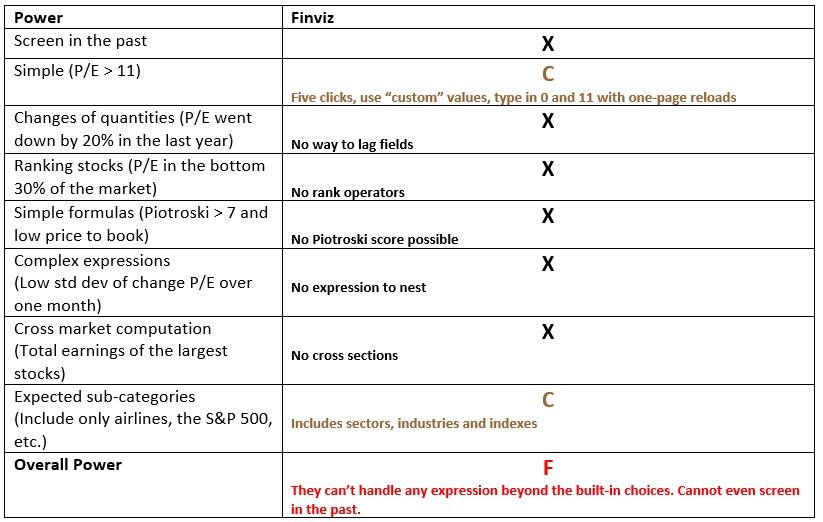
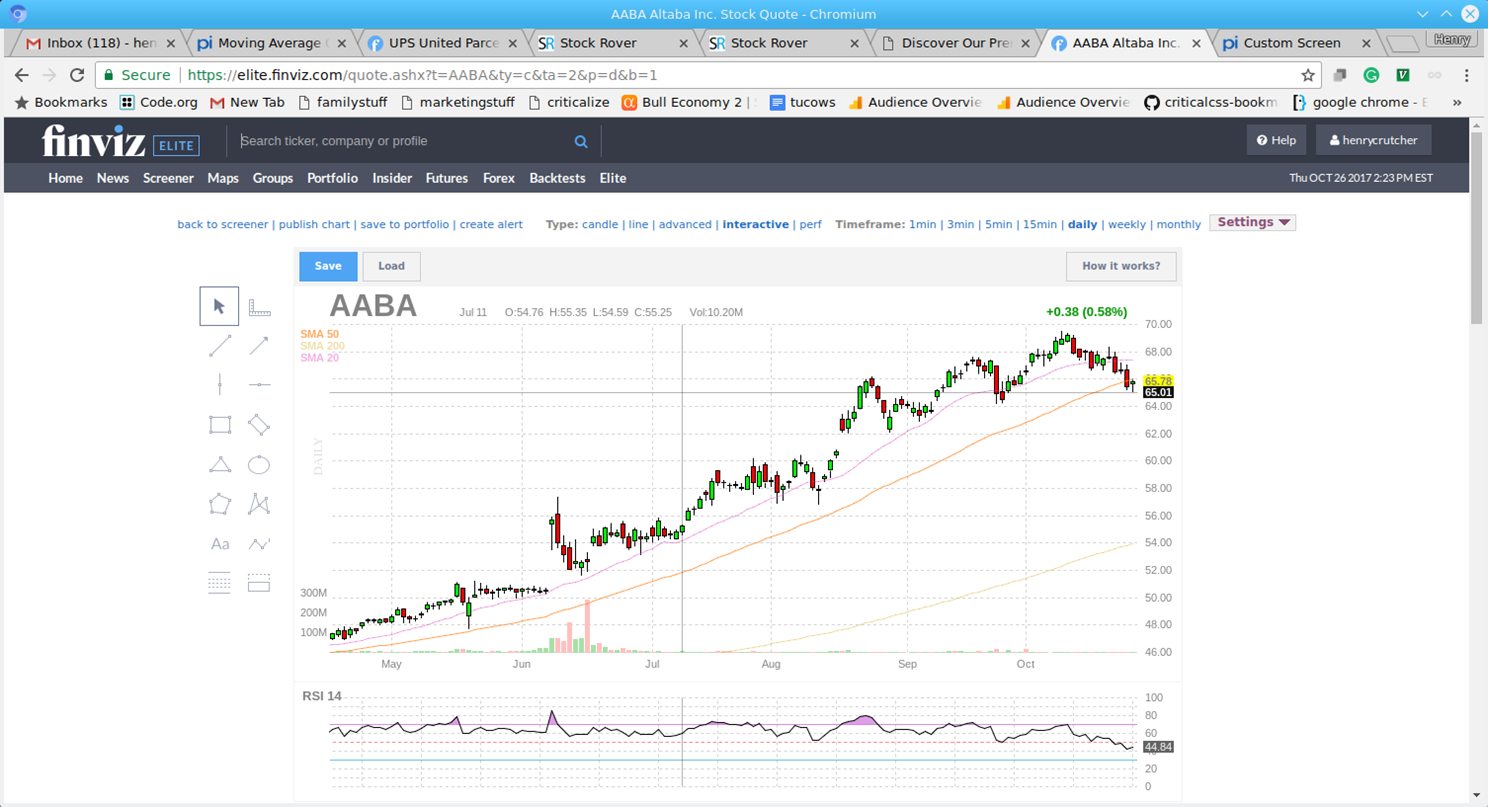
Finviz also has some nice analytics, though its user interface (UI) is much harder to follow, with much more information in each square inch. Its screener is overly simplistic, struggling to express concepts (P/E > 11) that other software handled with ease. Finviz doesn’t have the capability to screen dates other than the present, but it is easy to use.
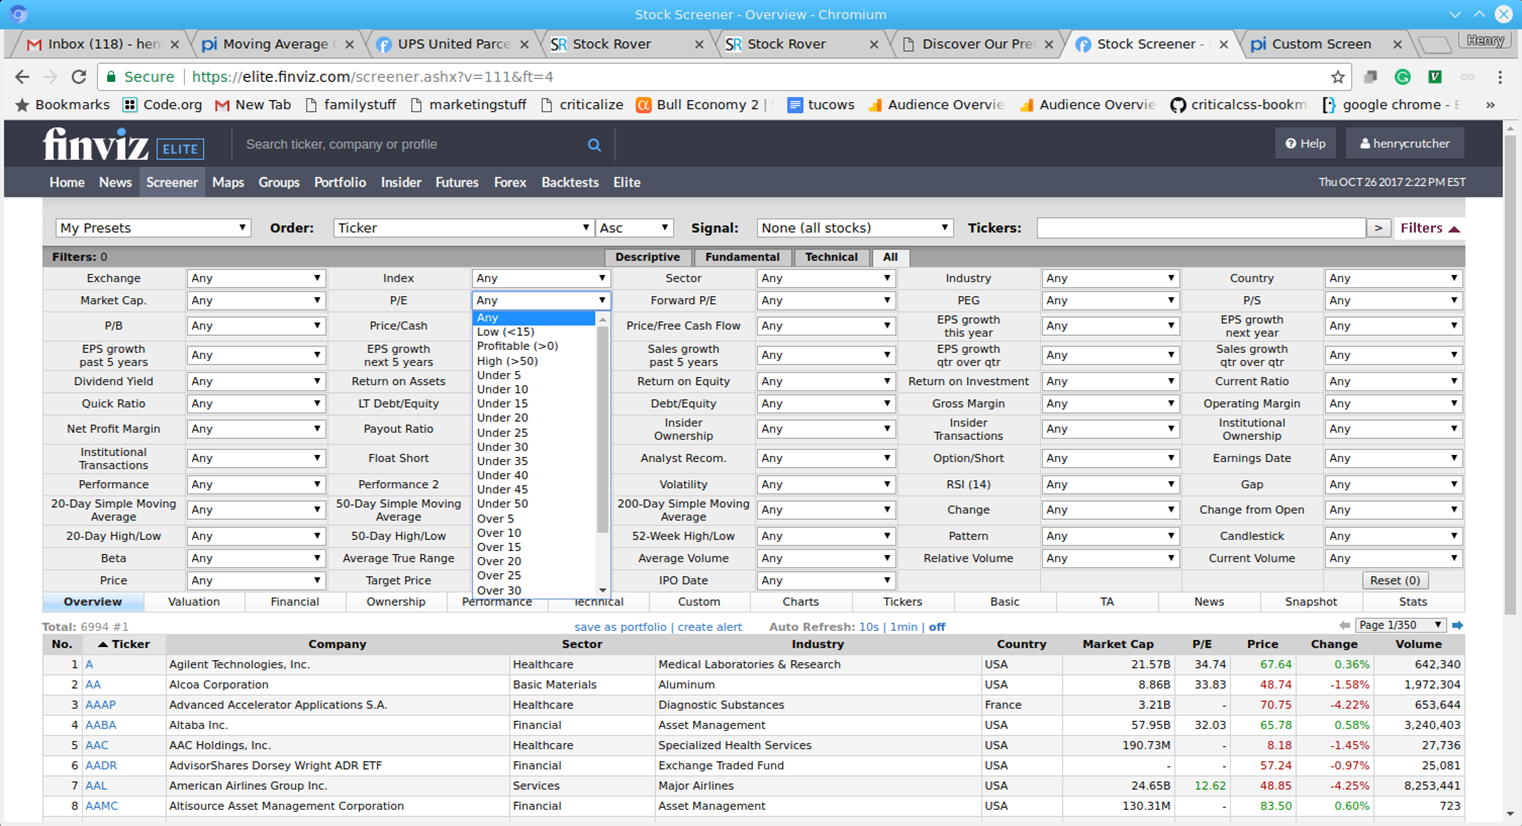
Its tables include an array of information but are somewhat hard to use. Finviz’s inability to plot formulas makes it less useful for screening than Stock Rover. Its single charts come with technical overlays, and candlesticks, making them appealing to investors who like technical analysis.
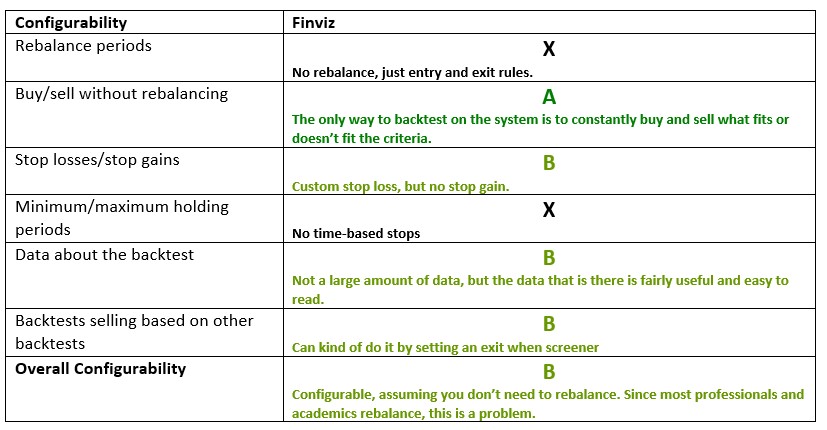
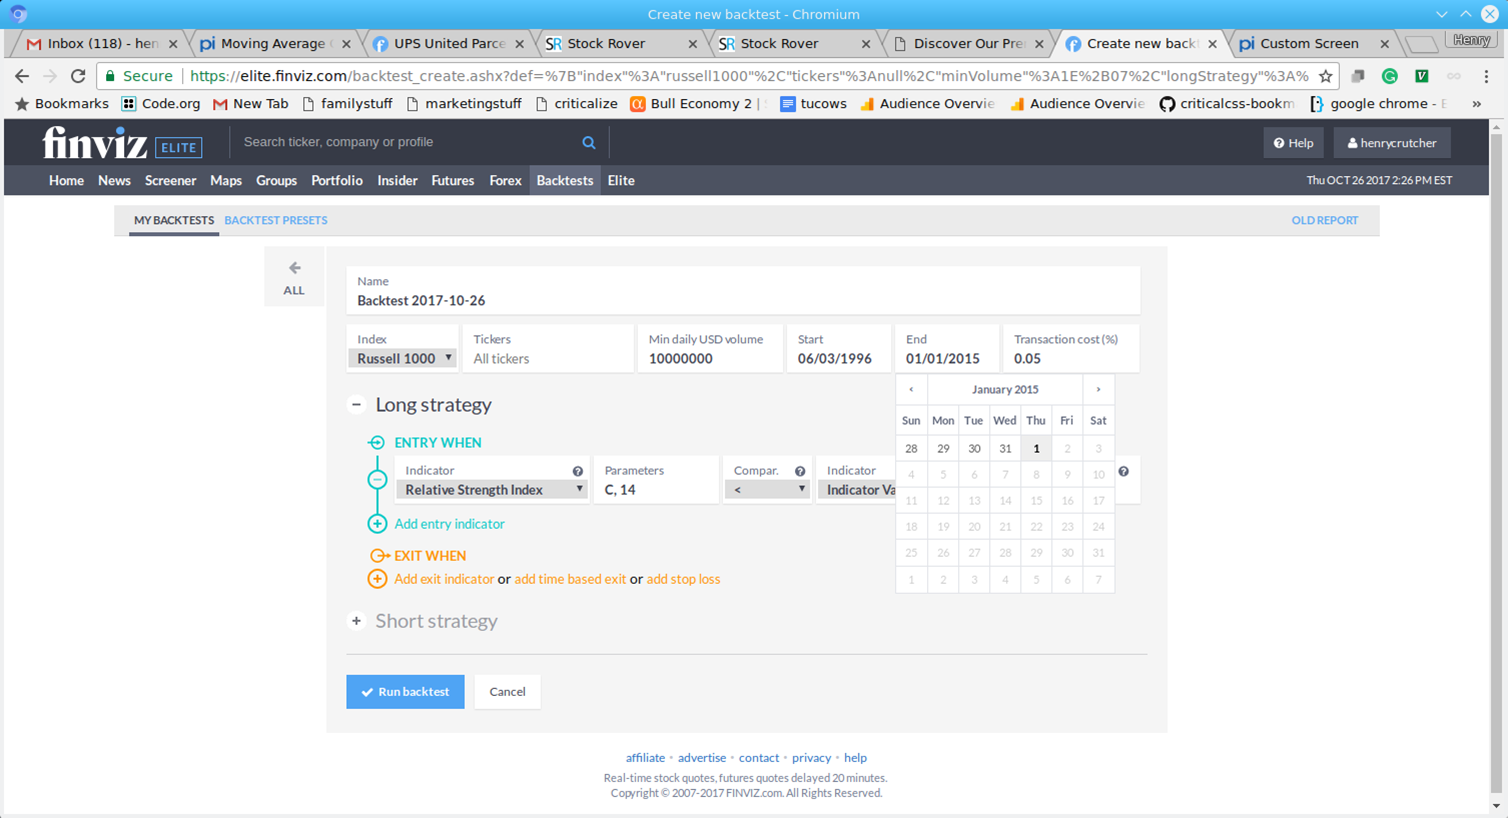
Finviz’s backtester has a UI that allows users to create entry and exit rules for their backtesting. The overall backtester seems able to perform technical analysis and other more challenging tasks. However, although the Finviz screener had fundamental data, that data is totally absent from the backtester.

The software also doesn’t extend past 2014, which makes testing whole portfolios very challenging. Since there is no overlap between the Finviz screener and the Finviz backtester, the Finviz backtester may be less useful for investors.
Detailed Ratings for Profitspi
More on Profitspi

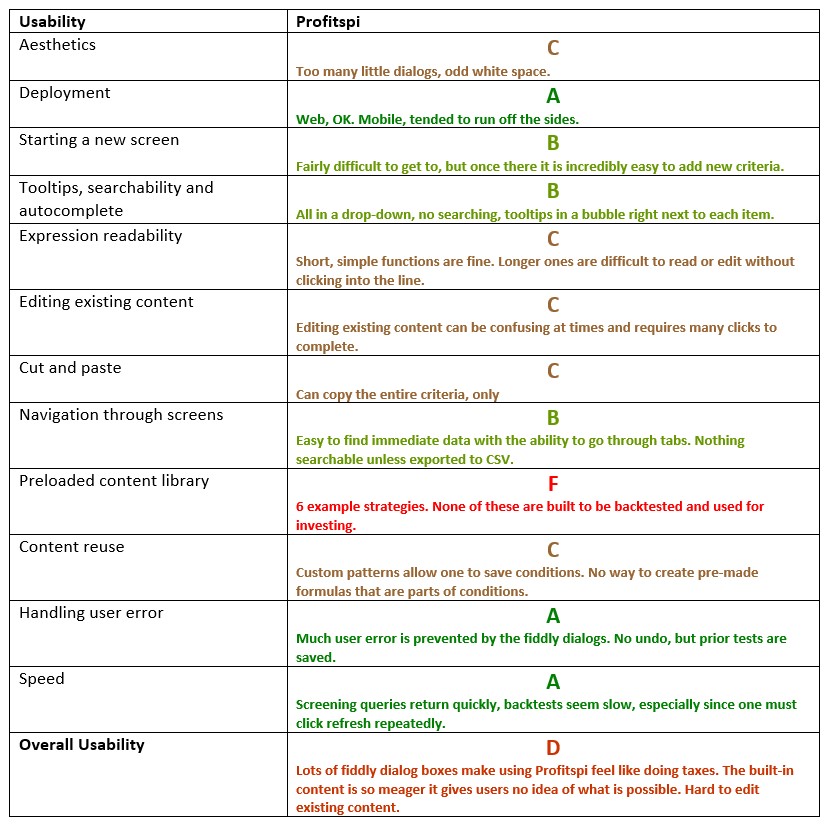
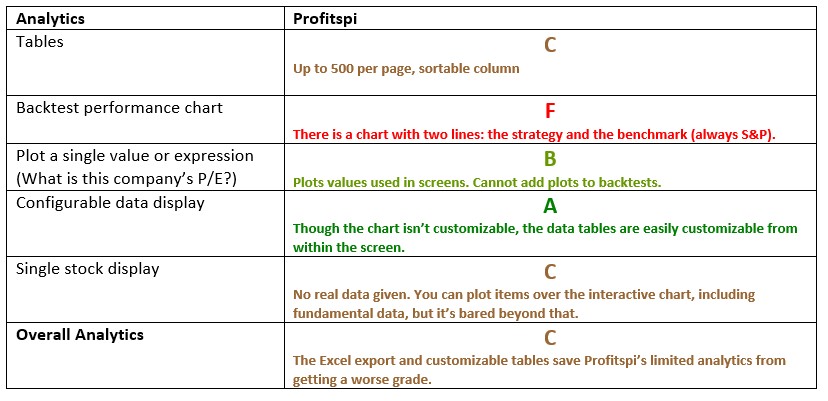
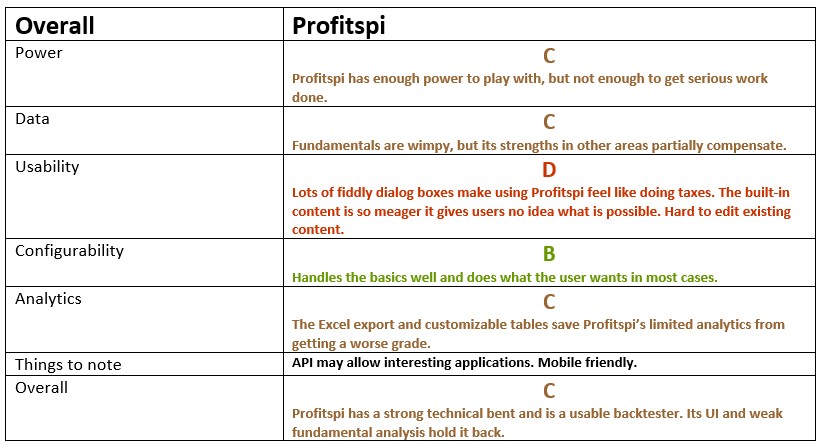
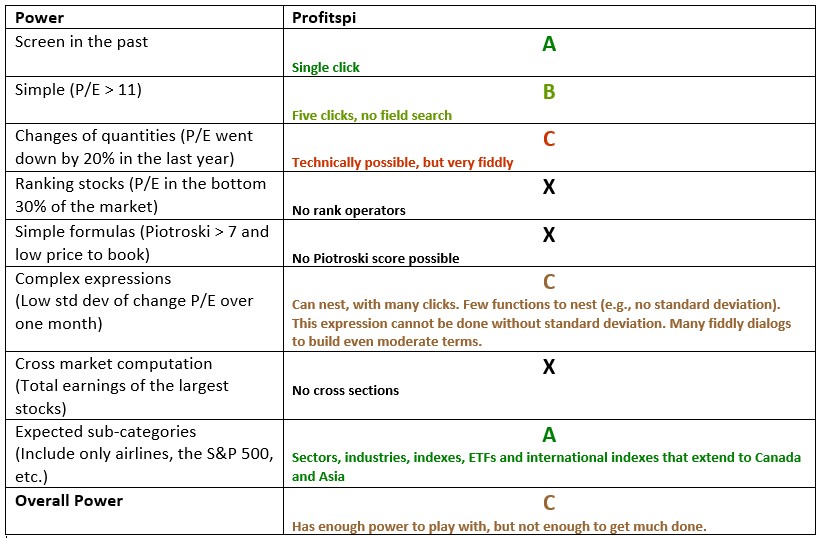
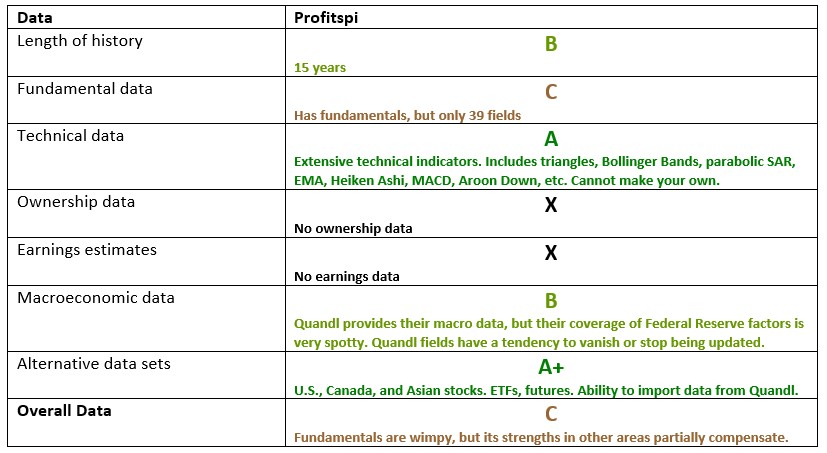
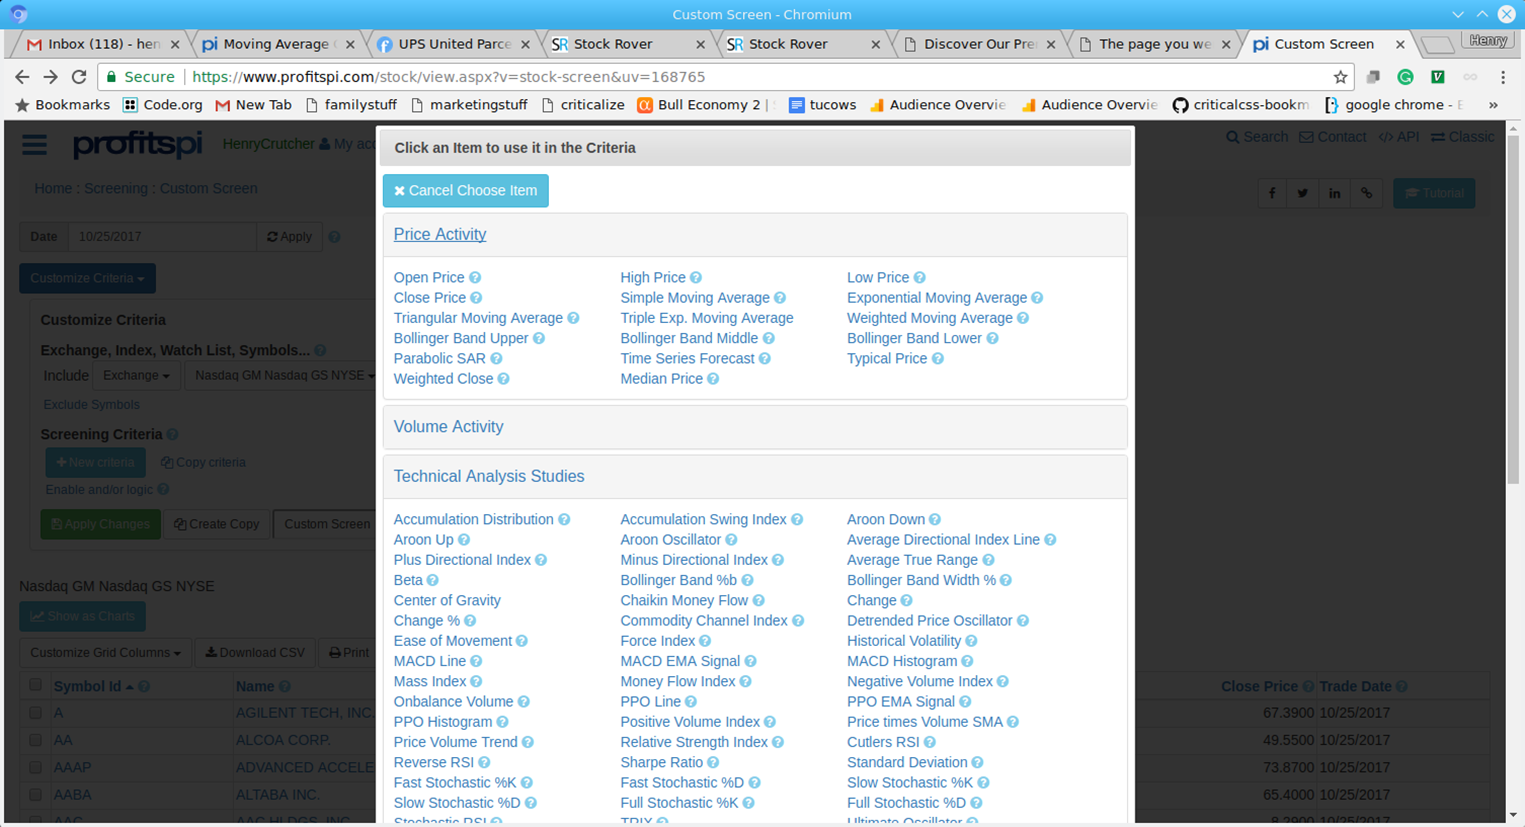
Profitspi allows the user to screen and backtest stocks, albeit with limited fundamental data. Its system lets users add criteria from a fairly brief list, and then customize it with a zoo of little dialog boxes. Profitspi’s interface is effective but tedious and not something that supports complex screens or deep thoughts.
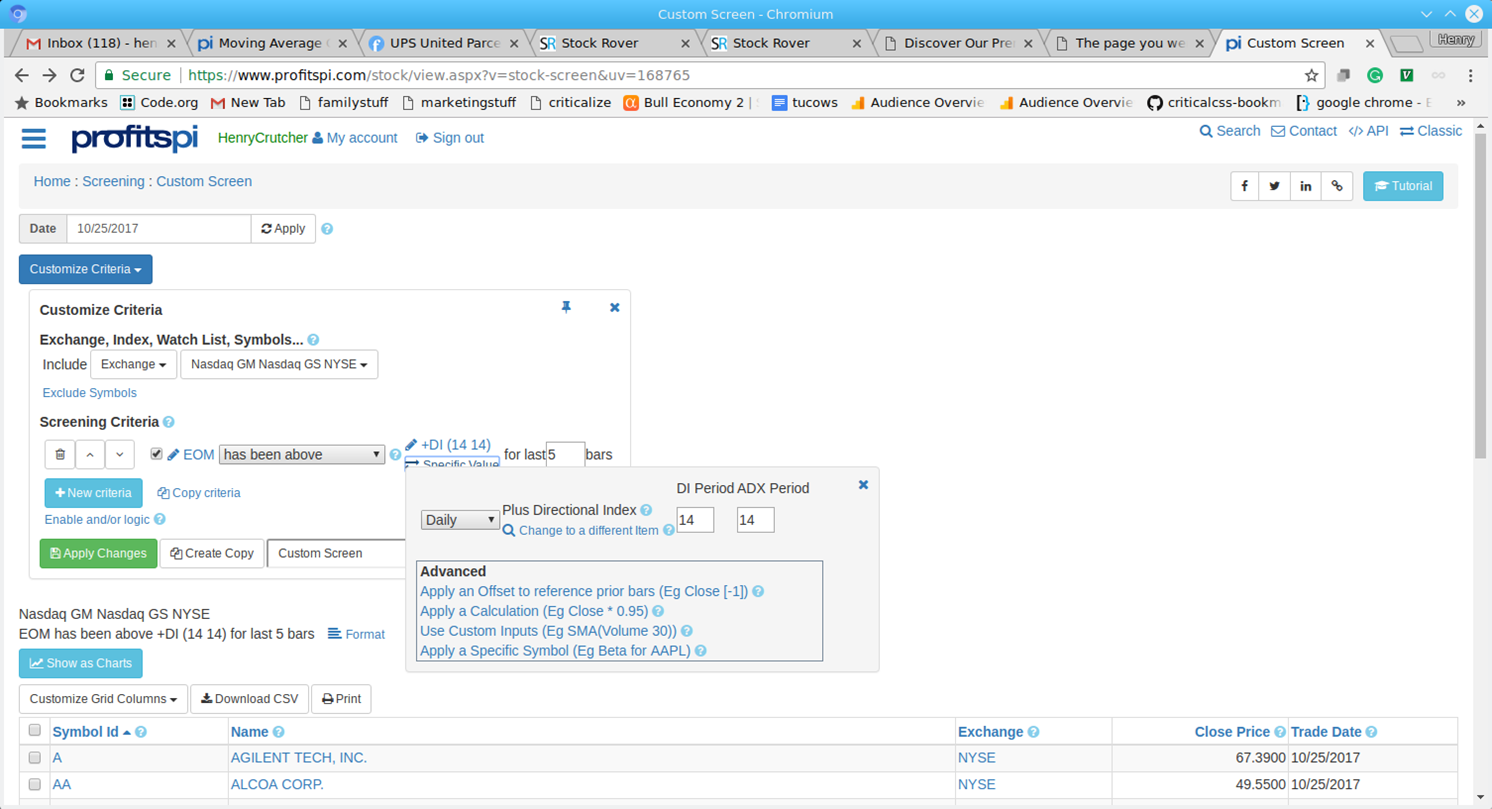
That said, it does work, and it is useful for backtesting a strategy. Profitspi’s lack of rebalance prevents users from reproducing results written about in finance papers (which would be a chore, given the UI). They have a panoply of technical indicators and validating that they do (or don’t) work is something that Profitspi brings to the table.
Detailed Ratings for Portfolio123
More on Portfolio123

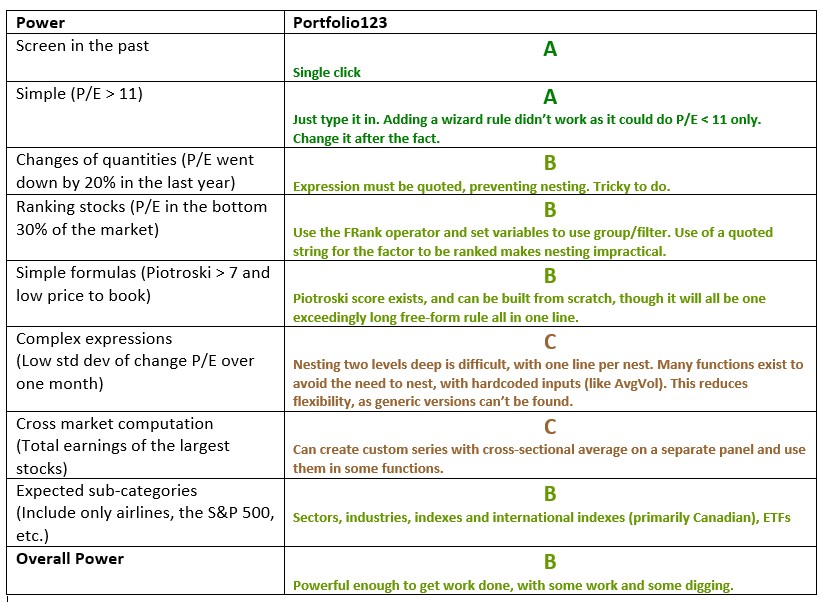
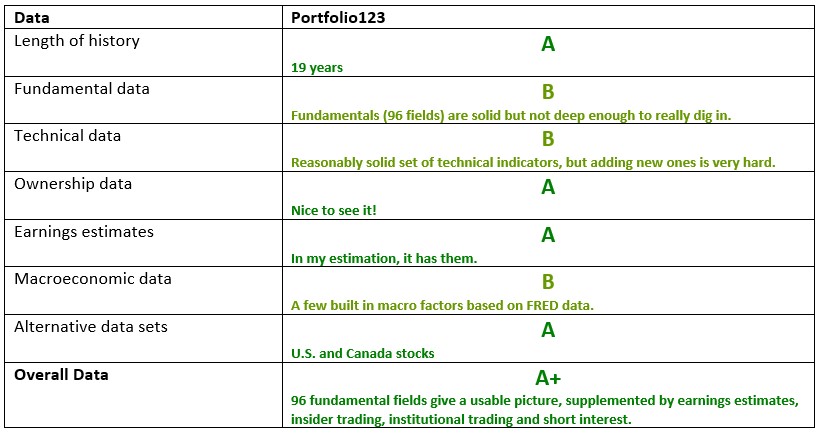
Portfolio123 is a breath of fresh air: Its screener is complex, powerful and mostly gets the job done. The software does tend to restrict users with multiple rules to follow, however.

Its backtester, similarly, is very useful with configurable rebalance intervals and the ability to rank stocks. Portfolio123 can handle large amounts of data (for example, a screen with market capitalization over $800 billion).

On the other hand, users should be sure to filter out nano-caps, because they will skew the results.

Portfolio123 has enough power to replicate some academic results, though representing the results in its language would be a struggle. (The Piotroski score can only be rendered as an exceptionally long line.) Its single stock display is especially useful, with the ability to plot fundamental and technical ratios in the same window.
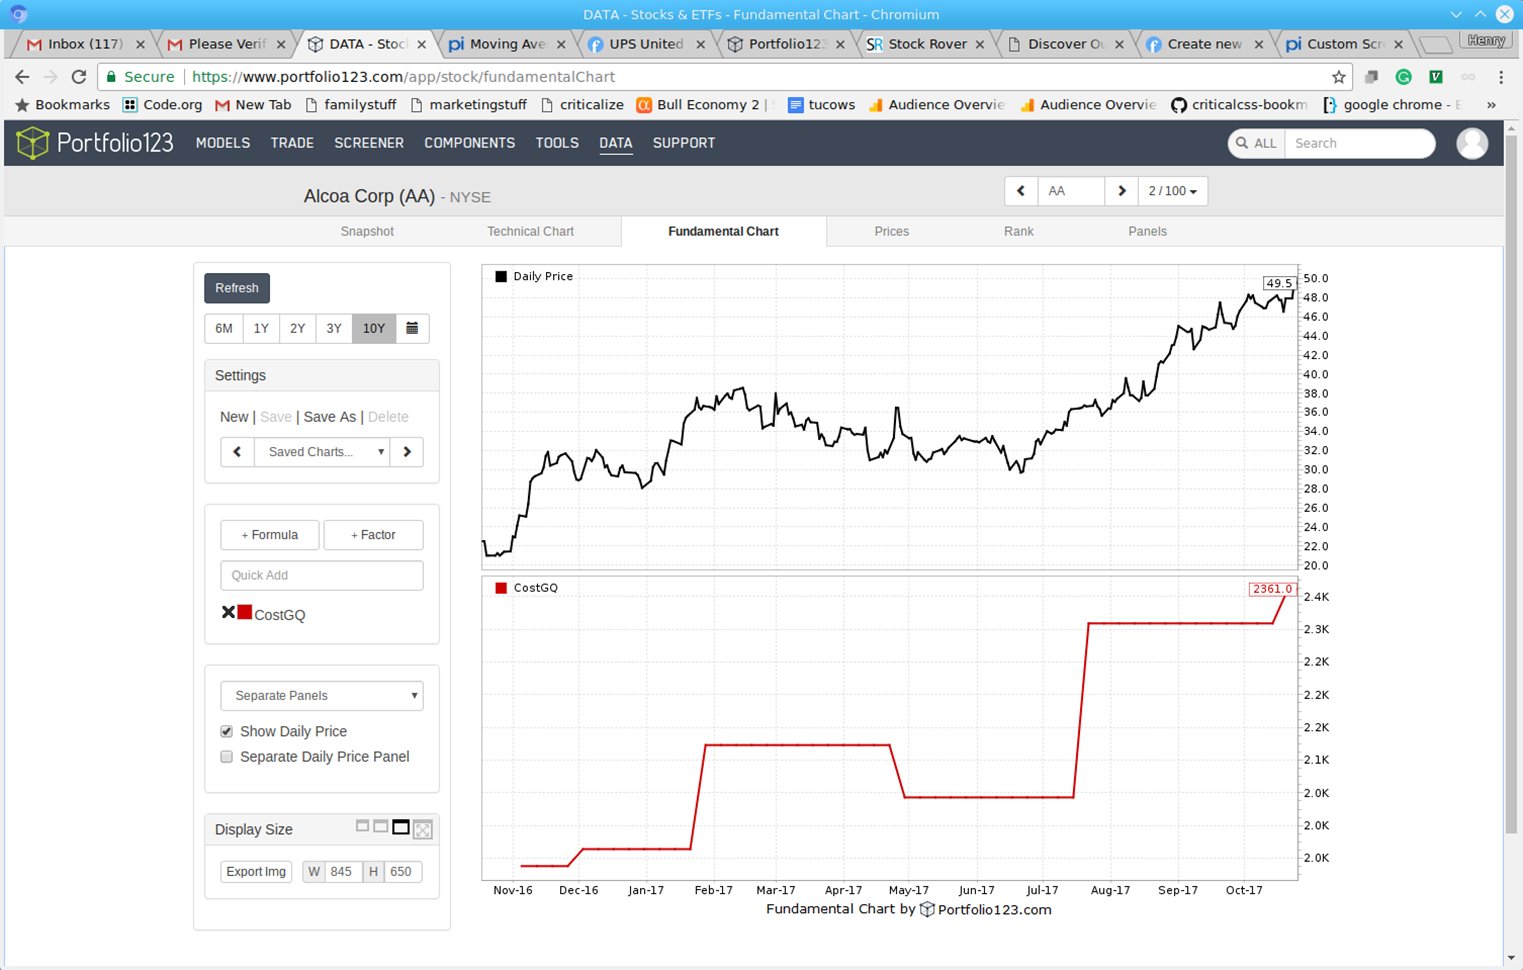
Portfolio123 is not perfect: It is frustrating and difficult (or impossible) to use complicated metrics or implement the sort of real-world complexity that investors need. Its user interface is not as pretty as it could be, and the field names tend toward inscrutable (though tooltips help). Also, its graphics tend toward flat images, and it lacks the glitzy analytics and options that other programs have.

Detailed Ratings for VectorVest
More on VectorVest

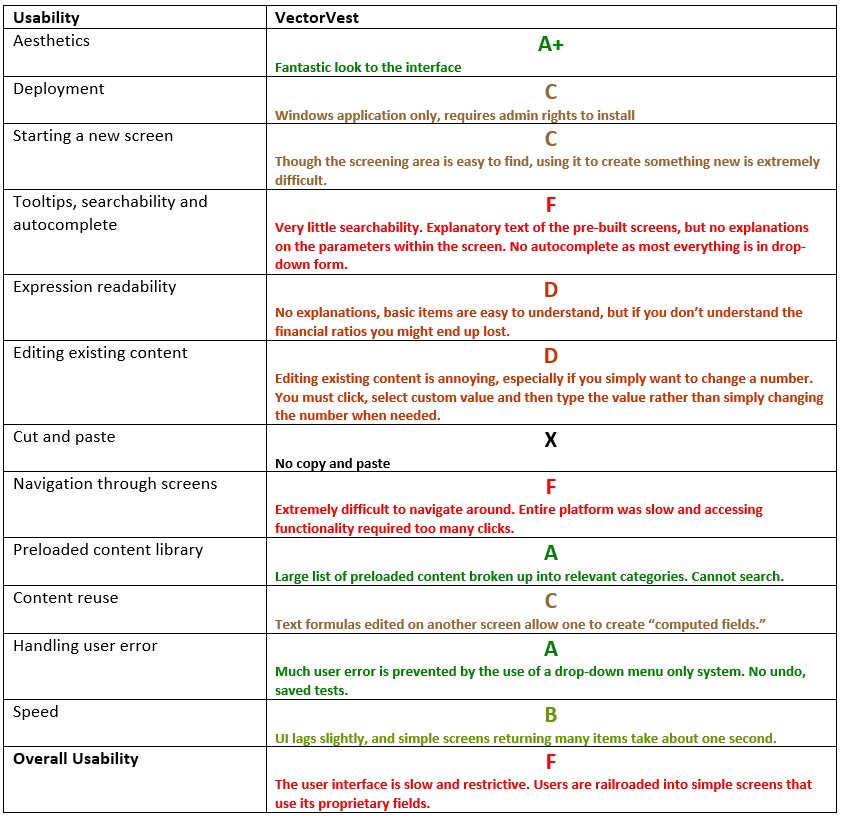
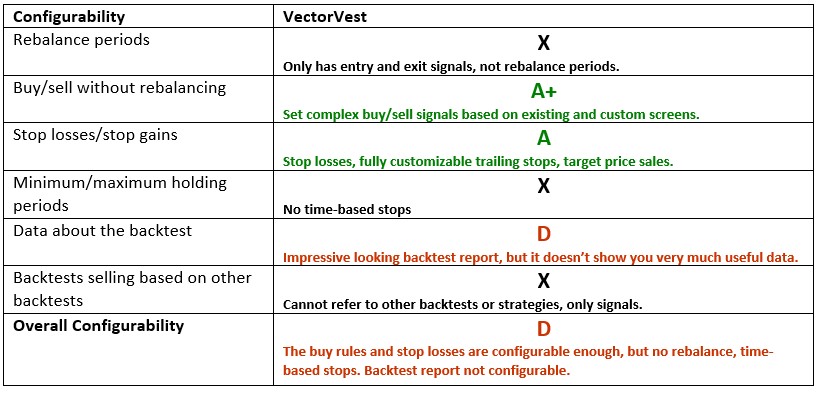
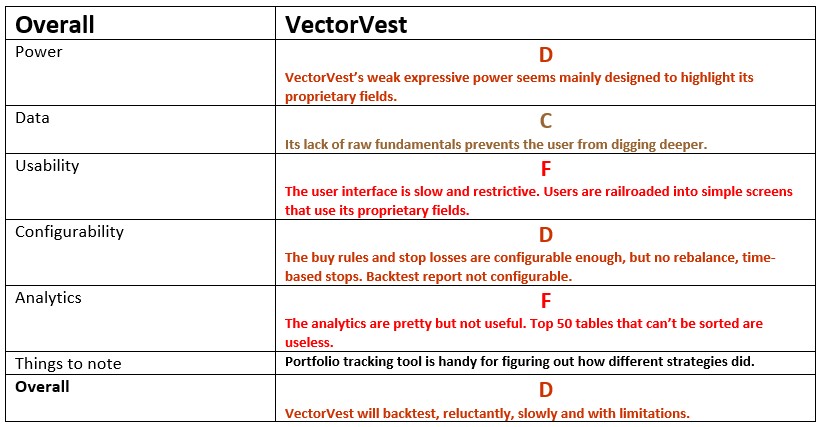
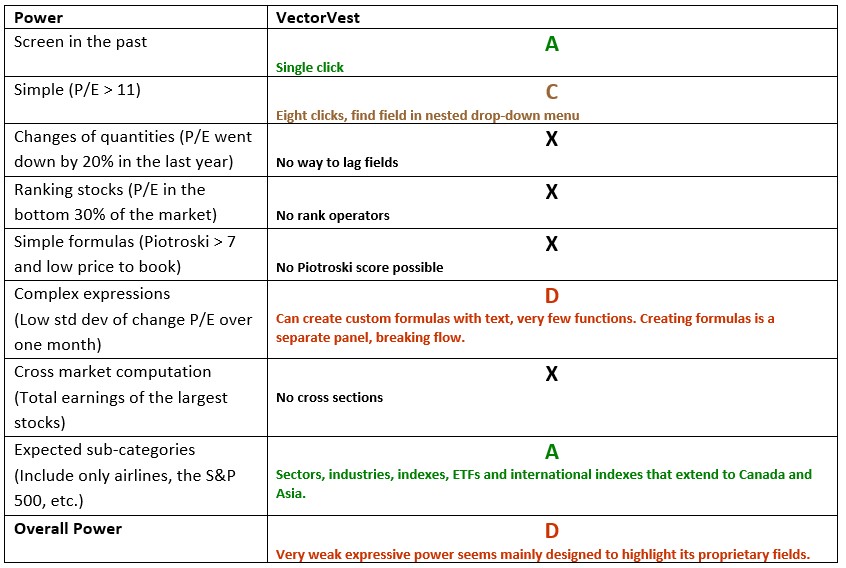
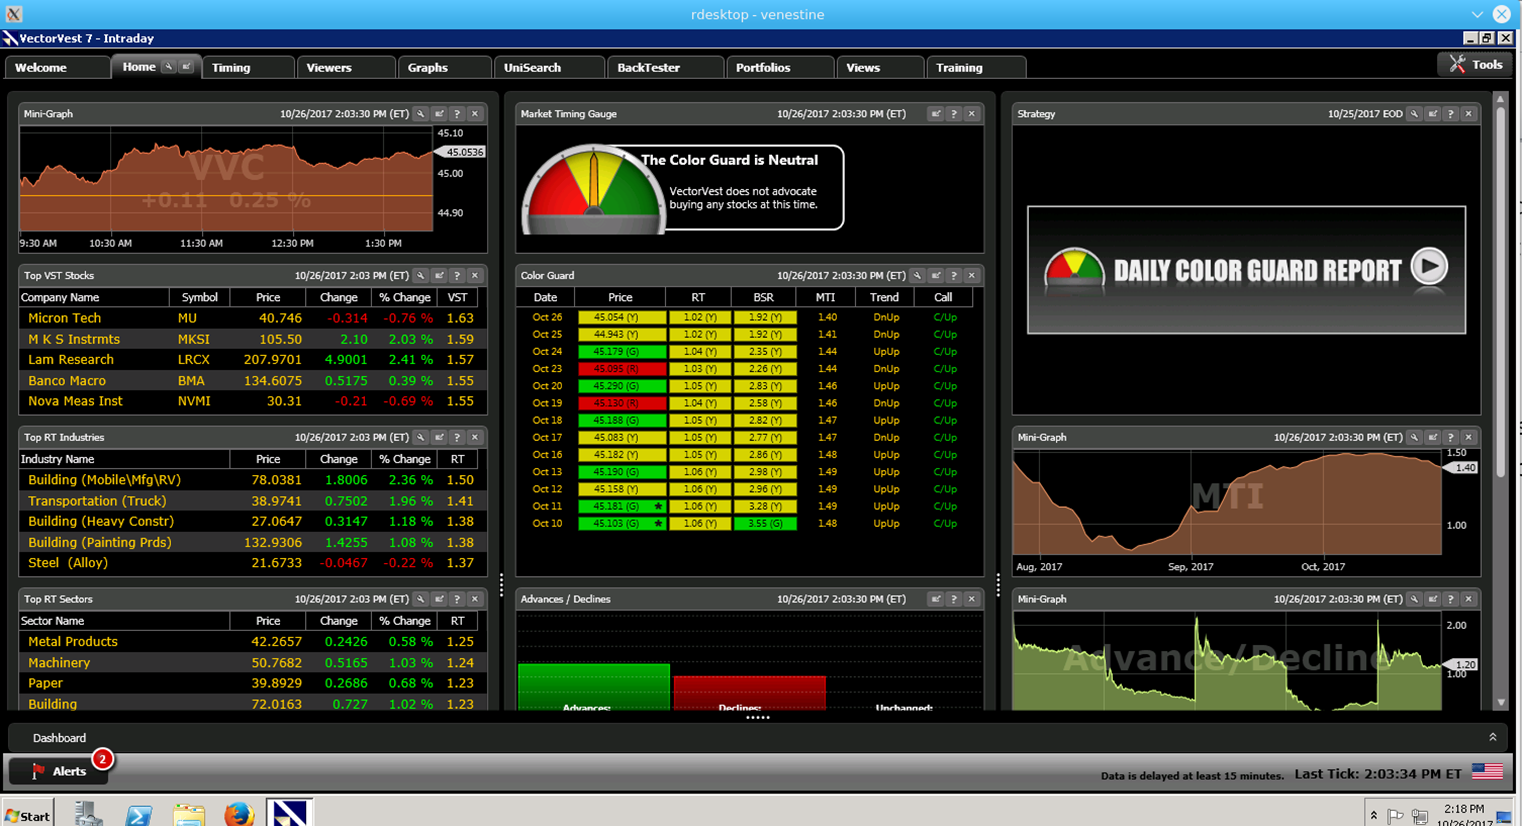
VectorVest looks beautiful, and it has an alluring claim: Use their built-in metrics to crush the market. Unfortunately, it doesn’t give the user enough power to create and validate their own strategies. Since its proprietary metrics are secret, users must take it on faith that they either do or don’t work. VectorVest’s UI is clearly geared toward ensuring that investors rely on its metrics, and tweak around the edges.
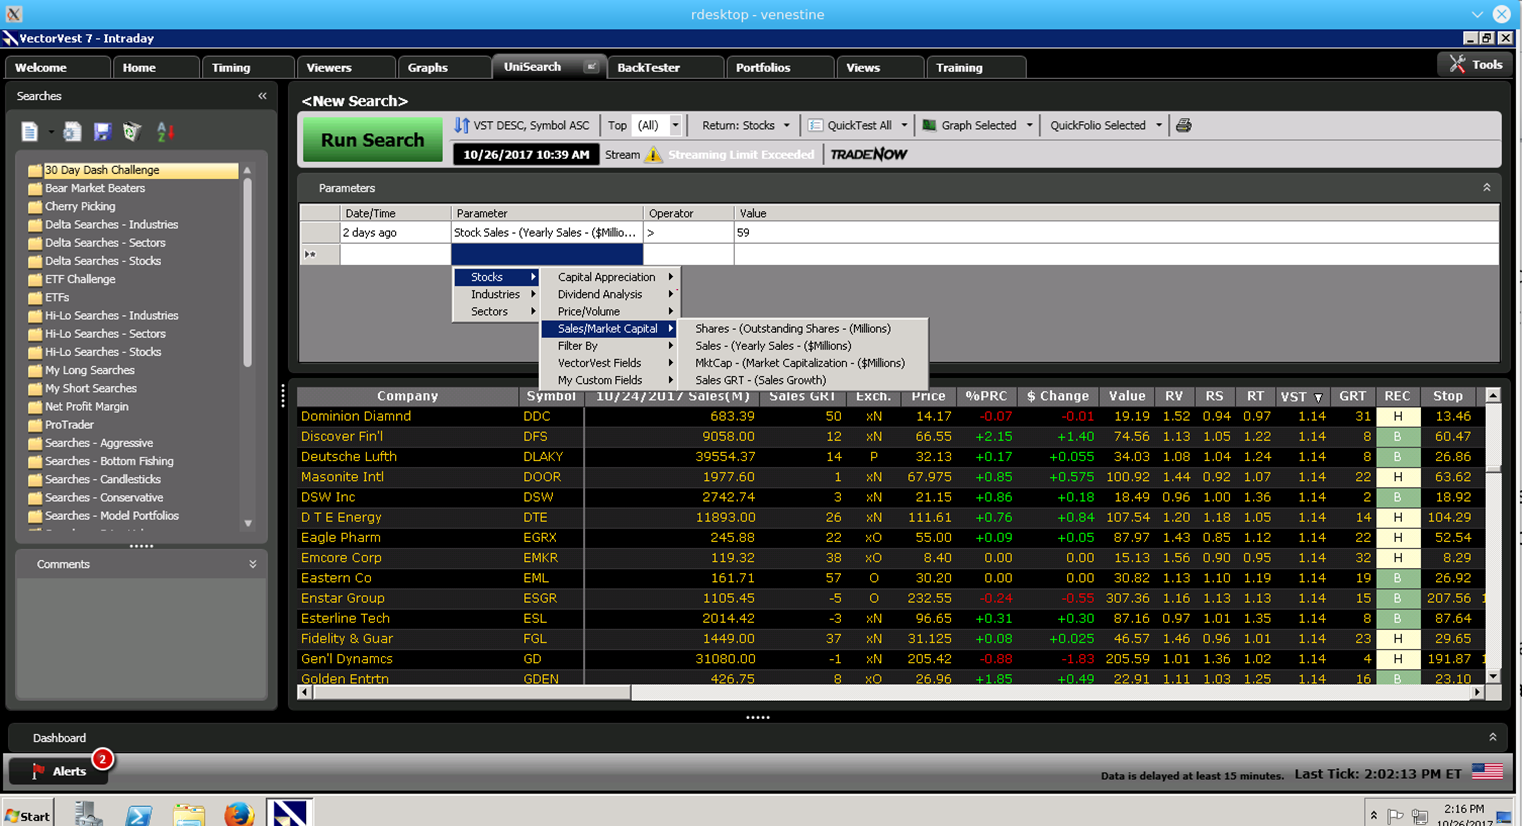
VectorVest’s screener is minimal, with only a handful of fundamental data points, and insufficient power to really do technical analysis beyond moving averages, and the like. For instance, running a screen for sales > $59M pops up a warning that it cannot stream so many results. Attempting to sort the results gets an error that sorting on custom fields is not supported.
VectorVest’s backtester does not have much to work with, given the screener, but one can use the results of a screen to fill a portfolio. The user can also test various stops and navigate based on their proprietary “confirmed up/confirmed down” calls. The lack of full functionality can be frustrating to work with. However, the portfolio management facilities are useful, as you can enter trades in the past, and see how those stocks did from then to now.

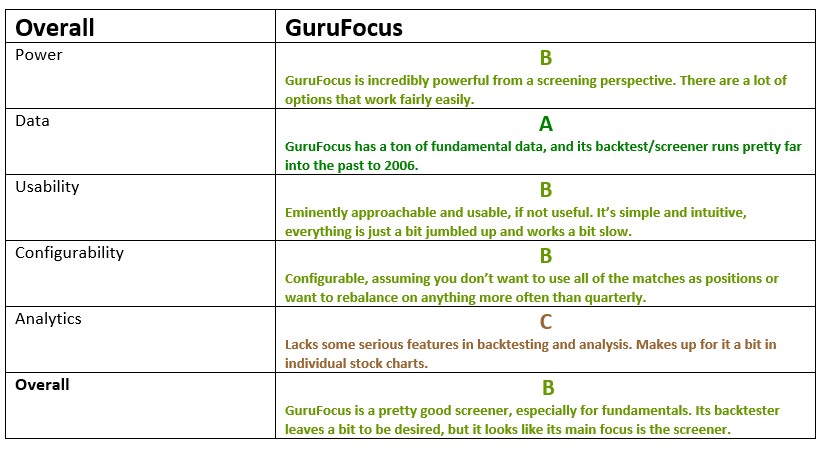
Detailed Ratings for GuruFocus
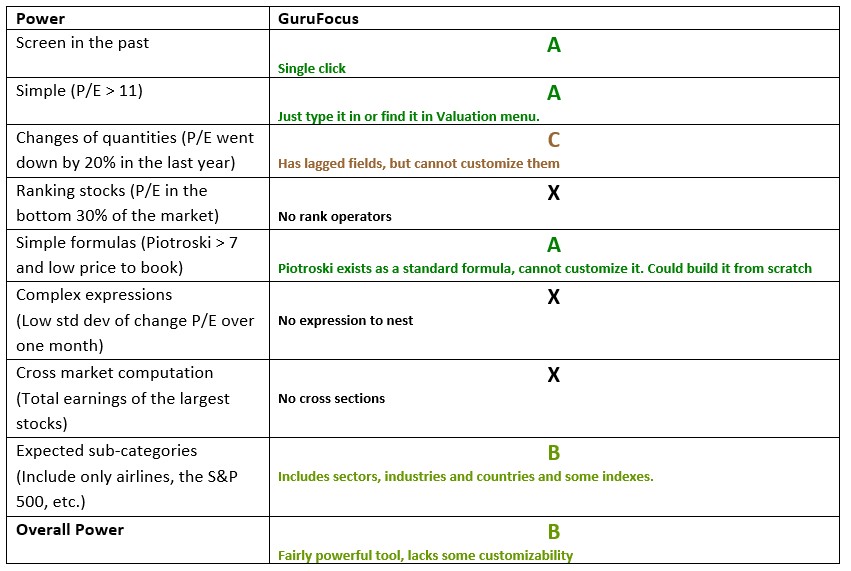
The Bottom Line: Comparing the Best Backtesting Tools and Programs

Getting the right backtesting system is important because of the sheer time you’ll put into your chosen product. This is an exceptionally long article that details six backtesters. Hopefully, if you’ve made it to this point, you have a good idea of what using each backtester entails! Each has its attractions and drawbacks.

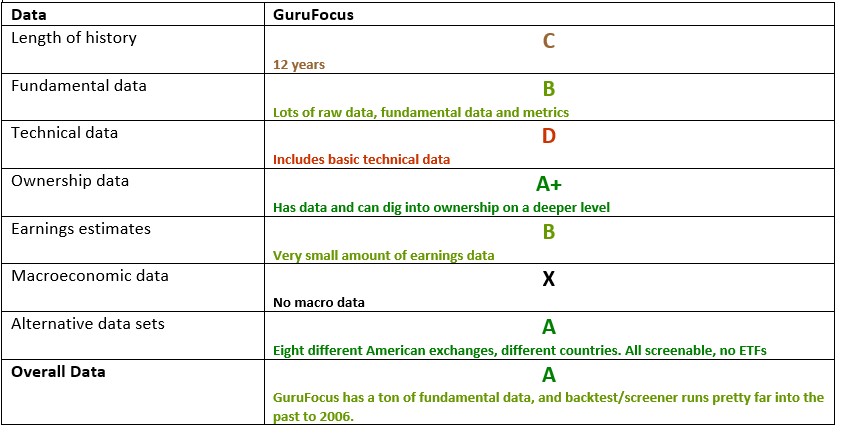
VectorVest has limited functionality and customization, which means it only works for investors who want to use VectorVest’s built-in screeners instead. Finviz has little visual presentation of data and a confusing user interface. Profitspi is effective when doing very specific, small tasks within backtesting. GuruFocus’ screener is its best feature, especially if the investor only wants fundamentals. Portfolio123 has some poor areas but is overall a good backtester.

This article was originally published in the December 2017 edition of Computerized Investing.

Discussion

Charles Wilde from VA posted over 8 years ago:

Congratulations on clearly communicating (despite your bias) a huge amount of practical research. I am a non-quant. Backtesting is of interest because I manage a 50-50 portfolio of about 100 muni bonds and 14 equity ETFs. I need to better understand whether Equities Lab software can assist on the ETF side, particularly in balancing the portfolio to minimize market induced drawdowns. Investment horizon is ultra long term. I guess the question is what ETF data is available? And are there other limitations for ETFs besides inability to conduct screens?


Shane Milburn from FL posted over 8 years ago:

Hi Henry, I'll check your site, but I feel like you slighted Portfolio123 on several counts. I'm far from a pro, but I use Portfolio123 some of the above just feels off base. I'll just touch on a few points. I didn't sift it carefully, these just stand out. You talk about the difficulty of utilizing Piotroski score, but it's straight forward. This line will for example give you Piotroski Fscores of 7 or more PiotFScore >= 7 But that's basic. For real power there are custom formulas if you want to program each individual component separately or add variations and sum them. It's really not that complicated if you want custom variations. But much more powerful and complex systems than Fscore can be constructed by utilizing the "ranking system" tool on portfolio123 which is like a Piotroski Fscore on steroids. This ranking system tool is extremely powerful and the heart of system building on portfolio123 - but I don't think was mentioned at all. When working on systems I probably spend 75% of my time in that tool. But you control the comparison tables, so if you don't feel the ranking system tool is worthy of mention, i don't know what to think. It's a crucially valuable tool and important part of most systems built on p123. As to ease of ranking based on percentiles, if I want the top 10% of passing companies based on my ranking system I enter the rule in the screener: Rank > 90 If I want 75-90 percentiles I enter Between(Rank,75,90) I'm sure there are pros and cons to any coding system, but it's pretty easy to carve out percentile grouping in practical ways if I need them for analysis. (And I do this often when just feeling out how a ranking system works when combined with a universe of particular characteristics). I just glanced through other parts of the tables, but Port123 has stops (table says it doesn't) in the simulations and live portfolio section when you're adding buy/sell rules. I find stops don't tend to help much for diversified systems I build (and usually hurt) so don't use them, but they are there. Also in buy/sell rules in the simulations you can also set time based stops (table says you cannot) for evaluation using the NoBars function. (I haven't used it as it doesn't seem required for what I do, but it's there for those who want it - perhaps as criteria to make sure a position is not sold too quickly). On Port123 I doubt many users utilize the wizards beyond the first few days. They're like training wheels, but users will quickly move to simply writing the direct code. I moved from AAII Stock Investor Pro to Port123, and transition was straight forward - not much different than making a custom calc in the AAII SIPro database. The code seems well thought out / not complicated at all imho. I guess I find the port123 tool extremely powerful and usable. My impression is that the portfolio123 team goes to great lengths to make sure data is clean and accurate point in time so that history is recreated accurately (not trading on data that wasn't actually available historically at specific points in time.) Maybe the other vendors do this also, I don't know - would've been a very important point of consideration/discussion imho. Anyhow, I'll check out your site, I just feel some things were a little bit off in the discussion re: p123. thanks,


Michael Martin from PA posted over 8 years ago:

Oy vey! Where to start? Perhaps with my bias: I've been using VectorVest for about four years. OK, let's first admit that it's going to be virtually impossible to find someone familiar enough with all the different backtesting suites evaluated to do an adequate evaluation. But I found the evaluation of VectorVest to be flat out wrong more often than it was right. Being a software engineer by trade I am intimately aware that familiarity with one produce makes other products seem foreign and unwieldy even when they really are not. There is one burning question I do have that was not even addressed with regard to the datasets used. A symbol that is no longer valid (company is bought out, goes bankrupt, whatever) is removed from the ENTIRE VectorVest database, all the way back to the starting date. That makes backtesting results highly questionable. I would like to know how this is handled in the datasets used by the other vendors' backtesting software.


Robert Mcnamara from FL posted over 8 years ago:

A very good article but as one who has been using different back testing platforms as a principal source of income for more than a decade I personally would rank Portfolio 123 ahead of Equities Lab. I first became aware of Equities Lab in 2014 and found it lacking compared to P123. Later when Sugata Ray published "Principles of Quantitative Equity Investing" which is based entirely on the Equities Lab I bought the book and took another look at EL. EL's backtester/screener has improved dramatically over the last 3 years and I agree with Mr. Crutcher their usability / ease of use is the best. The only major limitation compared to EL's major more expensive competitor P123 are the lack of data (earnings estimates, insider trading and short interest) all of which I personally use in several of my screens.


Burt Gearhart from IA posted over 8 years ago:

Why was Portfolio Visualizer not included???? It is 100% free.


Seth Wu from CA posted over 8 years ago:

Really should include Fidelity's Wealth Lab, even though it is only available (for free) if you have a Fidelity account. I think it is miles and decades ahead of most others.


Marc Gerstein from NY posted over 8 years ago:

I’m not at all surprised that the founder of Equities Lab would pronounce Equities Lab the "clear winner." I am, however, disappointed that he mis-represented Portfolio123, which he seems to acknowledge as his main competitor. So I think it’s only fair that I, the Director of Research at Portfolio123, respond. Much of the shortchanging of Portfolio123 comes from the author’s having limited his review to our screener, which is just one part, the most basic part, of the platform – the functional equivalent of an on-line sketch pad in which you can rough out some ideas. But when our users want to get real, get serious, they move to the Portfolio interface, where you can simulate real-life portfolios in much more comprehensive ways and if they want to go beyond that, create “books,” which are master portfolios that combine individual portfolios (a great way to test diversification between US equities and fixed income ETFs, US equities and foreign ETFs, etc. And when users find that after as much testing and revision as they wish to do that they are ready to put money to work, they can use Portfolio123 to give them signals for real world trading based on live portfolios and, for those who want, auto trade them on Interactive Brokers. By the way, this is all included together with our screener. This is where most of our truly powerful capabilities live. As the author says, FRank, is, indeed, the function used to rank -- in a simple sense. The review failed to mention an entire (and major) part of Portfolio123 dedicated solely to the building of multifactor ranking systems that can be as complex or simple as the user wants. In fact, Marc Chaikin;s two ETFs, CSML and CLRG, are based on a ranking system he developed on and which currently resides on Portfolio123. Use of ranking systems and screens is very powerful. You can for example, create a screen that returns, say, 50 stocks, or 150, or 500, etc. and then use a ranking systems to identify the top 10, or top 20 9or however many stocks you’re willing to own or study further). You can test the entire result set, or just the small sub-set you actually want to own. Have you ever wondered about smart beta? With Portfolio123, you can do it. The default is equal weighting, but you can change that to formula weighting. The formula can be market cap, revenues, dividends, or any other thing, however simple or complex, you want. You can even use one of your ranking systems as the basis for weighting. Contrary to what the review stated, Portfolio123 does allow for stops (trailing or entry based). It was incorrect to state that Portfolio123 is limited to item AND item AND item . . . It uses OR statements as well. The author also failed to mention an entirely separate backetest mode; rolling. Suppose one does a test from 1/2/99 to the present rebalancing every four weeks. How do we know the result wouldn't have differed, possibly by a lot, if he had started on, say, 4/17/01 instead, or 11/14/08, etc. With low turnover models, the start date can have a major influence on results. Portfolio123 users test for that with rolling backtest; assume a self-contained portfolio with a 4-week holding period. Do a new one that starts a week later, and then another, etc. You can average these 4-week results to get a sense of the whole, or eyeball to see times when the model was strong or weak. Did you know that with portfoli123 you could also test short strategies, long-short strategies, the impact of use of margin, the impact of trading costs, use of hedging and market timing strategies? You can! What about Sell rules? A screen presumes that at the time it is refreshed, stocks that would no longer pass the screen are sold. You can use this approach on Portfolio123. But you don't have to. You could create a set of sell rules that is completely independent of the Buy rules. For example, you could buy if P/E < 20 and 5Yr eps growth > 15 and ROE > 20. but when it comes to selling, you could, if you wish, sell only when an estimate is cut or when the stock goes below the lower Bollinger band or a 5 day moving average falls below a 20-day average, etc. As to data, I’m not sure how the author’s platform handles survivorship and look-ahead bias, but Portfolio123 eliminates both with its “point in time” database. With Portfolio123, you can also include rules based on economic rather than company data. Since the author took the liberty of rating his own platform as the best, I’ll do likewise and claim Portfolio123 is head, shoulders and much more, above any other platform available at any price. Who is right? That’s up to you to decide for yourselves.


Howard Reisman from MA posted over 8 years ago:

As the CEO of Stock Rover I find this article interesting on several fronts. First off is Stock Rover's inclusion in a backtesting article to begin with, when Stock Rover doesn't backtest nor do we claim to. I believe Stock Rover has many virtues to help investors discover and analyze potentially good investment opportunities, but backtesting isn't one of them. Aside from the author's lack of understanding on what Stock Rover is and isn't, I find it stunning that AAII would publish an article where the founder of a company gets to rank his product against competitors and then shockingly win the competition in a landslide with an A+ ranking. Not one of AAII's finer moments in providing useful and unbiased information to investors.


Henry Crutcher from GA posted over 8 years ago:

@Marc Gerstein Thanks for your comments. I spent a week or so learning Portfolio123 (not continuously), and am grateful for feedback that highlight things I missed. You bring up several points, and which I'll deal with one at a time. 1. Long/short, portfolio weighting, rolling backtest, subscreens, et al -- Here Portfolio123 fell afoul of me trying NOT to unfairly favor Equties Lab. Equities Lab and Portfolio123 are the only platforms to support these features, albeit in different ways, and they seemed beyond the scope of "ordinary backtesting". There were already so many thing that only Equities Lab and Portfolio123 do that I got picky about including yet more. 2. Portfolio management -- Portfolio management is not backtesting, and fell outside the scope of this article. There are many portfolio managers out there. I didn't want to review Advent, et al, because they have no backtester at all. Therefore, the only fair thing to do was to focus on backtesting. If/when I do a review of portfolio managers, I would definitely include Portfolio123. 3. Stops in Portfolio123 -- Good catch! I missed that one. I'll ask to get that changed. 4. item AND item AND item --How do you switch the top level expression to ORS? 5. FRank and ranking -- I found nesting FRank operators cumbersome. I emailed support and asked them how to nest before writing the section, as I was worried I was missing something, but there seemed to be no easy way. 6. Sell rules -- Yes, Portfolio123 supports sell rules, which is clearly included in the feature matrix, so this comment puzzles me. 7. Survivorship/Lookahead bias -- I state that both Equities Lab and Portfolio123 do not have survivorship bias, and handle lookahead bias. Perhaps I should have enphasized that point more, as it is a very important one, as really no one should use a backtester that does not handle both. Thanks so much for your comments! Henry


Henry Crutcher from GA posted over 8 years ago:

@Howard Reisman, Stock Rover was included because the internet said it was a backtester, as did your blog, SeekingAlpha, and Barrons. Check Google search on the keywords "stockrover backtest", and you'll see that it's widely believed. As to your comments on bias, I am upfront that I am the CEO of Equities Lab; I'm not hiding anything. I do, however, include pages of information as to WHY I came to the conclusions I do, and I'm eager to fix anything I may have gotten wrong.


Henry Crutcher from GA posted over 8 years ago:

@Michael Martin, Thanks for the comments. One of the goals I had in writing this review was to understand the other packages out there. Could you respond with where I'm off base with respect to VectorVest? I'll then correct these, and update the record. As far as your survivorship bias question, I know that Portfolio123 and Equities Lab both keep dead stocks in their database, so that their removal doesn't skew the results. I didn't know that VectorVest did not keep these companies, but now I do. StockRover also does not keep these companies.


Henry Crutcher from GA posted over 8 years ago:

@Seth Wu, I didn't include Wealth Lab because you have to have a brokerage account with Fidelity to use the software. It isn't available for a fee, so far as I know.


Henry Crutcher from GA posted over 8 years ago:

@Shane Milburn, I am now regretting not including a row "Take top 50% of stocks based on field X", where Equities Lab and Portfolio123 both get an A, and other products get other grades. The places I gave Portfolio123 a hard time were nested rank expressions, and deep complexity. For instance, I know that Portfolio123 has a built in Piotroski score. That's not the point. The question was can Portfolio123 handle complicated expressions, and, if so, how. It does quite well there. The other packages were comparatively hopeless on that front. As to stop losses, that's a goof on my part. I'm trying to get that fixed. I'm glad you find Portfolio123 good to use -- I agree. I like my own tool, for the reasons set out above, but I'm biased. I tend to want to create insanely complicated formulas, and use ranks and overall market conditions in unusual ways. I'm the person who wants to remix the piotroski score to make it work better :-).


Henry Crutcher from GA posted over 8 years ago:

@Charles Wilde, Thanks for the kind words! I suspect we might be of limited help: we have ETF price data, accessible by ticker, and that's it for ETF's. We can then weight those differently based on a zoo of conditions, and go from there, back to 1995. I don't know if that's useful, but there it is :-).


Henry Crutcher from GA posted over 8 years ago:

@Robert Mcnamara, Thanks for the comment! I'm always reassessing which data I should have, and would love to know what sorts of screens estimates and ownership would enable. I found I was unable to get enough use out of them to make them worth the cost, but that seems to me to be a problem with me, and not the data.


Henry Crutcher from GA posted over 8 years ago:

@Burt Gearhart, I didn't include Portfolio Visualizer because it looked like you had to select the stocks in advance, with no screening component. That makes it very hard to test many of the strategies that are the bread and butter of more conventional systems. I also didn't see fundamental data per stock. It really seemed more like an investment planning tool than an backtester or screener.


Jackie McClellan from IL posted over 8 years ago:

First of all - thank you to everyone for the really detailed feedback, this is why we do articles like this! It is definitely difficult to fully review software products without spending a ton of time (continually) using a given product. I'm glad that this article has generated so much discussion and this is what we strive for. Mr. Gerstein, you and I can discuss what was inaccurate about Portfolio123 and updating it accordingly (my email is jmcclellan@aaii.com). I would also offer that we have someone from Portfolio123 write an article about how to use the software and its capabilities - I know many of our members use Portfolio123. Mr. Reisman, thank you for your comments. I love Stock Rover! I apologize that your product was reviewed when you don't technically have a backtesting tool. In regards to AAII not provided useful and unbiased content - There was a lot of information in this article that many subscribers have found useful. We are "unbiased" in that we don't assert our personal opinion when possible and try not to advocate any "one right way". But there are many point of views in the different articles we publish. For example, we have some articles on Smart Beta when not everyone agrees with it or wants to use those strategies, we have articles on technical analysis when many people may argue technical analysis isn't useful, value approaches versus growth, etc. etc. (I know it's not quite an apples-to-apples comparison.) I knew I was taking a risk letting the owner of a product review his own product - but I am glad at the conversation it has generated and hopefully we can get some updated information into the article. Knowing Henry, either way, I am sure that he tried his best to be objective. With Computerized Investing I have given subscribers the ability to write articles based on their experience with different software programs. I find that many of our subscribers know these software programs much better than I would hope to if I attempted to do a quick review. I thought in this article as long as we made it abundantly clear that Henry was reviewing his own software, it would be an article worth publishing. I also thought he did a good job of going through the basic components of some of these products - I'm sorry that you feel otherwise. If there is anything that needs to be corrected regarding Stock Rover (or if you want it removed) please let us know. Additionally, I know we have had Stock Rover articles in the past, if that's something that interests you please let me know. My email is jmcclellan@aaii.com


F Floyd from OH posted over 8 years ago:

I'd like to second the previous comments on the value of dealing with path-dependency of results. While I clearly understand the wide variation that one can obtain just by selecting a different starting point, I do not have a clear understanding of what one should do about that. Monte Carlo techniques are commonly utilized for forward-looking projections, and for look-back what-if comparisons, but I'm not aware of what consensus might exist (if any) on how to treat this issue. I seize on this, because individual investors are at the mercy of history, not having the ability to go back for a do-over. So what should we be doing in our analytical efforts to compare software (or anything else) that is so dependent on choice of actual time interval?


Henry Crutcher from GA posted over 8 years ago:

Path dependency of results is a real problem in any investment software! That's one of the reasons I tilted in favor of products that rebalance. Without rebalancing, portfolios gain massively or lose hugely based on whether they did or didn't buy AAPL in 1995, and hold on. In the buy case AAPL dominates the portfolio, and this choice skews all the results. That's part of the reason I included flexibility of when to rebalance as a factor, and why the analytics are so important. If your results are great because one stock went up 5,000%, you need to have a way to find that out. Other than that, and use of things like monte carlo, and a healthy dose of skepticism, I'm not sure what oen can do. Perhaps rely on common sense to vet the results.


Michael Caron from MA posted over 8 years ago:

I rated article a 4 out of 5 and plopped down $50 yesterday for my first month with Equity Labs to try it. The article covered a lot of factors on the plus side, though it does seem very biased in the text comments. I have not found a better article. I would like to second the earlier comment about Wealth-Lab as a potential candidate. The Fidelity Investments version is available to US customers that are frequent traders, and has minute data in additional to higher time frames, as well fundamental data to use in trading strategies. You would need to roll up your sleeves with Wealth-Lab because the wizard-based strategy designer will only take you so far. Once the complexity gets past a certain point hopping into C# will be more effective. The good thing is that your wizard-based strategy can be converted to C# so you can continue moving forward. For Charles Wilde that needs help with ETFs, I remember reading an April 2016 article in "Technical Analysis of Stocks & Commodities" about Sector Surfer. Their tools were based on fund-rotation strategies. It seemed liked an interesting approach, though I have never tried it.


Garry Lundy from GA posted over 8 years ago:

Congratulations Henry for bringing Equities Lab to market. I attended some of your early development groups. I really appreciate the feedback and discussion. It is very hard to evaluate complex software. Everyone is commended for keeping it professional. Henry, you need the ETF characteristics.


Marc Gerstein from NY posted over 8 years ago:

To Jackie McClellan, It’s been a hectic month so I just now noticed your response to my comment. I’m definitely interested in taking you up on the idea of an article about Portfolio123, and I followed up by sending an emial to the address you indicated. Look forward to talking further. Marc Gerstein Portfolio123


ROBERT A from NC posted over 3 years ago:

I'm disappointed that none of these services offers more than 27 years of data. That's way too short to provide reliable long-term results. I sure wish I could use the datasets O'Shaughnessy used in his books.


You need to log in as a registered AAII user before commenting.
Create an account

Log In

Get your free copy of our special report analyzing the tech stocks most likely to outperform the market.

Download the FREE Report Here: