Stock prices do not move in isolation. While there are numerous company- and industry-specific issues that can impact a given company’s stock price, the overall temperament of the market also plays an important role in dictating the course of individual stock prices.
The financial press likes to quote the movement of major market indexes, such as the Dow Jones industrial average and the S&P; 500, as a barometer of the stock market’s overall health. However, the movements of many stocks are not effectively captured by most major market indexes.
For this reason, many investors turn to market breadth indicators to gain a feel for the full range of stocks participating in the movement of the market. These breadth indicators are the aggregate of data from multiple stocks, and are often used to determine whether the market is in an uptrend or downtrend, as well as to identify market tops and bottoms.
These tools are often used by technical analysts for market timing. But they also can help fundamental investors gain an understanding of what is currently taking place in the markets. It is this latter use that we’ll focus on in this article.
Stock Market Diary
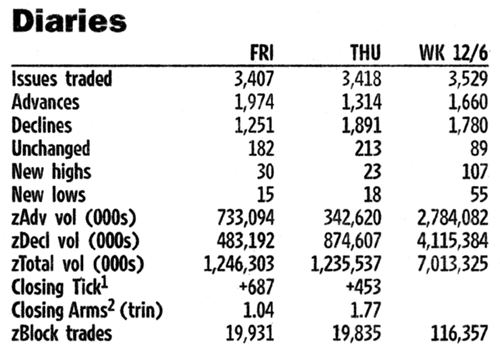
Trading statistics are updated throughout each trading day and are available from numerous on-line sources. However, a summary for a day, based upon the market close, provides a useful example. Figure 1 presents a daily summary from the “diaries” section of the December 9, 2002, Wall Street Journal. The information shown here covers only those stocks listed on the New York Stock Exchange (NYSE), although summaries are available for the Nasdaq and the American Stock Exchange (Amex) as well.
Issues Traded
The first statistic provided in the diaries section is “Issues traded.” This number represents the number of NYSE-listed issues in which trades occurred on the exchange during the given trading day or period. Generally, the more active the market in total trading volume, the more issues traded. However, this number will typically be close to the number of stocks listed on the respective exchange—approximately 3,500 on the NYSE, 3,500 on the Nasdaq, and 700 on the Amex. Daily monitoring of this statistic is not worthwhile, as it does not vary significantly from day to day.
Figure 1.
Wall Street Journal's Diaries
|
|
CLICK ON IMAGE TO
SEE FULL SIZE.
|
|
Advancing/Declining Issues
Statistics regarding the number of issues advancing, declining, and unchanged are worth noting. When most stocks are participating in a general market upswing, the market is said to have good breadth. Comparing the number of advancing issues to the number of declining issues provides an indication of market momentum. Advancing issues are stocks that have closed higher than their previous day’s close. Declining and unchanged issues are similarly determined relative to the previous day’s close. When these statistics are quoted in the media, they typically refer to New York Stock Exchange stocks. Adding the number of advances, declines, and unchanged issues together equals the number of issues traded.
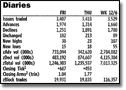
In Figure 1, on Friday, December 6, 2002 (FRI), the number of advances was 1,974, declines 1,251, and 182 were unchanged from the previous day’s close. The total of these (1,974 + 1,251 + 182) equals the number of issues traded on Friday—3,407.
Advancing, declining, and unchanged data can be further manipulated, giving rise to several other indicators, including the advance/decline ratio and the advance/decline line.
Advance/Decline Ratio
The advance/decline information is often reported as a ratio: “advancing issues outnumbered declining issues three-to-two,” for example. This ratio ignores the number of issues that closed unchanged for the day. The advance/decline statistics in Figure 1 are for December 6, 2002, a day when the Dow industrial average gained 22 points after losing almost 272 points over the prior four trading days. For this day, 1,974 issues advanced while 1,251 issues declined—advancing issues outpaced declining issues by a little better than three-to-two.
The advantage of this ratio is that it remains constant regardless of the number of issues that are traded on the exchange. A moving average of the advance/decline ratio is used by contrarians as an overbought/oversold indicator. The higher the ratio—advancing issues outpacing declining issues—the more apt the market is to be overbought and, as a result, the more likely a correction will occur. Similarly, low values—declining issues outnumbering advancing issues—imply that a market is oversold and poised for a rally. Keep in mind, however, that a market can remain in an overbought or oversold condition for extended periods of time. For that reason, technicians often wait for prices to confirm the market’s position before acting.
Advance/Decline Line
Another way in which market analysts examine the number of advancing and declining issues is by tracking the differences between the two and accumulating and plotting those differences over some time period. The advance/decline line is the simplest of all breadth measures. When more stocks are advancing than declining, the advance/decline line moves up, while a majority of issues declining pushes the line downward. Whether the advance/decline line is rising or falling provides an indication of the market’s overall strength.
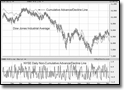
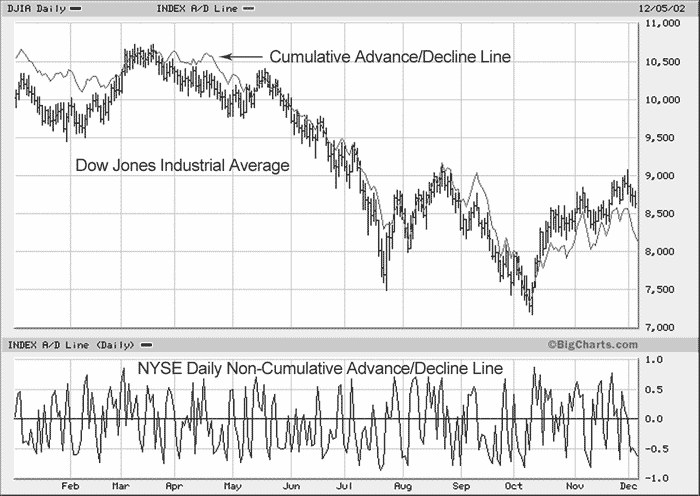
Figure 2 is a screenshot taken from the BigCharts Web site (www.bigcharts.com) that presents a year-to-date chart for the Dow Jones industrial average, along with a cumulative advance/decline line in the upper window and the NYSE daily, non-cumulative advance/decline line in the lower window. The NYSE non-cumulative advance/decline line is calculated by subtracting the number of declining NYSE issues from the number of advancing NYSE issues and then dividing that figure by the total of issues traded. Generally, non-cumulative advance/decline values above 0.25 are considered “bullish,” while values below –0.25 are considered “bearish.”
When comparing the movement of a market index to that of the cumulative advance/decline line, investors should take special note when divergences between the two develop—the index is declining while the advance/decline line is rising, or vice versa. When this occurs, technicians look for the index to eventually follow the trend in the advance/decline line. In addition, because the cumulative advance/decline line begins at zero for whichever time period is being used, the numeric value of the cumulative line is of little importance. What investors should focus on is the slope, pattern, and direction of the cumulative advance/decline line.
Unchanged Issues Index
The unchanged issues index is calculated by dividing the number of unchanged issues by the total number of issues traded. This ratio, normally expressed as a percentage, is used by some technicians to help gauge whether the market is at a transition point. The ratio is normally low when the market is moving strongly—either up or down—but relatively high during periods of consolidation or congestion, when the number of unchanged issues tends to rise. Generally, the normal range for this index is around 15%, with an expected range between 5% and 25%. On December 6, 2002, the index was relatively low 5.3% (182 issues unchanged divided by 3,407 issues traded).
Absolute Breadth Index
The absolute breadth index indicates strong market participation without regard to the actual direction of the market. It is calculated by examining the absolute difference between the number of advancing issues and declining issues and dividing the value by the number of shares traded. Expressed as a percentage, it is virtually the opposite of the unchanged issues index. The greater the disparity between the number of advancing issues and declining issues on a given day, the higher the absolute breadth index will be. The ratio can range from 0.0%, where the number of advancing issues equals the number of declining issues, to 100.0%, where all of the issues either advanced or declined for the day. On December 6, the ratio was 21.2% [(1,974 – 1,251) ÷ 3,407], indicating a relatively low level of participation among the New York Stock Exchange stocks in the market’s move. [Note that the term “absolute” means that the index would have been the same if 1,251 issues advanced and 1,974 issues declined (1,251 – 1,974).] The absolute breadth index is an “activity index,” where high readings indicate market activity and change, while low readings indicate lack of change. Furthermore, the index is often averaged over a period of weeks to help gauge the consistent participation of the broad market in the overall movement.
Figure 2.
Advance/Decline Lines
|
|
CLICK ON IMAGE TO
SEE FULL SIZE.
|
|
New Highs & New Lows
Companion statistics to the advance/decline number discussed earlier are the number of stocks reaching a 52-week high or low for the day. Figure 1 shows these statistics for the NYSE, although they are also reported for the Nasdaq and Amex. Increasing numbers of stocks reaching new highs coupled with fewer stocks reaching new lows are generally representative of bull markets, and the reverse is true in bear markets. On December 6, 2002, 30 stocks reached new highs and 15 hit new lows.
Investor’s Business Daily includes a daily section that not only lists the number of stocks hitting new 52-week highs and lows for each exchange, but also lists each of the stocks, broken down by industry. This helps to identify industries that are leading or lagging the market. Within these industry groups, the companies are ranked by greatest daily increase in volume.
Volume
Volume—the total number of shares traded—is confirmation of market movement. If share prices are rising or falling, it is more meaningful if the accompanying volume is high. When volume is low, trading is thin, and buy/sell decisions can create disproportionate moves in the market. On December 6, 2002, total trading volume was below the year-to-date NYSE daily trading volume of 1.44 billion shares with 1.24 billion NYSE shares exchanging hands.
Volume can also be looked at from the standpoint of the volume for those stocks that have advanced in price (advancing volume) and those that have declined in price (declining volume). One would expect advancing volume to surpass declining volume during market uptrends and lag during periods of market decline. In the case of December 6, 2002 (as shown in Figure 1), which was an up day for the New York Stock Exchange, advancing volume outpaced declining volume 733 million to 483 million. Volume that does not confirm the overall trend in the market—divergence—typically indicates that the index will reverse to match the trend in volume.
Breaking total volume into advancing volume and declining volume adds greater understanding to market movement. The trading volume on December 6, 2002, confirms the upward movement in the market.
The upside-downside (volume) ratio is calculated by dividing the advancing volume by the declining volume. When the ratio is above 1.0, the trading volume in stocks that are rising in price is outpacing the volume in stocks whose prices are falling. As the ratio approaches 0.0, the volume of declining issues is far outweighing the volume of advancing stocks. On December 6, 2002, the upside/downside ratio was 1.5 (733,094,000 divided by 483,192,000). For the year through December 6, 2002, the up/down ratio for the NYSE has ranged from virtually zero to 14.65.
Tick
One of the most sensitive measures of minute-to-minute market activity is the tick. The tick, which is calculated continuously, is the number of stocks trading higher than their previous trade less the number of stocks trading lower than their last trade. A positive (plus) tick—more stocks trading higher than their previous trade—is bullish, and a negative (minus) tick—more stocks trading lower—is bearish. A large plus tick indicates that the short-term direction is up and a large minus tick is an indication that the market is trending down.
Since the tick is computed continuously, it is very dynamic, giving an up-to-the minute reading of the market mood. While the market averages may be up, the tick can turn negative, indicating that the trading trend has reversed. The closing tick is frozen in time at the end of the trading day, but provides some insight into the ending market sentiment. The closing tick on December 6 was +687, which was above the closing tick of +453 from the prior trading day.
The tick of the stocks that make up the Dow Jones industrial average is referred to as the ticki and provides a quick indication of the direction of the Dow Jones industrial average. The ticki adds up the plus and minus ticks for the Dow industrial stocks, so it ranges from –30 to +30.
Traders Index (TRIN)
Some of the trading statistics discussed here have been combined to construct a single number that captures fast-changing market trading information. The traders index, which is also called TRIN as well as the Arms index, is the most-quoted of these combinations. The TRIN measures the distribution of the up and down volume to the number of advancing and declining issues. It is computed by dividing the ratio of advances to declines by the ratio of advancing volume to declining volume:
[Advancing Issues ÷ Declining Issues]
[Advancing Volume ÷ Declining Volume]
The TRIN is computed continuously throughout the trading day and has the advantage of weighting the number of issues moving up or down with the volume behind the movement. The TRIN is easy to interpret—values near 1.0 are neutral, readings significantly below 1.0 are bullish, while readings much above 1.0 are bearish. Since volume is virtually boundless but the number of advancing or declining issues is limited by the number of total issues, a large ratio of advancing to declining volume will offset the advance/decline ratio, and the TRIN will fall below 1.0, marking a short-term bullish condition in the market. The closing TRIN of 1.04 [(1,974 ÷ 1,251) ÷ (733,094,000 ÷ 483,192,000)] was neutral, driven by a relatively equal number of advancing and declining issues as well as similar advancing and declining volume. As of December 6, 2002, the year-to-date range of the TRIN for the NYSE was 0.29 to 3.31.
Block Trades
Large block trades help provide an indication of the participation of large institutions in the market. These are single trades of a stock consisting of at least 10,000 shares.
As Figure 1 shows, the Wall Street Journal provides a total count of the number of block trades that occurred on a given day for each exchange. Perhaps of greater interest is the block transaction summary in the Stock Market Laboratory of Barron’s, which provides a daily breakdown by exchange of the number of block trades that occurred on up ticks, down ticks, and without change. Investors look to this information for an indication of whether the buyer or the seller was more eager to complete the trade. An increasing number of block trades with up ticks serves as an indication of increasing interest in the market by the institutional marketplace and tends to track a rising market.
Summary
There is more to gauging the movement and strength of the market than just following the movement of the major market indexes. Short-term trading indicators provide a quick snapshot of the market conditions at any point in time during market trading hours and at the close.



No comments have been added yet. Add your thoughts to the discussion!
You need to log in as a registered AAII user before commenting.
Log InCreate an account