



The market continues strong, with all the indexes (except the NASDAQ Composite) reaching new highs.
The Model Fund Portfolio lags the S&P 500 index on a year-to-date basis. It is up 10.0% versus 10.6% for Vanguard 500 Index fund  (VFINX).
The portfolio continues to outperform over the long term, and on June 30 it will see its 10th birthday. The Model Fund Portfolio performance history can be seen in Figure 1 and Table 3.
Portfolio Change
Table 1 shows the current holdings for the Model Fund Portfolio. We are replacing CGM Realty fund (CGMRX) with Vanguard REIT Index fund (VNQ), an exchange-traded fund (ETF), as shown in Table 2.
For years, CGM Realty fund outperformed the general real estate investment trust (REIT) market. As it has grown, it has become close to an index fund, but still charges fees similar to an actively managed fund. Its expense ratio is 0.88% versus 0.10% for Vanguard REIT Index fund, and its return is not making up the difference. Vanguard REIT Index fund also has the tradability and tax control advantages of an ETF.
If you are investing in the portfolio and are near a long-term capital gains date, you can defer the change, as there is not likely to be a significant difference over the short term.
Adding Risk Control
Members have asked if I felt the portfolio is diversified enough to make up the entire holdings for an investor, and I have said yes. For the individual investor who does not want to be involved in individual stock holdings, I feel the portfolio would be suitable as a complete portfolio, but only as their complete stock portfolio.
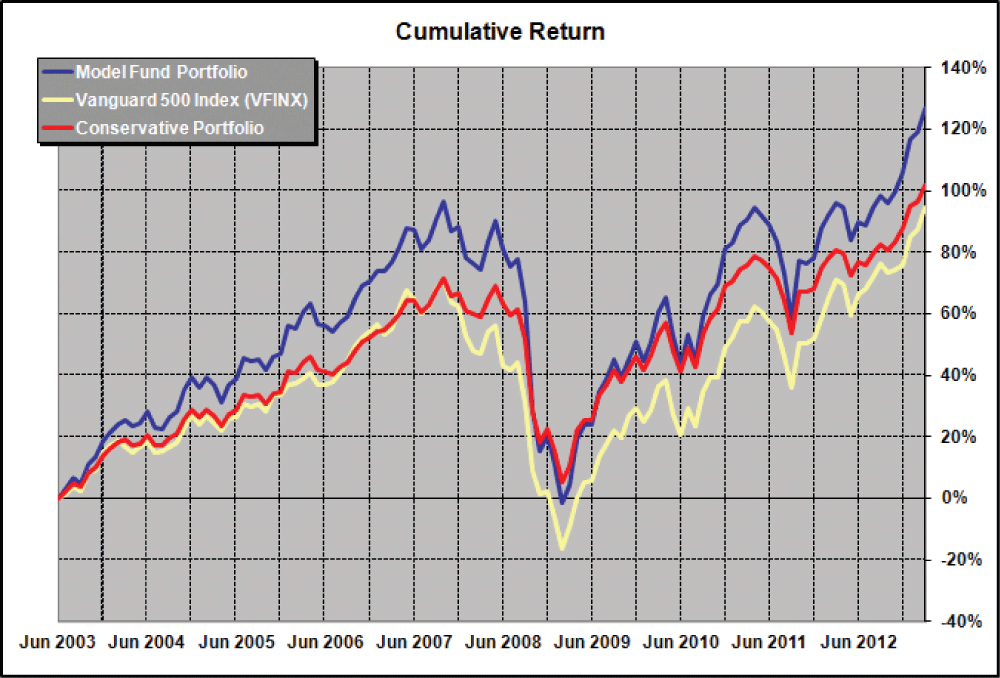
I believe that individuals should maintain a risk-free or very low risk portion of their portfolio. I tend to have an aggressive attitude toward investing, which I will expand on later. But we have always included the Barclays 1-3 Year Treasury fund (SHY) as an optional investment for controlling portfolio risk. We will now track a Conservative Portfolio that includes this bond ETF for illustration purposes and also as an approach to creating a complete portfolio that is less volatile than the all-stock fund portfolio. You will see this portfolio added to Figure 1 and Table 1.
| Std | Worst | ||||||||||
| Dev | 3-Yr | ||||||||||
| Market | YTD | Annual Return (%) | Fund | Exp | (36 Mo. | Cal | |||||
| Cap | Return | 1- | 3- | 5- | Since | Assets | Ratio | Ann’l) | Period | ||
| Type | Fund (Ticker) | Size | (%) | Yr | Yr | Yr | 6/30/2003 | ($ Mil) | (%) | (%) | (%) |
| MF | Aston/Fairpointe Mid Cap N (CHTTX) | Large-Cap | 14.9 | 18.3 | 12.4 | 9.9 | 11.2 | 1,858.7 | 1.11 | 20.7 | -7.9 |
| MF |
Fidelity Capital & Income (FAGIX) |
na* | 3.7 | 12.0 | 9.7 | 11.2 | 9.7 | 9,986.8 | 0.77 | 9.4 | -7.2 |
| MF | FMI Common Stock (FMIMX)** | Mid-Cap | 10.2 | 10.3 | 12.5 | 11.2 | 11.2 | 1,187.5 | 1.20 | 15.1 | -3.0 |
| ETF | Guggenheim S&P 500 Equal Weight (RSP) | Large-Cap | 12.4 | 17.0 | 13.7 | 8.5 | 9.5 | 4,305.5 | 0.40 | 16.7 | -11.4 |
| ETF | Guggenheim S&P MidCap 400 Pure Val (RFV) | Mid-Cap | 15.5 | 20.3 | 11.9 | 9.1 | na | 57.7 | 0.40 | 19.8 | -4.3 |
| ETF | Guggenheim S&P SmallCap 600 Pure Val (RZV) | Small-Cap | 10.2 | 17.3 | 9.8 | 9.2 | na | 83.3 | 0.38 | 23.9 | -7.9 |
| ETF |
Vanguard REIT Index (VNQ)*** |
Large-Cap | 8.1 | 14.9 | 17.2 | 7.3 | na | 18,245.2 | 0.10 | 16.8 | -11.9 |
| ETF | WisdomTree Emerg Mkts SmallCap Div (DGS) | Small-Cap | 5.4 | 10.6 | 8.3 | 7.0 | na | 1,474.1 | 0.64 | 19.8 | 7.8 |
| MF | Yacktman Focused (YAFFX) | Giant-Cap | 12.1 | 16.1 | 12.4 | 14.4 | 11.1 | 7,183.7 | 1.25 | 11.4 | -2.8 |
| Average of Funds in Actual Model Fund Portfolio† | 10.3 | 15.2 | 12.0 | 9.8 | 10.6 | 4,931.4 | 0.69 | 17.0 | -5.4 | ||
| Actual Fund Portfolio Performance†† | 10.0 | 15.5 | 12.2 | 5.4 | 8.8 | 15.7 | -6.4 | ||||
| Optional Investment: | |||||||||||
| ETF |
iShares Barclays 1-3 Year Treasury (SHY) |
0.1 | 0.5 | 1.1 | 1.6 | 3.6 | 7,481.0 | 0.15 | 0.6 | 1.3 | |
| Conservative Portfolio (75% Fund Portfolio/25% SHY) | 7.5 | 11.7 | 9.6 | 4.9 | 7.5 | 11.8 | -2.6 | ||||
| Comparison: | |||||||||||
| MF |
Vanguard 500 Index (VFINX) |
Giant-Cap | 10.6 | 13.8 | 12.5 | 5.7 | 7.1 | 26,947.4 | 0.17 | 14.8 | -8.4 |
| *Distressed securities - stock and bond. | |||||||||||
| **Closed to new investors. If you are not a current shareholder, simply use the other eight funds to form your portfolio. | |||||||||||
| ***New to the portfolio. Added 4/1/2013. | |||||||||||
| †A simple average of the funds in the current Model Fund Portfolio. | |||||||||||
| ††Performance of actual portfolio since inception (June 2003) including reinvested dividends. | |||||||||||
| Source: Morningstar, Inc. Data as of 3/31/2013. | |||||||||||
The Conservative Portfolio is weighted 75% with the Model Fund Portfolio and 25% with Barclays 1-3 Year Treasury fund. There are many who would say that is not very conservative, but I feel it is conservative enough for all except very nervous investors or those well into retirement. That brings me to two opinions I have about risk.
First, I believe in a barbell approach, where risk control is best accomplished with a combination of aggressive and very, very safe investments. I would never buy bonds other than short-term bonds, and I prefer Treasuries because they are even safer. Longer-term bonds behave like stocks in some recessions (2007–2008) and opposite of stocks in others (1930s). So they may or may not provide protection. Only T-bills or short-term Treasuries will hedge equities effectively, and this extreme safety allows a more aggressive approach on the equity side.
The second opinion has to do with my belief that the best defense is a good offense. Many advisers feel the opposite way, and it has to do with risk perception. I pointed this out in my Model Portfolios column in the April AAII Journal (available at AAII.com). Looking at Figure 1 here, you can see that the Model Fund Portfolio is more volatile than the Vanguard 500 Index fund, but it recovered just as fast from the last market downturn. And because of the higher return, the Model Fund Portfolio has a higher terminal wealth. As long as an investor does not risk losing everything and does not panic and sell at bottoms, then over the long term higher returns will provide the best protection for one’s wealth. Figure 1 also shows what I mean by a good offense being the best defense. The Conservative Portfolio did not fall as much percentage-wise in the collapse, but because of lower previous returns, the investor is less well off. Of course, it would be a different picture if the investment began in 2007. So aggressiveness is only for long-term investors.
| Fund | Reason |
| Buy | |
|
Vanguard REIT Index (VNQ) |
|
| Sell | |
| CGM Realty (CGMRX) | expense ratio too high for a fund of its size |
It is important, however, to have enough in a safe investment so that you can meet emergency needs without selling equities at a market bottom. A risk-free allocation also helps offset the panic that can set in when a period like 2007–2008 occurs.
We can examine the Conservative Portfolio over time and see how much it reduces volatility and at what cost to the portfolio’s return.
Outlook
So far the market has maintained its recovery. Every little stutter seems to be taken as an opportunity to get in, and there is considerable money on the sidelines.
It would be highly unusual if there was not a pullback along the way. The market does not seem to be overpriced, although many pundits are making a bearish case. They are basing their opinion on various interpretations of fundamentals as well as external factors such as ongoing debt problems in Europe, saber-rattling in North Korea and the lack of anything positive coming out of Washington.
| Average Annual | Cumulative Return | |||||
| Return (%) | of $10,000 ($) | |||||
| Model | Conser- | Vanguard | Model | Conser- | Vanguard | |
| Fund | vative | 500 Index | Fund | vative | 500 Index | |
| Portfolio | Portfolio* |
(VFINX) |
Portfolio | Portfolio* |
(VFINX) |
|
| 2003** | 18.6 | 13.9 | 15.0 | 11,858 | 11,388 | 11,503 |
| 2004 | 17.7 | 13.3 | 10.8 | 13,955 | 12,905 | 12,742 |
| 2005 | 5.4 | 4.5 | 4.8 | 14,711 | 13,486 | 13,350 |
| 2006 | 16.1 | 13.0 | 15.6 | 17,086 | 15,243 | 15,436 |
| 2007 | 10.2 | 9.5 | 5.4 | 18,820 | 16,696 | 16,267 |
| 2008 | -35.9 | -26.4 | -37.0 | 12,071 | 12,281 | 10,245 |
| 2009 | 24.9 | 19.0 | 26.5 | 15,080 | 14,609 | 12,959 |
| 2010 | 20.3 | 16.0 | 14.9 | 18,136 | 16,941 | 14,892 |
| 2011 | -1.7 | -0.7 | 2.0 | 17,827 | 16,825 | 15,186 |
| 2012 | 15.5 | 11.6 | 15.8 | 20,597 | 18,783 | 17,589 |
| 2013 YTD | 10.0 | 7.5 | 10.6 | 22,663 | 20,191 | 19,449 |
| Since Incep*** | 8.8 | 7.5 | 7.1 | 22,663 | 20,191 | 19,449 |
|
*Seventy-five percent Model Fund Portfolio and 25% Barclays 1-3 Year Treasury fund (SHY). |
||||||
| **June 30 to December 31, 2003. | ||||||
| ***Portfolio was started on June 30, 2003. | ||||||
| Source: Morningstar, Inc. Data as of 3/31/2013. | ||||||
The “Sell in May and go away” crowd should be speaking up now, and I have heard “April is the new May” as well. As usual, we will take the wait-and-see approach.
The next Model Fund Portfolio column will be in the August AAII Journal. Check www.aaii.com/model-portfolios/fund for updates.
Model Fund Portfolio: Selection Rationale
First Methodology
The fund selection rationale consists of two distinct approaches. The first approach is to select actively managed funds where the managers have shown a long-term ability to outperform the market after allowing for additional portfolio risk, regardless of the sector invested in. A fund must have the following characteristics to be considered for the Model Fund Portfolio:
- It must be a pure no-load fund. Short-term holding penalties are allowed if paid to the fund and not the manager.
- It must have been active for 10 years. However, exceptions are possible.
- It must have outperformed the S&P 500 index over the past five-year and 10-year periods.
- In its worst three-year (calendar) period, it must not have had a loss; or, in particularly difficult market periods, its loss must have been substantially less than that of the S&P 500 index.
- Its expense ratio must not be above 1.25%. Lower ratios will increase desirability.
- Fund assets must not be over $10 billion. Some exceptions are permitted, depending on fund objectives.
- It must currently be open to individual investors, with a minimum investment of $25,000 or less.
The above rules apply to new fund selections. Funds will not automatically be eliminated if they later violate the rules without considering other factors.
Second Methodology
The second methodology selects investment approaches that have provided excess returns or reduced portfolio risk to investors over the long term and then searches for the best traditional fund or exchange-traded fund (ETF) in that area. Factors to be considered are:
- The liquidity of the fund.
- The resources of the management company, in the case of ETFs.
- The investment returns and risk over as long a term as possible, given the newness of so many ETFs.
-
Selection of areas with demonstrated long-term excess returns: value stocks, small-cap stocks, real estate and special areas where individuals cannot easily invest. An example of a fund in a special area would be Fidelity Capital & Income fund (FAGIX), which invests in distressed securities.
Portfolio Management Notes
- The Model Fund Portfolio is meant to be a portfolio, and we suggest you invest in the entire portfolio on an equal investment basis—that is, invest equal dollar amounts in each fund initially.
- If a fund is closed, create your portfolio from the remaining funds.
- You may make adjustments based on your non-fund holdings. For example, if you have partnership or individual holdings in investment real estate (not personal housing), you may reduce or eliminate any REIT funds.
- There is no need to rebalance on a regular basis. Rebalancing can be accomplished when there are portfolio changes or if one holding gets way out of line. We will notify you of any rebalancing in the Model Fund Portfolio.
Discussion
FREE REPORT

Gary from CA posted over 13 years ago:
Jerry from Tennessee posted over 13 years ago:
Peter from FL posted over 13 years ago:
You need to log in as a registered AAII user before commenting.
Log InCreate an account