


Due to an error in calculating the mid-month performance data for December 2005, the year-to-date performance data in the January 2006 AAII Journal article “From Peak to Valley: The Stock Strategy Landscape in 2005” was incorrect. As a result, there was a slight mis-ordering of some of the top-performing screening methodologies for 2005, as well as for long-term performance. In addition to correcting the error, we’ve also updated the results through year-end 2005.
The Murphy Technology low-price-to-growth-flow approach maintained its overall dominance for the year, albeit with a lower return of 34.1%.
The Graham—Defensive Investor (Non-Utility) screen, with a revised 2005 return of 26.2%, also remained the top value strategy for 2005, as well as one of the top-performing strategies for the year.
Perennial favorites found themselves once again at the top of the remaining two categories. The Zweig screen led the growth & value category, ending 2005 with a gain of 27.8%, while the original CAN SLIM approach led the growth category, with a 24.1% gain for the year. Surprisingly, however, CAN SLIM failed to rank among the top five performers for all approaches for 2005, even though it led the growth strategy pack.
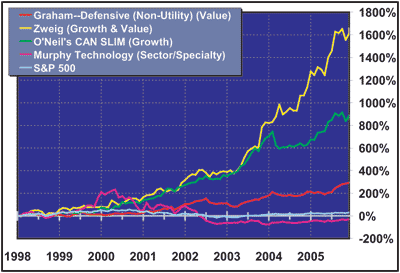
Figure 1 below shows the long-term performance of the top-performing screens for 2005 for each of the strategy categories.
In terms of long-term performance, the overall best and worst remained unchanged, albeit with slightly different results. The Zweig screen maintained its long-term dominance, with an impressive 1,659.3% cumulative return since 1998. And despite its 2005 boost, the Murphy Technology low-price-to-growth-flow approach remained at the bottom of the long-term performance barrel (excluding short selling strategies), with a –29.0% cumulative return.
However, the Neff approach bumped Stock Market Winners from the number five slot on the list of overall top performers, with a cumulative return of 763.7%. On the flip side, the Dogs of the Dow—Low Priced 5 screen was spared from the list of the five worst long-term performers (since the start of 1998), replaced by the Insider Net Purchases screen methodology, with a cumulative return of only 36.1%.
Table 1 below presents the updated performance of the stock screens tracked on AAII.com, through year-end 2005. For a revised version of the full article, please refer to the January 2006 issue of the AAII Journal, or click here.
Figure 1. Performance of 2005 Winning Screens by Category

Discussion
FREE REPORT

No comments have been added yet. Add your thoughts to the discussion!
You need to log in as a registered AAII user before commenting.
Log InCreate an account