




Related

Portfolio Strategies
Large-cap stocks have performed well when inflation has been low, while commodities, real estate and small-cap stocks have led when inflation was high.

Inflation comes and goes.
In recent decades, inflation has been low. But many of us remember the years of high inflation in the 1970s and early 1980s. At some point inflation will return and, if the last four and a half decades are any guide, when it ticks back up, we will likely see a distinct change in the performance of several asset classes.
Over the past 46 years (from 1970 through 2015), the average rate of annual inflation (as an arithmetic mean) has been 4.12%, whereas the 46-year median change in the consumer price index (CPI) has been 3.29%. The average annualized growth rate of inflation has been 4.07%.
In this article, we focus on the median rate of inflation of 3.29% because it is less affected by the outlier high rates of inflation during the late 1970s. Plus, using the median rate of inflation allows us to divide the last 46 years exactly in half: 23 years with below median inflation and 23 years with above median inflation. This will facilitate the analysis of asset class performance during years of low inflation (those 23 years with below-median inflation) and during years of higher inflation (23 years with above-median inflation). The median rate of inflation during the “low” years was 2.38%; during the “high” years, inflation rose at a 4.65% rate as shown in Table 1.
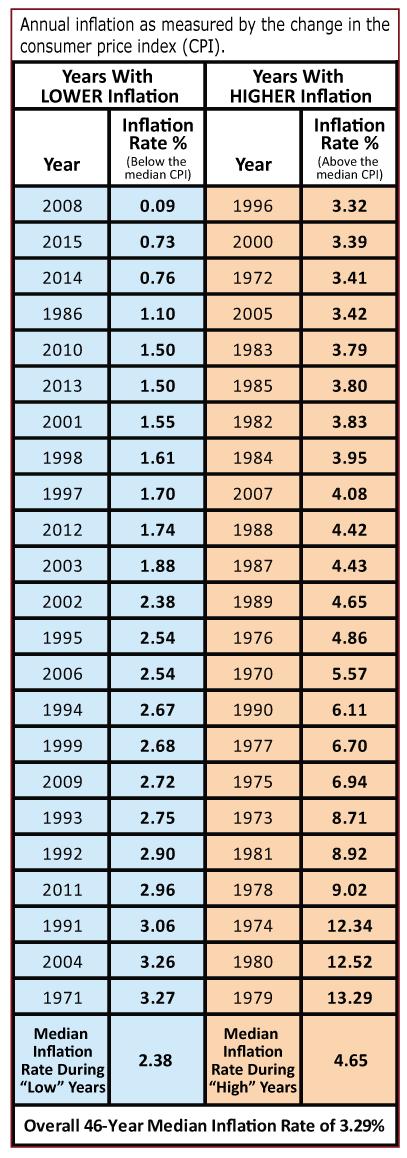
The last time we experienced a year with inflation above the median rate of 3.29% was 2007, when the CPI increased by 4.08%. Since then (from 2008–2015) we have experienced very modest levels of inflation. In fact, since 1990, there have only been four years where the annual rate of inflation was over 3.29%. We have been in a low-inflation environment for more than two and a half decades.
We will now review inflation and asset performance over the 46-year period from 1970 through 2015. The performance of seven major asset classes—large-cap U.S. stocks, small-cap U.S. stocks, non-U.S. stock, U.S. bonds, U.S. cash, real estate and commodities—will be reviewed during the 23 years of low inflation as well as the 23 years of higher inflation.
The 46-year historical performance of large-cap U.S. equities is represented by the S&P 500 index, while the performance of small-cap U.S. equities is captured by using the Ibbotson Small Companies index from 1970–1978 and the Russell 2000 index from 1979–2015. The performance of non-U.S. equities is represented by the Morgan Stanley Capital International EAFE (Europe, Australasia, Far East) index. U.S. bonds are represented by the Ibbotson Intermediate Term Bond index from 1970–1975 and the Barclays Capital Aggregate Bond index from 1976–2015. Cash is represented by three-month Treasury bills. The performance of real estate is measured by using the annual returns of the NAREIT (National Association of Real Estate Investment Trusts) index from 1970–1977 and the annual returns of the Dow Jones U.S. Select REIT index from 1978–2015. Finally, the historical performance of commodities is measured by the Goldman Sachs Commodities index (GSCI). As of February 6, 2007, the GSCI became known as the S&P GSCI.
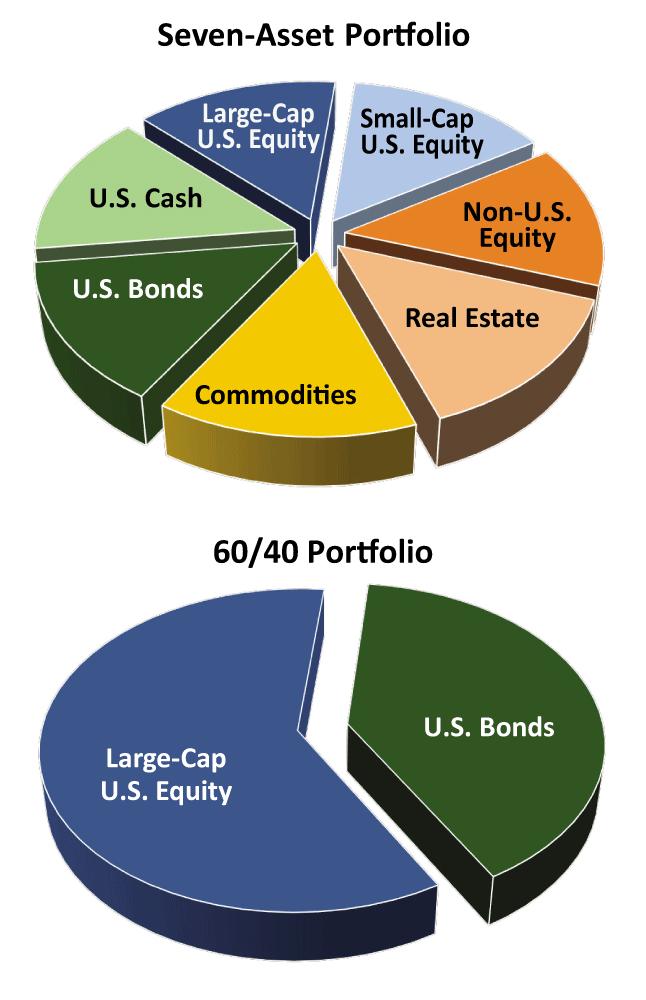
In addition to the seven individual asset classes, we also review the performance of two portfolios (Figure 1). The first portfolio is made up of all seven asset classes in equal allocations of 14.28% and was rebalanced annually. The second portfolio consists of 60% large-cap U.S. stocks and 40% U.S. bonds—the classic 60/40 portfolio. This portfolio was also rebalanced annually.
As shown in Table 2, large-cap U.S. stocks had an average nominal return (nominal returns ignore the impact of inflation) of 12.8% during the 23 years in which inflation was low. By comparison, they had an average real return (real return takes into account inflation) of 10.5% during those same 23 years with low inflation.
Now, let’s turn the tables and look at performance during the 23 years in which there was higher inflation (annual inflation rates above the median rate of 3.29%). We observe that large-cap U.S. stocks had an average nominal return of 10.7%, but an average real return of just 4.4%. These results clearly do not support the notion that large-cap U.S. stock has been a standout performer during inflationary times.
Here is how an average real return of 4.4% happens. The nominal return of the S&P 500 index in 1996 was 23.0%. That same year the CPI increased by 3.32%. Thus, the real return of the S&P 500 index was 19.1% as calculated by the formula [(1 + 0.23) ÷ (1 + 0.033)] – 1. The figures shown reflect rounding up or down. Doing this calculation for all 23 years yielded an average nominal return of 10.7% and an average real return of 4.4% for large-cap U.S. stocks. More than one-third of the real returns for the S&P 500 were negative during years with higher inflation. The average rate of inflation during this 23-year period was 6.15% (whereas the median was 4.65%).
The performance of small-cap U.S. stocks has been somewhat better than large-cap U.S. stocks during years with low inflation (shown in Table 2). The average nominal return for U.S. small stocks was 13.5%, whereas the average real return was 11.1%. When looking at performance during years with higher inflation, the superiority of small-cap versus large-cap U.S. stocks increases. The average nominal return was 12.4% for small-cap U.S. stocks compared to 10.7% for U.S. large stocks. Even more dramatic is the difference in average real returns during years with higher inflation rates: 6.0% for small-cap U.S. stocks versus 4.4% for large-cap U.S. stocks. If inflation protection is your goal, U.S. small-cap stocks have been a better defender than U.S. large-cap stocks in the past.
The real story here is commodities, as shown in Table 2. Very simply, a broad-based commodity index such as the S&P Goldman Sachs Commodity index (GSCI) suffers when inflation is low. When inflation is high (very likely because energy and commodity prices have gone higher, thus effectively creating inflation), commodity indexes and commodity funds perform well. The average real return for commodities during the 23 low inflation years was a 4.0% loss compared to a 15.0% gain during the 23 years when inflation was higher. The average real (that is, inflation-adjusted) performance of commodities completely dominates any other asset class. The next closest performer is real estate at 6.7% and small-cap U.S. stocks at 6.0%. The performance of non-U.S. stocks has been comparable to large-cap U.S. stocks during inflationary times—both in nominal and real terms. As we have been in a low-inflation environment in recent decades, it is not surprising that commodities have performed relatively poorly. This will change.
Since investors don’t normally build one-asset portfolios, it’s important to consider how multi-asset portfolios perform during periods of low inflation and high inflation. Toward that end, I evaluated two different portfolios: an equal-weighted seven-asset portfolio and a two-asset, 60% stock/40% bond portfolio. The two different models are depicted in Figure 1.
Figure 2 shows that the equal-weighted seven-asset portfolio underperformed the 60% stock/40% “balanced” portfolio during periods of low inflation. The average real return for the seven-asset portfolio was 6.2% during the 23 years with low inflation (blue bars)—nearly all of those years being recent years. The two-asset 60/40 portfolio had an average real return of 8.1%. The two-asset model did not have commodities dragging it down.
Now, let’s turn our attention to the years of higher inflation (orange bars on the chart). The seven-asset portfolio had an average real return of 5.8% compared to 3.8% for the 60/40 portfolio. Commodities, real estate, U.S. small-cap stock and non-U.S. stocks—all missing in the 60/40 portfolio—were helpful contributors in the seven-asset portfolio during inflationary years. Commodities, clearly, were the most helpful.
If you believe that inflation will remain low for a very long period of time, stay with a two-asset, 60/40 portfolio. However, if you believe that inflation will rear its ugly head again, it would be wise to build a portfolio that has demonstrated an ability to defend itself against inflation. This would require a portfolio with a wider variety of asset classes—including real estate, commodities and small-cap U.S. stocks. In short, build a broadly diversified portfolio.
Table 3. Large Stock Nominal and Real Returns
U.S. Large-Cap Stock Real Returns During Years With High Inflation (ranked by inflation rate)
| Years with Higher than Median Inflation |
S&P 500 Index Nominal Returns |
Inflation Rate as Measured by CPI | S&P 500 Index Real Returns (%) |
| 1996 | 23.0 | 3.3 | 19.0 |
| 2000 | -9.1 | 3.4 | -12.1 |
| 1972 | 19.0 | 3.4 | 15.1 |
| 2005 | 4.9 | 3.4 | 1.5 |
| 1983 | 22.6 | 3.8 | 18.1 |
| 1985 | 31.7 | 3.8 | 26.9 |
| 1982 | 21.6 | 3.8 | 17.1 |
| 1984 | 6.3 | 4.0 | 2.2 |
| 2007 | 5.5 | 4.1 | 1.4 |
| 1988 | 16.6 | 4.4 | 11.7 |
| 1987 | 5.3 | 4.4 | 0.8 |
| 1989 | 31.7 | 4.7 | 25.8 |
| 1976 | 23.9 | 4.9 | 18.2 |
| 1970 | 3.9 | 5.6 | -1.6 |
| 1990 | -3.1 | 6.1 | -8.7 |
| 1977 | -7.2 | 6.7 | -13.0 |
| 1975 | 37.2 | 6.9 | 28.3 |
| 1973 | -14.7 | 8.7 | -21.5 |
| 1981 | -4.9 | 8.9 | -12.7 |
| 1978 | 6.6 | 9.0 | -2.2 |
| 1974 | -26.5 | 12.3 | -34.5 |
| 1980 | 32.5 | 12.5 | 17.8 |
| 1979 | 18.6 | 13.3 | 4.7 |
| Average Performance During High Inflation Years | 10.7% | 6.2% | 4.4% |
Portfolio Strategies

Portfolio Strategies

Portfolio Strategies

Craig & Nancy Bell from CA posted over 9 years ago:
Bernard Biltek from FL posted over 9 years ago:
Dave Gilmer from WA posted over 9 years ago:
Bedford Joyner from TN posted over 8 years ago:
Bedford Joyner from TN posted over 8 years ago:
You need to log in as a registered AAII user before commenting.
Log InCreate an account