


AAII’s Silicon Valley Chapter CI subgroup has been discussing earnings and earnings announcements investment algorithms for the last several months. As part of the discussions, we reviewed AAII’s Estimate Revisions: Top 30 Up, or Top 30 Up screen for short, a long-lived, high-performing screen using AAII’s Stock Investor Pro (SI Pro) fundamental stock screening and research database. This article summarizes our review and discussion.
As with any screen, there are always questions as to how and why the screen works and how variations to it will impact performance. These questions include:
- What if I run/implement the screen starting on a different date?
- What happens if I invest in more, or fewer, stocks than the base screen?
- What happens if I trade more or less frequently—e.g., weekly or quarterly?
- Which screening terms are most critical to its performance?
- Which market-capitalization segment—small, medium or large—works best?
- What are the costs of trading the screen?
Practically speaking, the easiest way to answer many of these questions is through backtesting. However, there are a few cautionary items on backtesting to keep in mind:
- First, screens and backtests can be over-optimized, leading to unrealistic results. We’ve minimized this issue by simply looking at variations on a pre-existing screen.
- Second, the data sources, screening terms and capabilities provided by different tools vary and will likely produce different results. In this case, the Top 30 Up screen uses AAII’s SI Pro screener with data as of the end of each month. For more information on how the AAII stock screens work, see the FAQ page. Here, we used the Portfolio123 screener and backtester run every four weeks. Consequently, there will be differences in results.
- Finally, there is the question of trading costs, primarily commissions and slippage. These costs are dependent on which brokerage you use, the liquidity of the stocks produced by the screen and other factors. The investor needs to minimize these costs when trading stock screens, especially when trading monthly or more frequently. There are several ways to address this problem: Window trades at Folio Investing, low-cost trading at Interactive Brokers using “Market on Open orders,” and many other choices are available. We return to the issue of these costs later in the article.
The Base Screen and Its Backtest Results
We begin with an attempt to reproduce AAII’s historical results seen by the Estimate Revisions 30 Up screen. Figure 1 shows the settings for the screen at Portfolio123.
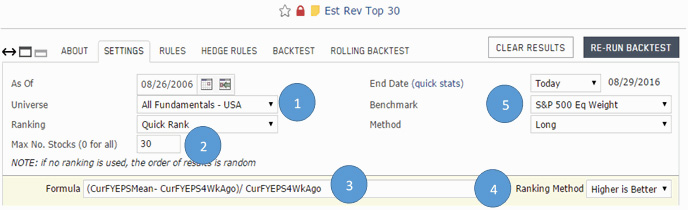
Some brief comments on these settings:
- #1 sets the universe of stocks to be considered by the screen, in this case all stocks that have fundamental data in the Portfolio123 database.
- #2 sets the maximum number of stocks to be chosen by the screen (30).
- #3 sets the screen results sorting formula, in this case: the gain of the current fiscal year earnings per share (EPS) mean estimate versus that of four weeks ago. This is consistent with the AAII screen sort.
- #4 sets the direction of the ranked stocks, in this case stocks with a higher to lower (descending) rank.
- #5 sets the benchmark to the equal-weight S&P 500 index. This was chosen since the S&P 500 is a well-known benchmark and the screen results, when backtested, will be equally weighted. Note that, relative to the market-cap-weight S&P 500, this benchmark introduces a small-capitalization bias.
Figure 2 shows the screen rules, or terms, at Portfolio123.
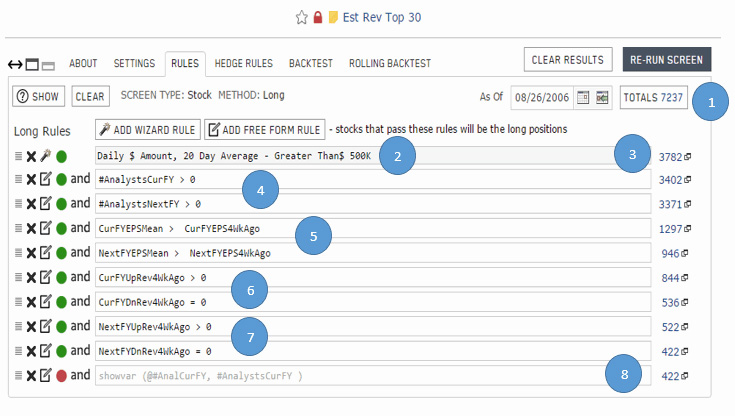
A quick tour of these settings and results:
- #1 shows that as of 8/26/06, there were a total of 7,237 stocks in this universe at Portfolio123.
- #2 enforces a liquidity check, specifically that a stock has traded at least $500,000 per day over the last month. This term is added to all screens to ensure that the stocks are purchasable at a reasonable cost and in reasonable volume. Note that the AAII “Top 30 Up” screen does not have a specific liquidity check.
- #3 shows that the liquidity check reduces the number of stocks that pass the screen from 7,237 to 3,782. In general, this column shows the number of stocks passing the screen terms at each point in the screen.
- #4 requires that there be at least one analyst providing estimates for the stock for both the current and next fiscal years. This differs from the AAII screen where AAII requires four or more analysts, but only for the current fiscal year. Note that this requirement in the AAII screen drives the results toward larger-capitalization stocks.
- #5 requires for both the current and next fiscal years that the current mean earnings estimate is greater than that of four weeks ago. This is consistent with the AAII screen.
- #6 requires that there has been at least one upward revision and no downward revisions to the current fiscal year estimate during the last four weeks. This is consistent with the AAII screen.
- #7 requires that there has been at least one upward revision and no downward revisions to the next fiscal year estimate during the last four weeks. This is consistent with the AAII screen.
- #8 shows that the screen produces 422 stocks on August 26, 2006.
Let us return to point #2, the “liquidity check,” for a moment. One rule of thumb is that purchases should be limited to no more than 1% of daily trading volume so as to not cause undue pricing pressure on the stocks being purchased. In this case, this states that not more than $5,000 of any stock should be purchased, resulting in a portfolio size limited to $150,000 (30 stocks x $5,000 per stock). This size portfolio is adequate to meet many individual investors’ needs.
Now let us return to the question of trading costs. Without proof (it would take a separate article to get into all the details!), an investor would be fortunate to incur a cost of only 25 basis points (0.25%) for a round trip (sell-and-buy) transaction at this level of liquidity. Fifty basis points (0.5%) could very well be more reasonable. For this screen, traded monthly, trading costs could result in a 3% to 7% reduction in the compound annual growth rate (CAGR), certainly a significant amount.
Now we can get to the “good part”: the backtest and its results, as shown in Figure 3.
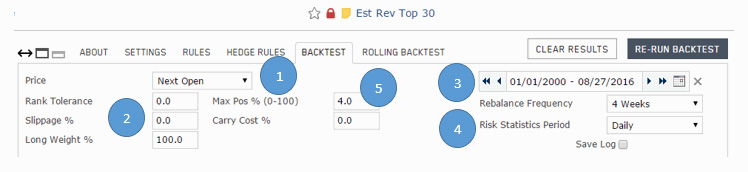
A quick summary of these settings:
- #1 has the backtester perform trades at the next day’s open price. Since the backtests here are done based on week-ending dates, this usually means Monday’s opening price.
- #2 sets the slippage cost to zero. This means that no bid-ask spread, slippage or other trading costs will be included in the return calculations. (Trading costs can be modeled with this parameter.)
- #3 shows the backtest period, from Jan 1, 2000, to August 27, 2016.
- #4 shows that the screen is applied every four weeks and that modern portfolio theory (MPT) statistics such as alpha and beta are calculated on a daily period.
- #5 sets the maximum weight any one stock can hold in the portfolio, in this case 4% for a 30-stock portfolio.
And finally we get to the backtest performance statistics as shown in Figure 4 and Figure 5, respectively.
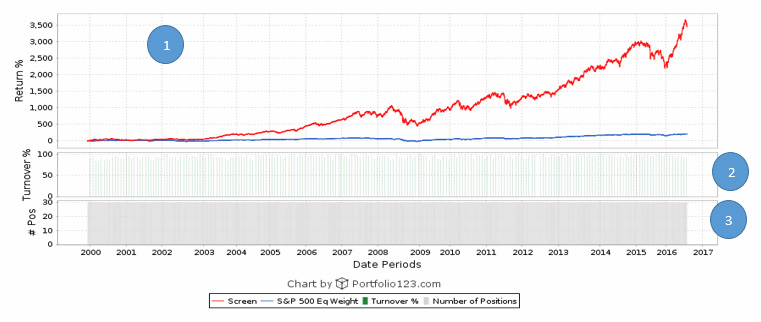
Figure 4 is a chart with three panels:
- Panel 1 is the equity curve, or EC, of the screen and its benchmark. Unfortunately, a linear scale, as opposed to a semi-log scale, is used, which visually distorts the comparison of the two curves.
- Panel 2 shows the turnover rate of the screen at each rotation period. The turnover rate is the percentage of the stocks that are new to the portfolio at each trading period. As can be seen, it is very high: Portfolio123 reports a 95% average turnover rate every four weeks.
- Panel 3 shows that 30 stocks are found in each rotation period.

A few key points to note from Figure 5:
-
The CAGR (average annual return) of 23.9% is quite close to the AAII screen’s lifetime gain of 24.2%, especially when considering the differences in time frame, databases, etc. A separate backtest (not shown) was performed for the last 10 years and its CAGR at 20.1% was again reasonably close to the AAII’s screen CAGR of 20.8%.
- Returning once more to the trading cost issue: Given trading costs of 3% to 7% per year, a good estimate for what the screen might achieve in reality is a CAGR of 17% to 21%.
- The maximum drawdown (MDD) at 53.2% is less than the equal-weight S&P 500 at 60.8%. This MDD occurred during the 2008-2009 bear market. For reference, the S&P 500 market-cap benchmark saw a 55% MDD during this period.
- The screen has a beta of only 0.71 and produces a substantial alpha of approximately 20%. [Note: Beta is a measure of the volatility, or systematic risk, of a portfolio in comparison to the market/index as a whole. The market’s beta is always 1.0; the higher the beta of the portfolio, the greater the risk. Alpha measures the excess performance of a portfolio against the market index. A large alpha indicates that the portfolio has performed better than would be predicted given its beta (market volatility).]
- Also note that the R-squared statistic states that market performance only explains 33% percent of the screen’s performance. R-squared measures how much the market movement influences the portfolio movement using a simple linear regression model.
Screen Variations and Their Backtest Results
Now we begin to examine variations to the basic Top 30 Up screen to provide answers to, or at least insights into, the questions we posed earlier. The process used in all cases takes the basic Top 30 Up screen/backtest, makes a limited set of changes to the screen/backtest parameters, and then re-runs the backtest and analyzes the results.
Variation 1
The first case varies the starting date of the backtest (Figure 3, #3) to see how sensitive the results are to specific starting dates. In this case, we simply began the backtest on every week during the first four weeks of January 2000 with the results shown in Figure 6.
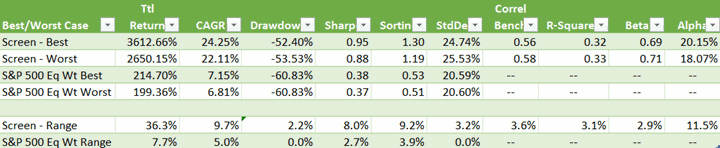
As shown, while there are variations in the performance, all starting dates produce high CAGRs, Sharpe ratios, and alphas. [Note: The Sharpe ratio is a measure for calculating risk-adjusted returns of a portfolio. Specifically, the Sharpe ratio is the average return earned in excess of the risk-free rate per unit of volatility or total risk. The higher the value, the more excess return investors can expect to receive for the extra volatility they are exposed to.] One can conclude this screen is relatively robust to starting dates.
Variation 2
The second case varies how frequently we run the backtest (Figure 3, #4) and rotate stocks; that is, sell old stocks and buy new ones. Here we run the screen for the different rotation periods with the results shown in Figure 7.

There are a few items to note from the results.
First, the CAGRs drop off reasonably quickly as the rotation period lengthens. This may be due to the market slowly absorbing the information that analysts expect better results. However, even after 13 weeks of delay there is still a notable gain and alpha for the screen.
Second, most of the other statistics, other than Sharpe and Sortino which are driven by CAGR, remain reasonably stable. [The Sortino ratio measures the excess return against the risk of not meeting a minimum return. The higher the Sortino ratio, the better the risk-adjusted performance.]
Many investors will review Figure 7 and jump to the conclusion that they should trade weekly and achieve a 37.8% CAGR. Unfortunately, due to trading costs, you will not be able to achieve this result. Figure 8 shows the results when varying levels of trading costs (Figure 3, #2) are included in the backtest.
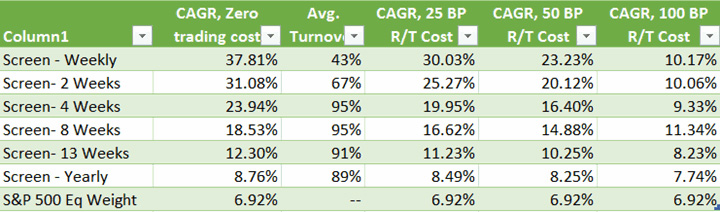
As shown in Figure 8, the 37.8% CAGR hoped for by trading weekly quickly turns into something much lower depending on the trading costs incurred.
Variation 3
The third case varies how many stocks are held in the portfolio each month. One argument is that holding very few stocks will produce higher performance; another argument suggests that holding more stocks will insulate you from a few bad stocks. To investigate this, I ran the backtest holding a different number of stocks (Figure 1, #2) in each backtest, while allowing a single stock to be up to 20% of the portfolio (Figure 3, #5). The results are shown in Figure 9.
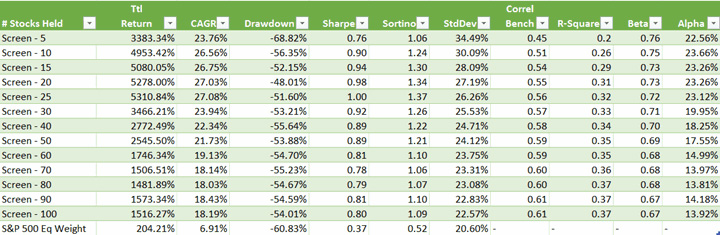
Key items to note from these results:
- Holding only five stocks is competitive but does not produce the best CAGR or alpha. This may be due to a few bad stocks causing undue harm to the results. Portfolios of 10 to 25 stocks produce the best CAGRs and alphas. There is a significant CAGR and alpha drop at a 30-stock portfolio and then a decline from there as you add more stocks. It is notable that even a 100-stock portfolio still displays significant CAGR and alpha. This probably reflects the robustness of the screen and the wide universe the screen has to draw from. Note that the Sharpe and Sortino results follow the CAGR results, which are their main driver.
- The maximum drawdown, with the exception of the small five-stock portfolio, remains stable at between 50% to 60% for most portfolio sizes.
- As expected, portfolios that hold a larger number of stocks are less volatile, as measured by standard deviation.
- As the portfolio increases in size, the correlation to the benchmark rises, but the beta drops.
A final note: There are months when the screen does not produce the full complement of stocks required. For example, in late 2008 only 40 stocks pass the screen. In this case, the backtest places all funds in these 40 stocks.
Variation 4
The fourth case restricts the universe the screen picks stocks from to various well-known indexes. These backtests were implemented by changing the universe setting (Figure 1, #1) and the maximum weight each stock can hold (Figure 3, #5) appropriately. Since some of these universes are quite small, such as the Nasdaq 100, runs holding a reduced number of stocks were also performed. See Figure 10 for the results of these runs.
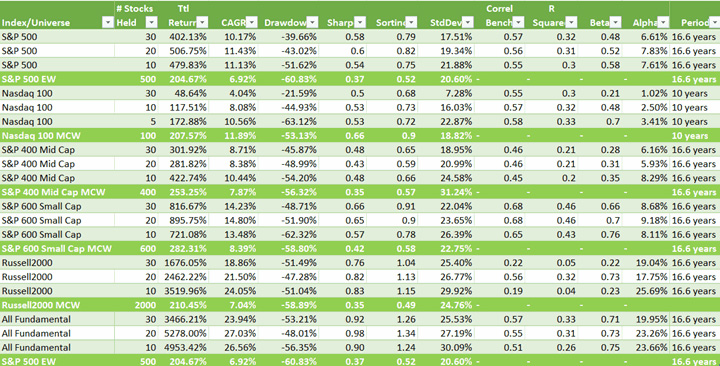
Key items to note from these results:
- The backtests required the full number of stock positions. If in some periods the screen could not produce the required number of stocks, empty positions were filled with cash. In these cases, the screen suffered “starvation” from too few stocks being selected.
- The S&P 500 backtest provides CAGRs in the 10% to 11% range. The S&P 500 produces, on average, only 26.7 stocks each month, leaving 3.3 positions to be held in cash (in order to be comparable with the 30-stock portfolio of the Estimate Revisions Up 30 screen). In worst-case months, the screen produced one stock. However, even with reduced holdings of 10 to 20 stocks, this universe does not appear to be a source of outperformance.
- The Nasdaq 100 backtest is an extreme example of starvation since the universe is so small. In this case the Nasdaq 100 produces, on average, only 7.6 stocks each month, leaving 22.4 positions to be held in cash. In worst-case months, the screen produced zero stocks. Only in the extreme case of holding only five stocks do the results come close to matching the CAGR of the Nasdaq 100 index.
- The S&P MidCap 400 backtest also suffers from starvation, producing only 26.5 stocks on average and leaving 3.5 positions to be filled with cash. In worst-case months, the screen produced four stocks. However, even with reduced holdings of 10 stocks, this universe does not appear to be a source of outperformance.
- With the S&P SmallCap 600 backtest, we begin to see where the outperformance of the screen comes from. This universe is large enough that the screen produces 29.9 stocks on average, and in worst-case periods three stocks. This produces reasonable CAGRs when 20 to 30 stocks are held.
- Similarly, with the Russell 2000 backtest, you see improved performance yet again. This universe is large enough that the screen produces 28 stocks on average, and even in worst-case months, 17 stocks. This universe produces very competitive CAGRs when 10 to 20 stocks are held.
- Finally, you can see when all stocks are allowed to compete in the All Fundamental universe, the best CAGRs are achieved. This universe, the largest available in this study, allows the screen to produce the best stock candidates in all periods.
What do these results tell us about how and where this screen outperforms? It appears that most of the outperformance comes from small-cap stocks, and providing the screen with the largest universe prevents starvation.
Variation 5
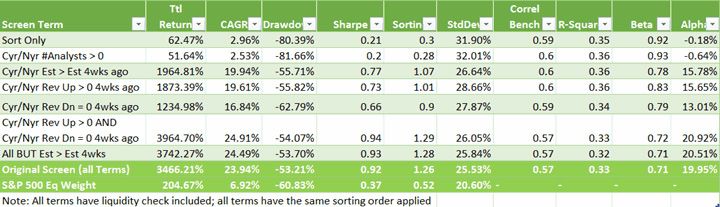
For the final variation, we attempt to determine which screen terms are most important to the screen’s performance. A very simplistic approach is taken for this analysis: We run major screen terms individually or in pairs to see what they contribute to the screen’s performance. Results of selected runs are shown in Figure 11.
Key items to note from these results:
- The first two Figure 11 entries, applying the sort by itself (Figure 1, #3) and ensuring that there is at least one analyst following a stock for both the current and next fiscal years (Figure 2, #4) do not appear to be significant factors by themselves.
-
You have three entries that each contribute significantly to performance.
- The current and next fiscal year estimates are greater than they were four weeks ago (Figure 2, #5), or
- There has been at least one upward estimate revision for both the current and next fiscal years in the last four weeks (Figure 2, #6 & #7), or
- There have been no downward estimate revisions for both the current and next fiscal years in the last four weeks (Figure 2, #6 & #7).
- Perhaps most importantly, knowing that there has been at least one upward estimate revision and no downward estimate revisions in the last four weeks for both the current and next fiscal years (Figure 2, #6 and #7) produces the best performance; even better than the original screen. (Be aware that this result may not prove true over different time periods.)
Conclusions
We started this article by reviewing AAII’s Estimate Revisions: Top 30 Up screen and historical results and posed a set of questions that are commonly asked for many stock screens. Now that we have gone through the details of the various results, what answers and/r insights can we provide for these questions with respect to the Top 30 Up screen?
- On varying the screen starting dates, we found that the performance remains stable regardless of when it is started.
- On varying the rotation periods, we found that running the screen more frequently, specifically weekly, provides the best theoretical results. The issue of trading costs was discussed with insight into what these costs might be as you trade more frequently.
- On varying the number of stocks held, we found that 30 stocks does not appear to be the best size for this screen and that holding 10 to 25 stocks might improve results.
- On applying the screen to various indexes or market-cap segments, we found that this screen appears to get most of its outperformance from small-cap stocks and that preventing screen starvation by using a large universe helps performance.
- On finding the most important screen terms, we found several pairs of terms that add value, and that by ensuring that there has been at least one upward estimate revisions and no downward estimate revisions in the last four weeks for both the current and next fiscal years appears to be a good screen by itself.
This sort of approach can be used for most stock screens to provide insight and answers to many typical questions. Hopefully you can use this information and approach as a guide to understand and improve the performance of your screens.
Discussion
FREE REPORT

Alan George from Australia posted over 9 years ago:
Jerry Goldress from NV posted over 9 years ago:
Barry Pelham from IL posted over 9 years ago:
Sridhar Adibhatla from OH posted over 9 years ago:
Boris Smith from NZ posted over 9 years ago:
John Duguid from MA posted over 9 years ago:
Allen Mast from FL posted over 9 years ago:
Al Zmyslowski from CA posted over 9 years ago:
Bill Lang from CA posted over 9 years ago:
Raymond Rondeau from RI posted over 9 years ago:
Randall Olsen from CA posted over 9 years ago:
Shane Milburn from FL posted over 9 years ago:
You need to log in as a registered AAII user before commenting.
Log InCreate an account