


One of the benefits of quantitative stock screening is that it helps to remove emotion from the equation by defining minimum criteria that a stock must meet in order to pass the screen. If you only invest in stocks that pass a stock screen, you remove the chance of investing in stocks that you may have personal interest in but that do not have the “winning qualities” defined in the screen. In order to invest in a stock methodology with confidence, however, it helps to have an idea of how it has performed over varying market cycles. While past performance is not a guarantee of future performance, backtesting allows us to see how a strategy would have hypothetically performed in the past.
AAII membership gives you access to a collection of more than 50 stock screens, where you can view the hypothetical performance of stock investing strategies starting, in most cases, in 1998. Most of AAII’s stock screens are backtested over a period that begins at the end of 1997, with hypothetical portfolios invested in the stocks that pass a given methodology on an equal dollar basis and rebalanced at the end of each month, with buys and sells assumed to be made at the month-end price. For that reason, as well as the fact that our backtesting results do not take into account transaction costs such as commissions and bid-ask spreads, our reported results are not achievable by individual investors. However, since we follow the same procedure for all screens, the backtesting results provide a basis for comparing how the approaches may perform over time and over varying market conditions.
MAGNET Complex and MAGNET Simple are two investment methodologies tracked in the Stock Screens section of AAII.com. They were developed by Computerized Investing editor Wayne A. Thorp, CFA, and based on the book “Magnet Investing” (Next Decade, Inc., 2000) written by Jordan Kimmel. Kimmel, chief investment officer at Investview Inc., developed the Stock Selection Process, a proprietary stock selection model that was one of the first to blend elements of value, growth and momentum. Thorp’s August 2009 article, “Adapting the Kimmel Approach: AAII’s Simple and Complex MAGNET Screens,” is available here.
In the June issue of the AAII Journal, Kimmel introduced revised versions of the MAGNET screens. In this article, we highlight the differences between the “original” and revised MAGNET screens as well as present the results of our hypothetical backtesting to see whether the changes led to improved performance.
The “Original” MAGNET Approaches
According to Kimmel, a MAGNET stock offers a blend of technical and fundamental characteristics “that pull investors into shares, as though by magnetic attraction, resulting in rapid price increase.” Kimmel believes the MAGNET process “encompasses the best of the momentum aspects of the market, while demanding the downside protection of a value approach, and insisting on top-line revenue growth.”
In “Magnet Investing” Kimmel states, “The strategy underlying the model states that investors consistently underestimate the expected returns of stocks with strong fundamentals, technical patterns, and risk and growth characteristics.”
The MAGNET acronym is as follows:
M—Management must be outstanding; momentum must be improving;
A—Acceleration of earnings, revenues and margins;
G—Growth rate must exceed valuation;
N—New product or management may be the driver;
E—Emerging industry or product creates opportunity; and
T—Timing needs to be right (technically poised for large price increase).
AAII’s MAGNET Complex screen has an average annual gain of 12.2% from January 1998 through June 2015, ranking it 33rd out of the 62 screens that AAII tracked at the end of June 2015. In addition, the Complex screen has a risk index of 2.73, which is third-highest of the screens AAII tracks; it means the approach carries 173% more risk than the S&P 500 index of large-cap companies.
The screen’s middle-of-the-road performance and high risk index translates into an average annual risk-adjusted performance (+8.6%) that ranks in the lower-third of all AAII screens (43rd out of 62). By comparison, the S&P 500 had an average annual price gain of 4.2% over the same period.
The backtested results for the original MAGNET Complex screen provide more information than just historical performance. Since inception, the screen has generated, on average, only two passing companies each month. However, there are also extended periods where no companies pass the screen. In an average month, the screen also sees 74% turnover in its holdings.
Irrespective of backtested results, if an investor is to follow a stock screening approach it must be investable. That is to say, there must be an adequate number of possible candidates to build a diversified portfolio. With so few companies passing the MAGNET Complex screen, it makes it difficult to do so. Furthermore, although our backtesting results do not take into account “real-world” factors such as commissions, an approach with such high turnover would also incur trading fees that would eat into performance even more.
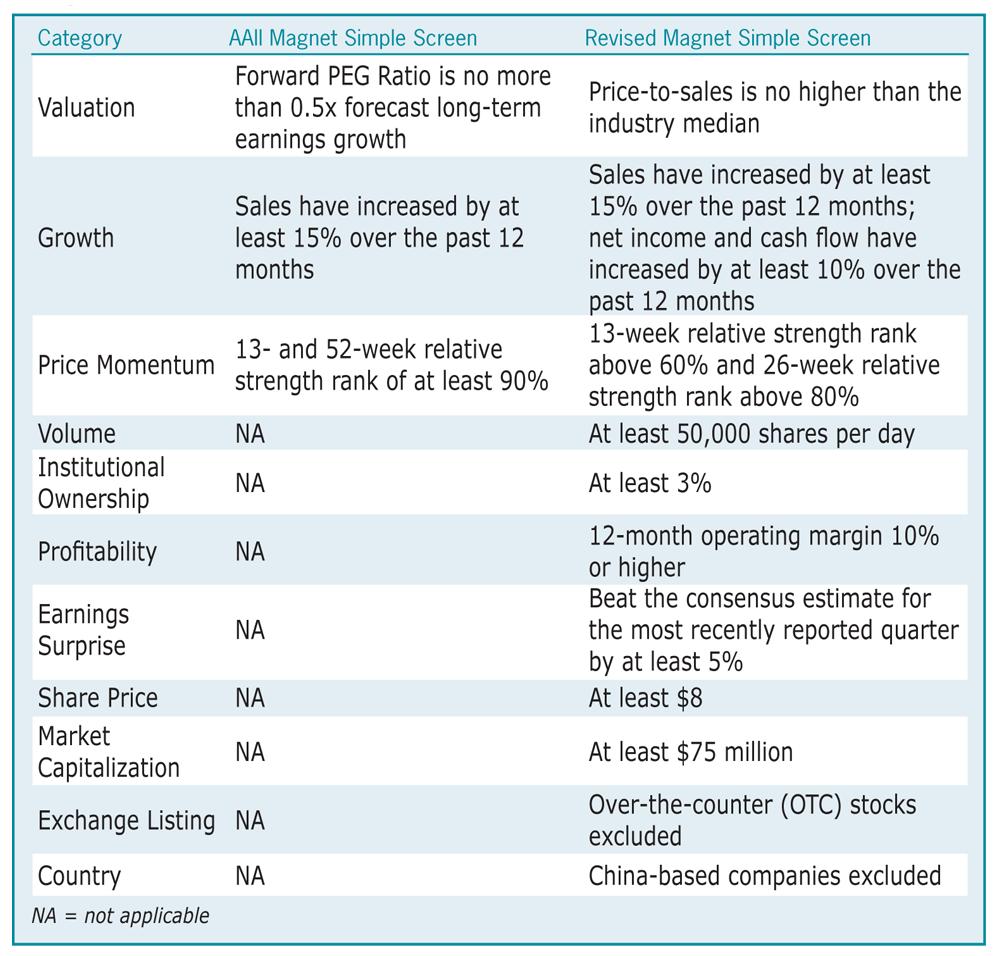
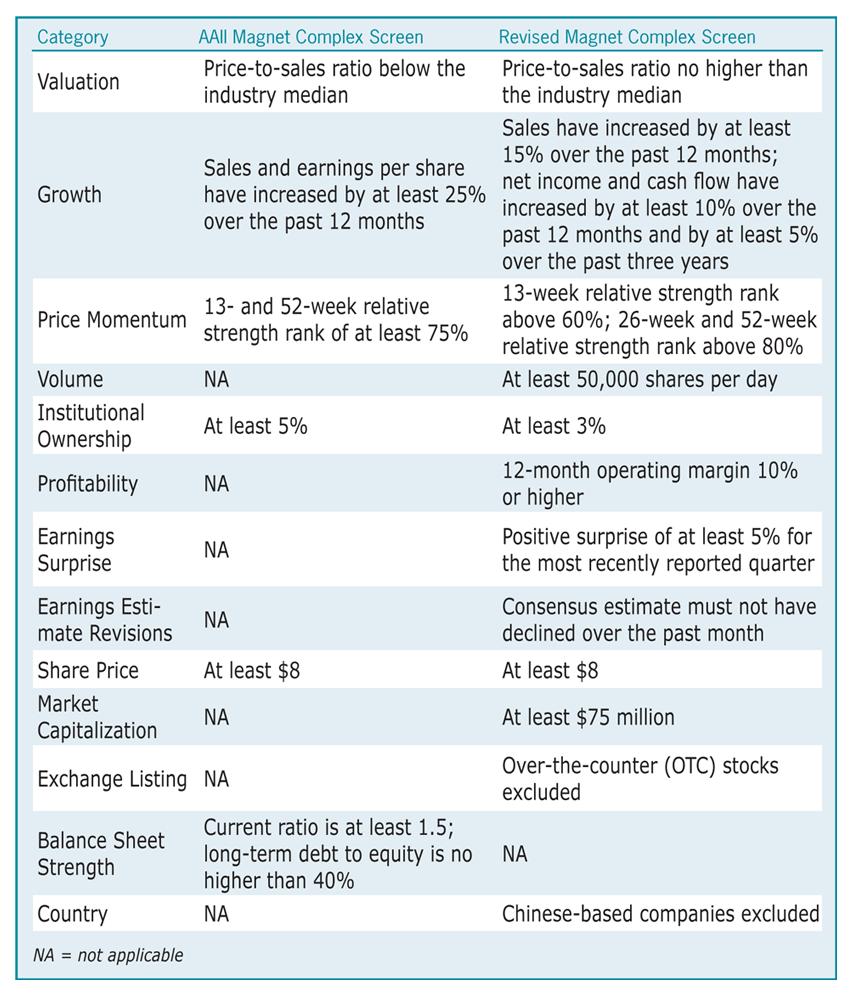
Given the nature of the MAGNET Complex screen—blending momentum, growth and value styles into a singular approach—it may not be surprising that so few companies are able to satisfy all the screening criteria. So, to possibly increase the number of passing companies, a second MAGNET screen was created: the MAGNET Simple. The Simple screen maintains the “value on the move” approach, but does so with fewer filters. (Figures 1 and 2 outline the screening criteria used for the original MAGNET screens.) The Simple screen removes the criteria used in the MAGNET Complex screen related to minimum share price and institutional ownership, the current ratio, long-term debt to equity, the price-to-sales ratio and growth in earnings per share over the last 12 months. Theoretically, by removing criteria, more companies will pass the screen.
The MAGNET Simple screen has outperformed the Complex screen on an absolute basis (13.8%) and a risk-adjusted basis (9.0%) since the beginning of 1998. The Simple screens ranks at the top of all AAII screens in terms of risk index at 2.98. As a result, the Simple screen only performs slightly better than the Complex screen on a risk-adjusted basis (9.0% versus 8.6%. Interestingly, although MAGNET Simple screen was intended to be less restrictive, its average number of holdings isn’t very different than its more intricate version; an average of three companies passed the Simple screen each month between the start of 1998 and June 2015.
Revised MAGNET Screens
In the June 2015 issue of the AAII Journal, Kimmel addressed the fact that there were few companies passing the original MAGNET screens, often leading to erratic returns, excessive turnover and high volatility. Because of this, Kimmel made adjustments to the original AAII MAGNET screens to try to generate more passing companies, which he detailed in the Journal article. To his credit, Kimmel’s changes were not based on system optimization. As a result, Kimmel and the CI staff were more than a little surprised by the backtested results of these revised MAGNET screens.
The differences between the “original” AAII MAGNET screens and the revised screens are shown in Figures 1 and 2 and are taken from Kimmel’s June article “Revising the MAGNET Screens,”
Impact of the Changes
The revised MAGNET screens exclude firms whose latest reported quarterly earnings have not exceeded the consensus estimate by at least 5%. We backtest all of the screens we track on AAII.com using AAII’s fundamental stock screening and research database program, Stock Investor Pro. However, quarterly earnings surprise was not added as a data element until the beginning of 1999. So our backtesting of the revised MAGNET screens spans from February 26, 1999, through June 30, 2015. The monthly performance for a given screen is based on the stocks that passed at the end of the previous month, so we did not have performance for the stocks that passed the revised screens at the end of January 1999 until the end of February 1999. For easier comparison, the performance table and chart in Figure 3, for all four MAGNET screens, cover the period from February 1999 through June 2015.

Changing the screening criteria of the original MAGNET screens had a significant impact on the backtested performance. While Kimmel’s overall goal for revising the screens was to allow roughly five to eight companies to pass the screens each month, the average number of companies passing did not change for the revised MAGNET Complex screen and only increased by one for the revised Simple screen.
Between the end of December 2011 and the end of August 2012 (nine months), no companies passed the revised MAGNET Complex screen. The most companies that passed the screen between the end of December 1999 and June 2015 was 13, which happened in May of 2008.
Additionally, as Figure 3 shows, performance of the revised screens significantly lags the original screens as well as the S&P 500 for most years from February 1999 through June 30, 2015. The average annual risk-adjusted return for the revised screens are actually negative: the revised MAGNET Complex screen produced an average annual risk-adjusted return of –4.3%, while the revised MAGNET Simple screen declined 3.4% on an average annual risk-adjusted basis. Over the same time period, the original MAGNET Complex screen had an average annual risk-adjusted return of 8.6% and the simple screen generated a 9.0% average annual risk-adjusted return. The revised MAGNET Complex screen has a risk index of 2.18 compared to its original counterpart’s risk index of 2.82. The revised Simple screen has a risk index of 2.26, while the original screen’s risk index is 3.10. Based on these figures, Kimmel achieved one of his goals for revising the MAGNET screens: lowering the volatility.
It is notable, however, that the revised MAGNET Complex screen appears to be a fairly decent bear market screen. In 2000, during the “dot-com bubble,” the S&P 500 declined 10.1%. That same year, the revised Complex screen jumped 99.9%. In 2007, at the start of the most recent financial crisis, the revised Complex screen gained 55.7%, compared to the S&P 500’s 3.5% gain. In 2008, the S&P 500 lost 38.5%, while the revised Complex screen was up 1.7%. While the screen didn’t perform well in every bear year, it certainly had noteworthy performance in 2000, 2007 and 2008. Keep in mind that this bear market performance is possibly due to the concentrated number of holdings. If so, missing out on even one of those passing companies might have had an adverse negative impact on performance.
Hypothetical Versus Reality
After we finished our backtesting, we presented our results to Jordan Kimmel for his feedback as to why our returns differed so greatly from his real-world experience.
There are steps taken in a real-world investing strategy that can play a significant role in performance over time. In his book “The Magnet Method of Investing,” Kimmel states, “This blend of growth, valuation, and momentum is expressed in our proprietary performance measures and then is put through our unique ranking process to create an ordered list of stocks for the construction of our portfolios. Top-ranked MAGNET companies are expected to perform well, and those with poor rankings are expected to underperform.”
Our backtesting methodology is purely quantitative. If a stock passes the screen in a given month, it is assumed it is “bought” for the hypothetical portfolio. If it falls off the passing company list the next month, it is not included in the hypothetical portfolio for that month. There is no additional analysis—mathematical or qualitative—that is used. And since we are not privy to the ranking process Kimmel uses, this would inevitably lead to him investing in stocks that differ from our hypothetical portfolio.
It’s important to realize that a typical investor would not simply buy all the stocks that pass a screen and sell the ones that don’t pass every month-end. An investment approach encompasses different holdings periods for different companies, has stringent sell rules that may not be the same as the reverse of the buy rules, and implements different order types to capture an efficient price point. The MAGNET process is an active style of portfolio management and involves significant discretion, which is something a mechanical backtest cannot do.
Jordan Kimmel has said, “A great investment is a combination of a great company, and finding it at the right time.” Market timing is not something we do for the AAII stock screens, but it may play a role in many individual investor’s portfolios.
Other Metrics Used in the MAGNET Process
Figure 4 outlines Jordan Kimmel’s revised MAGNET approach. As you can see, Kimmel uses stop-loss orders when trading his MAGNET approach. Stop-losses place an order to buy or sell once the stock reaches a certain price and is used to limit downside losses. AAII does not implement stop-loss orders when calculating performance over time. Kimmel states, “Large losses can result for 101 different reasons. I just want to avoid them, and stop-losses are there to prevent them.”
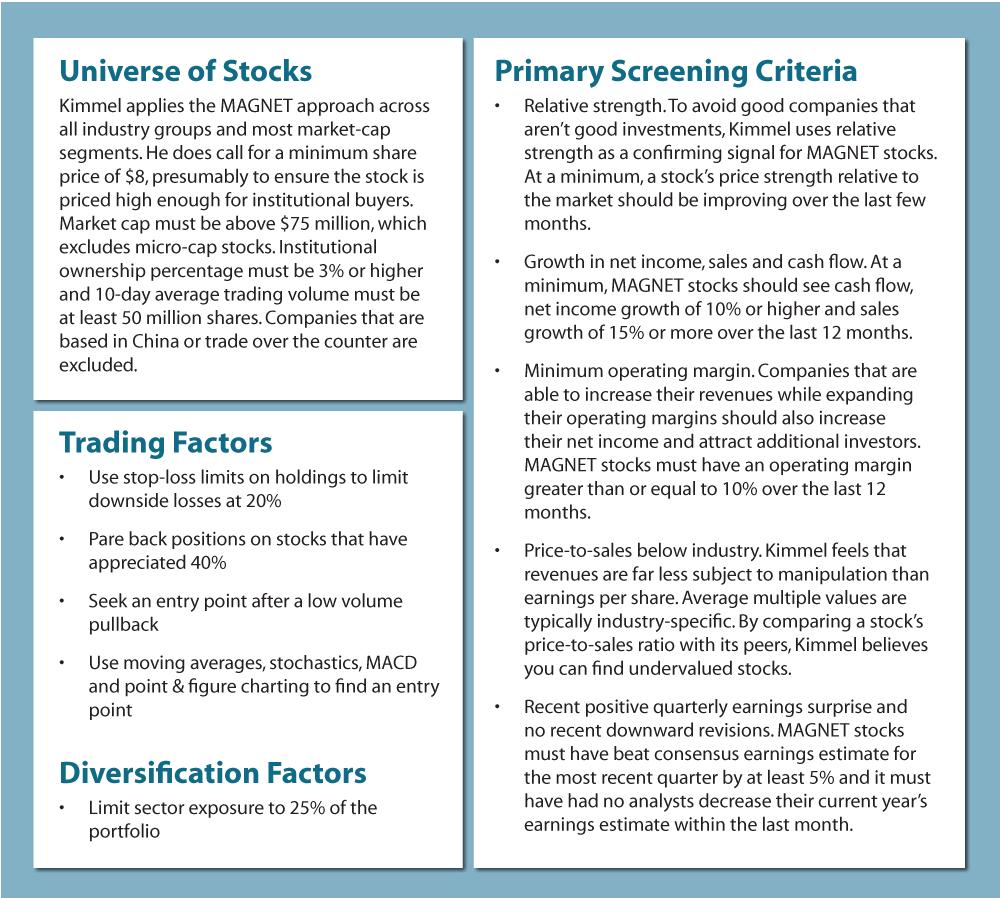
While certain factors are quantitative when considering which stocks to add to your portfolio, there is still much discretion involved, especially when you are actively managing your portfolio. For example, in Figure 4, some factors are quantitative, such as “price-to-sales no greater than industry price-to-sales,” while some are qualitative, such as “seek companies in emerging industries.” There is no specific stock screening factor you can use to pinpoint an emerging industry, but there may be certain quantitative characteristics emerging industries exhibit. Individual investors must be careful not to create a “super stock screen” that inevitably ends up making the screen too restrictive. If a screen is too restrictive, it also limits the possibility of proper portfolio diversification, as was the case with the original MAGNET screens.
Our backtesting also does not limit sector or industry exposure. However, Kimmel tries to limit the exposure of a single sector to less than 25% of his overall portfolio. When a stock screen has only one or two passing companies, it is impossible to diversify away sector or industry risk.
Building the Revised Screen in Stock Investor Pro
For those who are Stock Investor Pro subscribers, you may be wondering how you can implement these changes into a screen. You can download the screening for both revised MAGNET screens from here.
Conclusion
While the results of our backtesting of the revised MAGNET screens did not generate the results anyone was expecting, this exercise offered a very useful lesson. While trying to lower the volatility and increase the passing companies for AAII’s original MAGNET screens, Jordan Kimmel made changes that ultimately led to only a slight increase in the number of passing companies and worse performance, on both an absolute and risk-adjusted basis.
Until you test a screening system, whether via backtesting or paper trading in “real-time,” you will not know what the results will be. Our backtesting is hypothetical in nature, and involves assumptions that do not apply to the real world and do not match the trading behavior of most investors. However, by applying these same conditions across all of the stock screens AAII tracks, we are able to get an idea of how various strategies perform over varying market conditions.
It is also worth pointing out that the revised MAGNET screens do not match the exact selection criteria used by Jordan Kimmel in his own investing. This is one of the few AAII screens developed by someone outside the Association.
In the end, knowing whether a screen does not perform as expected is just as useful, if not more so, than finding one that, at least on the surface, is a winning strategy.
Discussion
FREE REPORT

Charles Seberg from IA posted over 11 years ago:
Jaclyn McClellan from IL posted over 11 years ago:
Donihue from Switzerland posted over 11 years ago:
You need to log in as a registered AAII user before commenting.
Log InCreate an account