


Ken Fisher leads a class in AAII's new Essential Investing Video Course. Go to https://www.aaii.com/ves for more information and to subscribe.

“U.S. stocks are overvalued. Buy Europe.” “European markets are too euphoric. Buy American.”
“We need a strong dollar so we can be the world’s primary reserve asset.” “A strong dollar sinks exporters, killing our economy.”
Those are just two of the media’s frequently contradictory takes on financial topics. We’ve all heard investors move and think like one big crowd, but there are really two crowds. The main herd, and the “anti-herd”—the main herd’s near mirror image. The media often call them “contrarians,” but the real contrarians are those who see through both herds, think independently and do something different. Not opposite! Just different. This is one key to avoiding common pitfalls and investing successfully over time.
It doesn’t take sophisticated models, rigorous training or a finance degree. Often you can cut through the noise with simple logic. The media habitually look for patterns and assume every coincidence of Event A with Outcome B is a concrete causal relationship. You can debunk most of it lickety-split without employing heavy analysis—a basic logic test will do.
The Myth of Dollar Strength and Weakness
To demonstrate this, let’s apply a logic test to most of today’s big questions and alleged risks, starting with fears the strong dollar will doom this economic expansion and bull market. The narrative says a strong currency hurts exporters by reducing the value of overseas revenues when converted back to dollars, which sinks earnings and stocks. We could debunk this one with math, showing how multinationals have overseas costs, too, and the dollar’s effect on both sides of the balance sheet usually evens out. Or we can ask a simple question: If the strong dollar is so bad, then why did the U.S. economy and big-cap stocks lead in the mid-to-late 1990s, when the dollar was even stronger? (See Figure 1.) Why did the UK do great then, too, while the pound was sky-high? On the flipside, if a weak currency is so good, why hasn’t Japan been the developed world’s best-performing economy since early 2013? Why did it have a recession last year? Why did foreign stocks and economies dominate the 2003–2007 bull market? These counterpoints show that the fears aren’t justified, as many think they are.
A similar test can defang fears of the dollar losing its status as the world’s favorite reserve asset. A quick jaunt to the International Monetary Fund’s (IMF) database on foreign exchange reserves shows the dollar has steadily lost market share since 2000. See for yourself—go to www.imf.org/external/data.htm and click on “Currency Composition of Official Foreign Exchange Reserves.” You’ll find America’s share of world reserves dropped from 72.1% in the first quarter of 1999 to 62.9% in the fourth quarter of 2014. A big drop! The world didn’t end. Society didn’t collapse. Some argue that being the world’s reserve currency grants America privileges, like low interest rates. Well, if that’s true, why aren’t U.S. Treasury yields habitually the world’s lowest? Japan and Germany frequently have lower yields, and there are far fewer yen and euros in global reserves. This fear, too, evaporates when you test it.
Criticism Over Buybacks Is Misguided
The current bugaboo about stock buybacks evaporates too once tested. Econ 101 tells us that buybacks are bullish: They reduce stock supply, driving stock prices higher. Yet buybacks are unloved as I write this in June 2015. Many believe that buybacks leech money from more productive corporate investment—such as research and development—killing economic growth. Even worse, some argue, buybacks won’t even boost earnings or equity per share because euphoric executives are buying back overvalued stocks, teeing up a corporate balance sheet bloodbath. Scary, but wrongheaded. As discussed further momentarily, euphoria is absent today. Price-earnings (P/E) ratios are slightly above average—signaling warming optimism—and they often rise for years as bull markets mature. U.S. stocks set 347 new all-time highs in the 1990s bull. Nothing now indicates some outlandish blind frenzy.
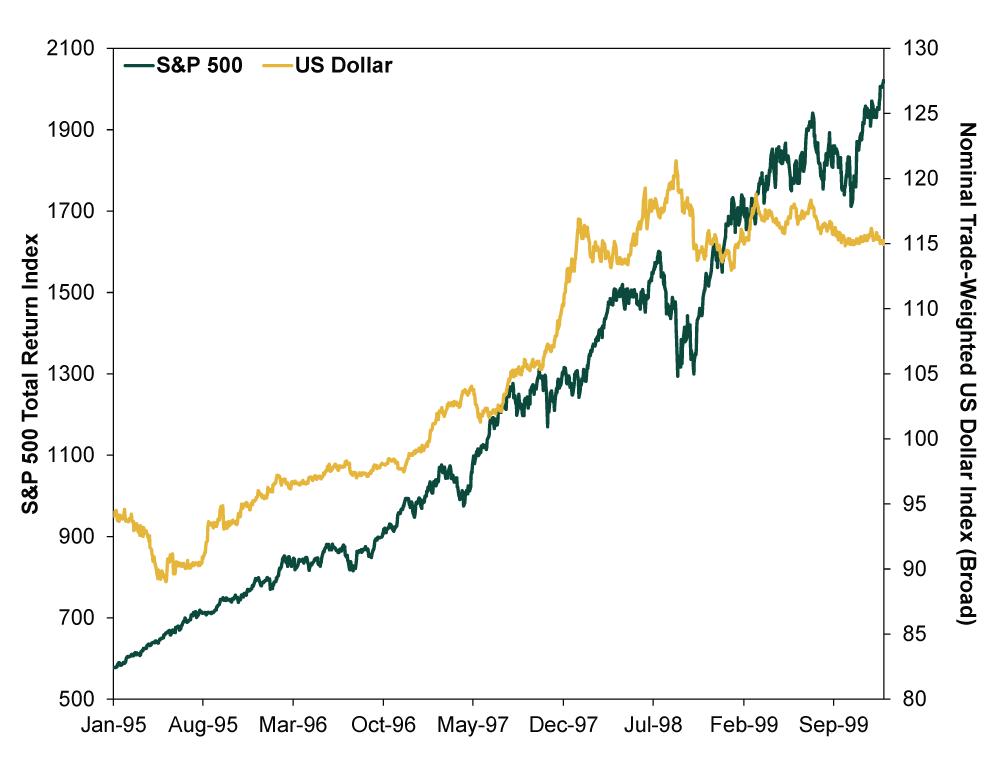
Source: FactSet, as of June 10, 2015.
S&P 500 Total Return Index and Nominal
Trade-Weighted U.S. Dollar Index (Broad),
January 4, 1995, through December 31, 1999.
S&P 500 Total Return Index and Nominal
Trade-Weighted U.S. Dollar Index (Broad),
January 4, 1995, through December 31, 1999.
By thinking differently than the crowd, it becomes easier to see that buybacks also don’t kill growth or business investment. The myth persists because big U.S. firms spent $805 billion on buybacks and dividends last year, just shy of total earnings ($1.1 trillion). Naysayers claim this leaves little for new plants, equipment, projects and research and development (R&D). Logic test time! Ask: Do companies finance investment with last year’s earnings and cash on hand only?
Heck no! They borrow, leveraging balance sheets to grow and reward shareholders simultaneously. From 2010 to 2014, big U.S. firms issued $6.5 trillion in bonds and amassed $4.7 trillion in earnings. They also spent $2.3 trillion on buybacks and $1.3 trillion on cash-based mergers and acquisitions (M&A). Meanwhile, broader national statistics show U.S. businesses invested $9.7 trillion— including $1.3 trillion on R&D—and pumped cash balances to $2 trillion. Business investment, R&D and earnings hit records in 2014. Debt financed that growth.
If companies financed investment with cash and earnings only, they would never grow—even if they never bought back shares. Say Firm X earns $1 billion annually and has a 10% return on equity. If the company’s executives wanted to spend $10 billion on a new plant, they’d have to wait 10 years to build it and another 10 to break even. Twenty years for today’s business plan to bear fruit! This won’t work. If they borrow, they can break ground now, use cash and earnings to pay the interest and reap rewards much sooner.
Most accept debt-funded investment with a high return on investment (ROI) as smart financial management. Debt-funded buybacks are, too. They are simple arbitrage: borrow cheap, invest the proceeds in something higher-yielding and profit off the interest rate spread. Not coincidentally, buybacks began ascending when stocks’ earnings yields—inverse of the price-earnings ratio—jumped above corporate bond yields in 2004. They have stayed there for most of the last decade, making debt-financed buybacks quite profitable (Figure 2).
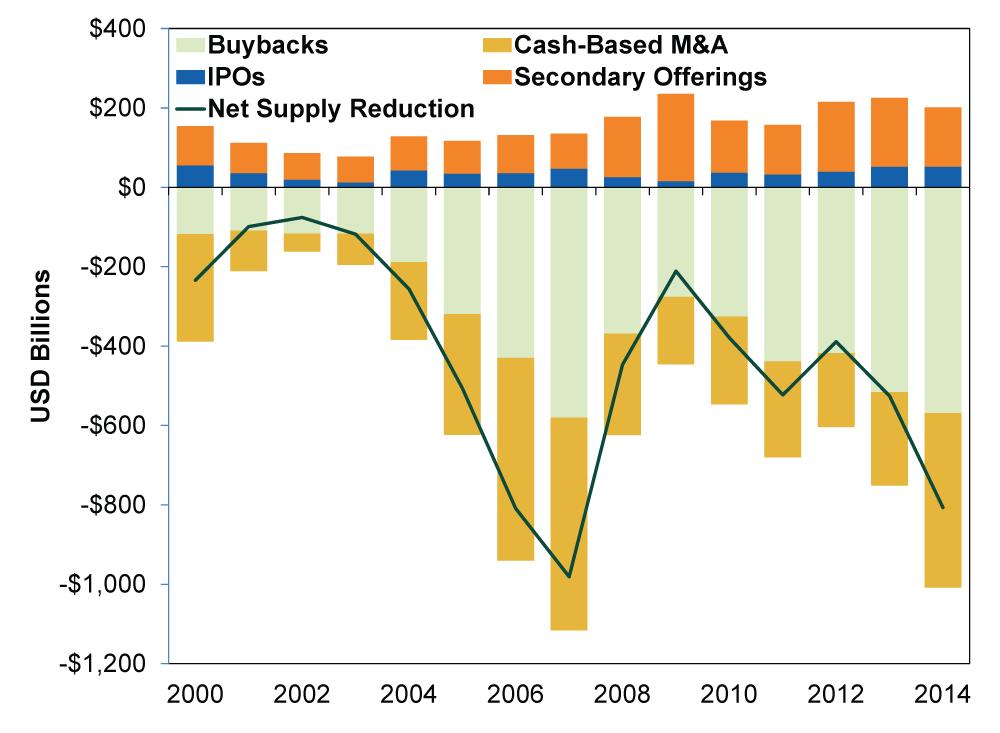
Source: FactSet, as of December 31, 2014.
Pretend you’re the chief financial officer (CFO) of an investment-grade firm. As I type, you can borrow at 2.8% pretax. Your 12-month forward earnings yield matches the S&P 500’s at 5.9% aftertax. Returns dwarf costs, making buybacks a no-brainer. Why not boost net income while rewarding shareholders? Why wouldn’t the board approve it? Similar logic applies to debt-financed M&A, which are similarly scorned. Smart, profitable use of the balance sheet.
Thinking differently about buybacks and cash-based M&A lets you see them for what they are—stock supply-destroying, bull-market magic. Today’s shrinking stock supply is one of the unsung positives driving the current bull market.
Don’t Pick Sides, Invest Globally
Logic tests work far and wide. Sometimes, they can be as easy as spotting a false either/or, like the U.S. vs. Europe debate mentioned at the outset. You needn’t dig in to the vagaries of U.S. or European markets to determine which to own. You needn’t choose one over the other—this is both/and, not either/or. U.S. and European markets can outperform the world simultaneously. If you’re optimistic about America and Europe, you can overweight both relative to their share of the global market, and invest less in Asia or Canada. Exclude either America or Europe, and you lose diversification—bad news.
Same goes for the U.S. vs. foreign stocks debate. Some argue U.S. beats all, citing the S&P 500’s superior return since 1970. Well, if American stocks are so permanently superior, why would anyone own a foreign stock ever? And why would many argue foreign stocks are “riskier” and have higher return potential, thus making them superior? Tune out the noise and invest globally. U.S. and foreign stocks swap leadership often, and U.S. stocks’ alleged long-term outperformance comes from the last few years (Figure 3).
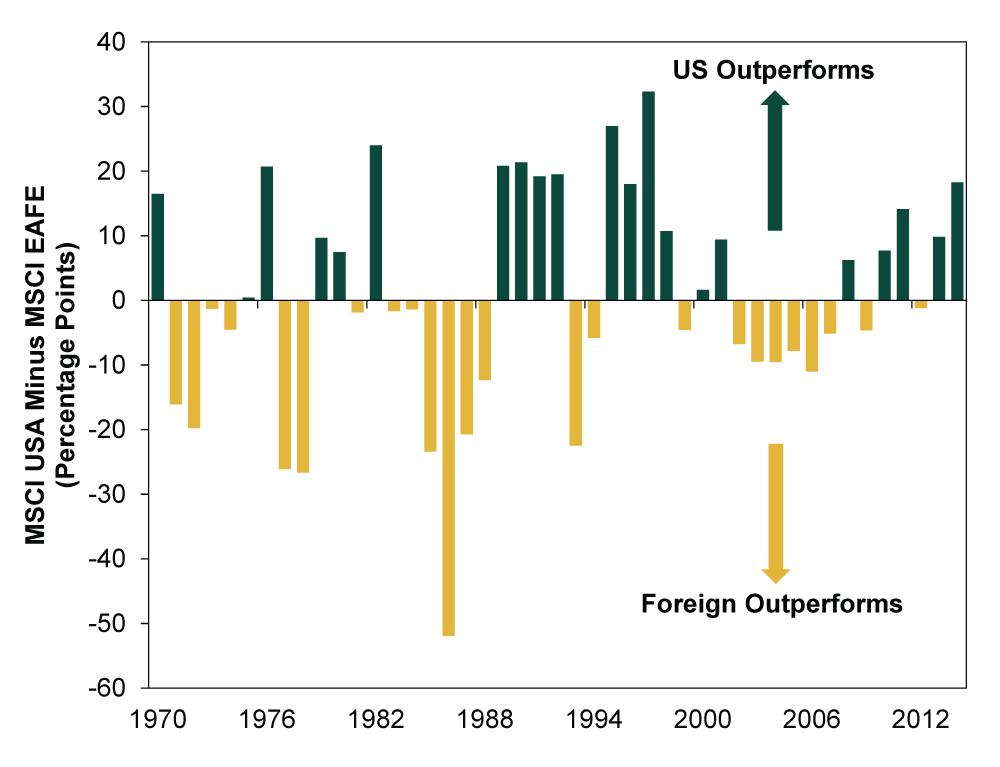
Source: FactSet, as of January 7, 2015.
MSCI USA and MSCI EAFE returns with dividends
(and net of foreign tax withholdings for the MSCI EAFE),
December 31, 1969, through December 31, 2014.
MSCI USA and MSCI EAFE returns with dividends
(and net of foreign tax withholdings for the MSCI EAFE),
December 31, 1969, through December 31, 2014.
Simple logic can help you defeat most of today’s fears, such as those about Greece. As I write this article, Greece is nearing its umpteenth arbitrary deadline to get bailout funding or default for the third time since 2012. Perhaps by the time you read this, they’ve defaulted (or reached a deal—anything is possible!). Will Greek bankruptcy upend world markets, as so many fear?
Don’t get caught up in thinking of Greece as a country—you’ll overthink political ramifications. Instead, think of Greece as a company—a unit that produces a certain amount of economic activity. Its gross domestic product (GDP) is analogous to corporate revenues—both measure annual output of goods and services. Not a perfect comparison, as the statistics themselves aren’t perfectly precise, but good enough. Greece’s GDP is roughly $200 billion, comparable to General Motors’  (GM) revenues in 2007, the year before its implosion began. Did GM’s bankruptcy wreck global markets? Nope. GM announced its impending default in April 2009, weeks after a new bull market began. It filed Chapter 11 on June 1, 2009. Stocks soared that year. GM, like Greece, was too small to cause a tailspin. Greek GDP is similar today to Chevron’s (CVX) $191.8 billion in revenues and Samsung Electronics’ $195.9 billion. It is smaller than Toyota (TM) and Volkswagen. Would the world end if any of these went under today? In a $77 trillion global economy growing 3% a year with modest inflation, it takes a few trillion dollars in problems to render recession. A $200 billion country going bankrupt won’t cut it.
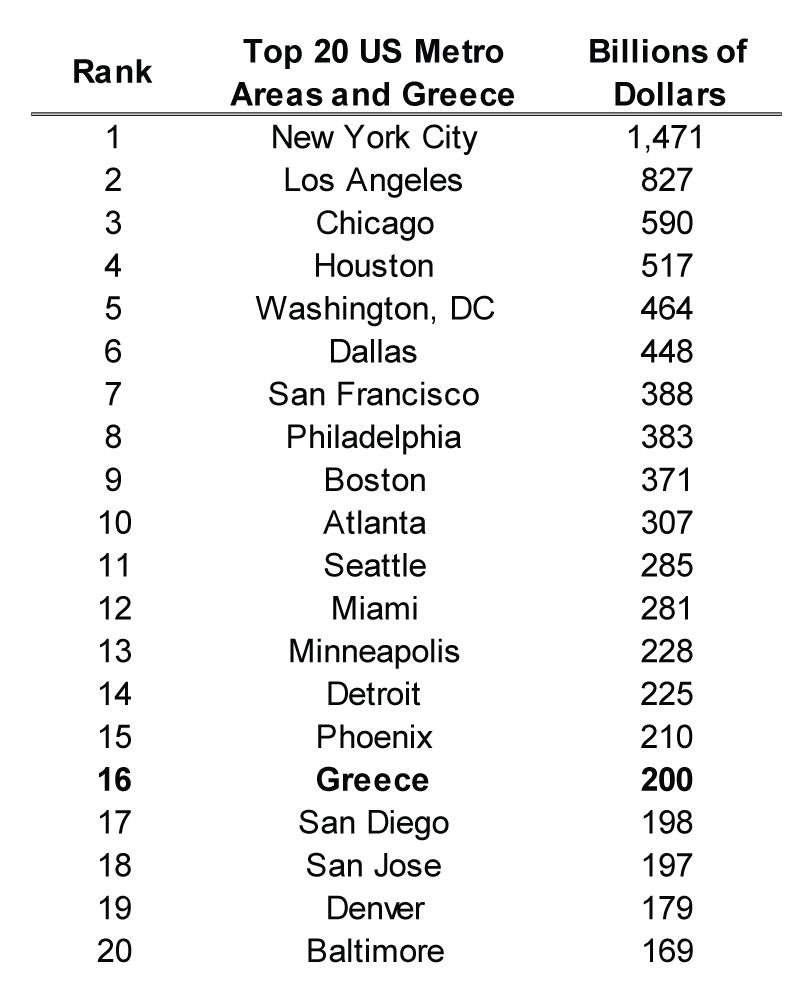
Source: U.S. Bureau of Economic Analysis and FactSet,
as of June 3, 2015. U.S. Metropolitan Area nominal GDP
in 2013, Greek nominal GDP in 2014.
as of June 3, 2015. U.S. Metropolitan Area nominal GDP
in 2013, Greek nominal GDP in 2014.
The counterpoint to this is “yeah, but Greece is in the eurozone, putting other countries at risk.” Fine, then think of Greece as a U.S. city (Figure 4). Greek GDP is smaller than Detroit’s output in 2013, the year it went bankrupt. Did Detroit spark the great U.S. debt crisis of 2013? No, and U.S. stocks rose 32.4% that year. New York City is far, far bigger. When it went bankrupt in 1975, America was fine: The S&P rose an astounding 37.3% that year. Detroit’s and New York City’s bonds were owned primarily by banks and individual investors—both are far less exposed to Greece. Eurozone governments and the European Central Bank own most of Greece’s bonds. The financial system is backstopped.
Price-Earnings Ratios Are Not Predictive
“Stocks are overvalued!” is another easily debunked cry. Pundits point to above-average price-earnings ratios as evidence, arguing stock prices are inflated relative to earnings and must fall. The S&P 500’s current one-year trailing price-earnings ratio is 18.3. So ask: Has a price-earnings ratio of 18.3 historically triggered bear markets? The answer is no. As Figure 5 shows, the S&P 500’s price-earnings ratio crossed above 18.3 in December 1992 and stayed there for two years—while history’s longest bull market was just getting started. Price-earnings ratios blipped lower in 1995 but passed 18.3 again that October and soared for years. The bull partied on until March 2000, when price-earnings ratios neared 30. When the 2002–2007 bull market began, the S&P 500’s price-earnings ratio was just over 21.0. It stayed above today’s level for most of the next two years. During the current bull, price-earnings ratios topped today’s level for big chunks of 2009 and 2010.
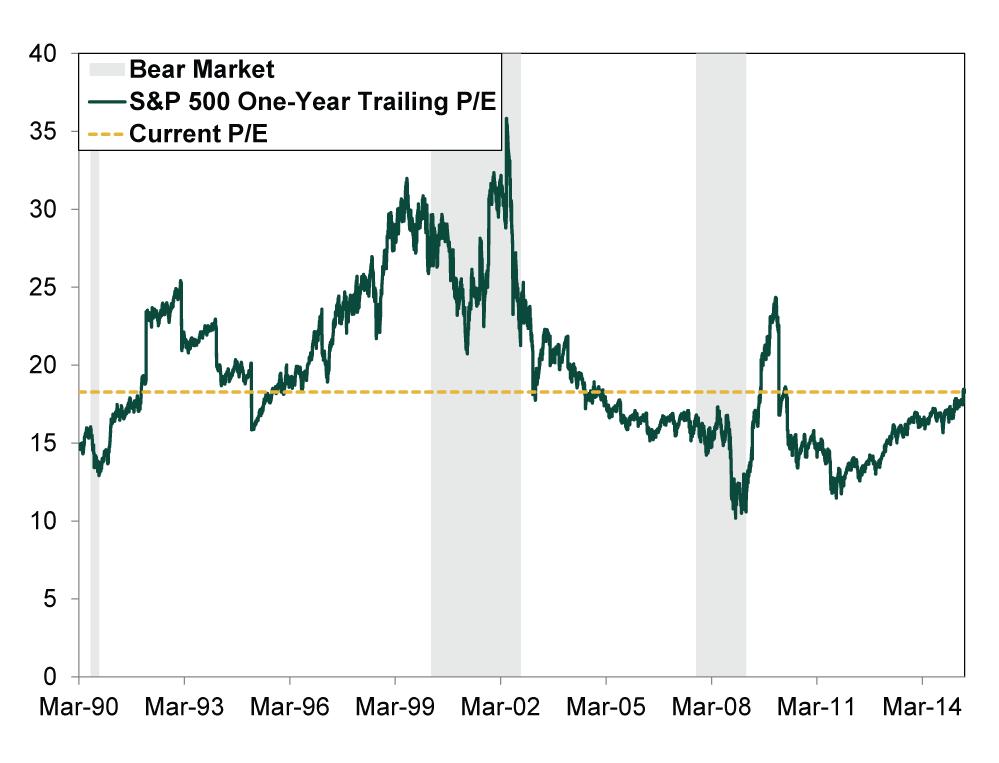
Source: FactSet, as of June 3, 2015.
S&P 500 One-Year Trailing P/E, March 16, 1990,
through May 29, 2015.
S&P 500 One-Year Trailing P/E, March 16, 1990,
through May 29, 2015.
Price-earnings ratios have no set relationship with stocks. They predict nothing. Simple logic! Do past returns predict the future? Every investment disclaimer in the universe says no. Do past earnings predict future earnings? Nope. That depends on future business plans, economic growth, industry developments and so much more.
Think differently about price-earnings ratios by using them as sentiment indicators. Rising price-earnings ratios as bull markets mature simply signify stocks’ climb up Sir John Templeton’s “wall”: As investors gain confidence, they pay more for earnings. Confidence can ascend for years before euphoria hits. Or, as happened in 2007, something nasty can wallop the bull before sentiment runs its natural course. Price-earnings ratios’ flattish trend before the bear market was more evidence that there was no euphoric peak. The gradual rise we see today is consistent with budding optimism—plenty more “wall of worry” ahead.
Fears of the cyclically adjusted price-earnings ratio, or CAPE ratio, don’t fare better through our logic lens. The CAPE ratio, created by Robert Shiller and John Campbell, compares stock prices to the past 10 years of inflation-adjusted earnings—a “truer” measure of value, according to its disciples. The CAPE ratio today is 27.3. Pundits warn it matched or exceeded this level in 1929, 2000 and 2007—so look out below.
But here’s what the doom-mongers don’t tell you: the CAPE ratio also exceeded today’s level in 2004, early in the last bull market. It also topped 27.0 in December 1996, inspiring then Federal Reserve chairman Alan Greenspan (inspired by Shiller) to question on December 5 of that year whether investors weren’t acting out of “irrational exuberance”—three years, three months and three weeks before stocks peaked. A terrible timing tool.
The CAPE ratio doesn’t pass muster conceptually, either. It was created to predict the next decade’s returns—an impossible task. Anything beyond the next 30 months or so is unknowable! Too many variables, too many developments we can’t fathom today, too many unimaginable technological marvels. Plus, stocks move on supply and demand—there’s no way to know stock supply years from now.
Comparing stocks to the past decade’s earnings tells us nothing—not even sentiment! Today’s CAPE ratio includes earnings depressed during the last recession, skewing it heavily. Then, too, why would earnings from 2005 through 2014 predict profits from 2015 through 2024? If a CFO drafted a long-term business plan by penciling the past decades’ average earnings into the next 10 years, they’d be fired and laughed out of the boardroom. In 2002, Apple’s (AAPL) CAPE ratio would have included the failed Newton personal digital assistant. How would have that helped anyone predict the iPhone’s arrival by 2007? Or the iPad’s launch in 2010? Or the more than $100 billion in net income Apple has generated since 2002?
Be a Contrarian by Asking Simple Questions
While all the preceding examples vary, the trick to debunking them is the same: Just try poking holes with simple questions. When the financial media warns you of impending doom, look for the yeah-buts. “Yeah, but, if the strong dollar is so terrible, why were the 1990s so great?” “Yeah, but, isn’t Greece too small?” “Yeah, but, haven’t price-earnings ratios matched today’s levels during many bull markets?” Finding the right answer to a simple question few others ask will keep you thinking differently—and wisely.

Related

Stock Strategies
Stock Buybacks: Misunderstood, Misanalyzed and Misdiagnosed
Related

Growth Investing
The Rationale for Investing in Emerging Markets
Discussion
FREE REPORT

Get your free copy of our special
report analyzing the tech stocks
most likely to outperform the
market.
G Libby from CA posted over 11 years ago:
Harlan Stueven from CO posted over 11 years ago:
John Geraghty from Texas posted over 11 years ago:
Steven Stark from ID posted over 11 years ago:
Jack Fujimoto from CA posted over 11 years ago:
J. Matesa from PA posted over 11 years ago:
Richard Painter from WA posted over 11 years ago:
J Yockers from OR posted over 11 years ago:
C Camp from NC posted over 11 years ago:
FcFrag from VA posted over 11 years ago:
Jim Linnemann from MI posted over 11 years ago:
Clay from TX posted over 11 years ago:
Dave Gilmer from WA posted over 11 years ago:
Mountain Engineer from WV posted over 11 years ago:
Karl Kaser from VA posted over 11 years ago:
George Muzea from Nevada posted over 10 years ago:
Gary from Maine posted over 10 years ago:
You need to log in as a registered AAII user before commenting.
Log InCreate an account