


This issue’s First Cut seeks out companies that are cheaper than their industry peers yet have better margins and lower levels of debt than the median for their industry.
This First Cut relies on a trifecta of valuation ratios to seek out attractively priced stocks—price to sales, price to earnings and price to free cash flow.
The price-to-sales ratio (price divided by sales per share) looks at the top line of the income statement and may identify undervalued firms sooner than the price-earnings approach and avoid some of the accounting complications of the price-earnings and price-to-book ratios.
The price-earnings ratio (price divided by trailing 12-month earnings per share) is tied to bottom-line profitability and is closely linked to company stock price performance.
The price-to-free-cash-flow ratio (price divided by free cash flow per share, where free cash flow is cash from operations minus capital expenditures and cash dividends) is tied to the actual cash generation and usage of the business and not burdened by accrual accounting.
The First Cut requires that a firm’s price-to-sales, price-earnings and price-to-free-cash-flow ratios come in below the median for the industry in which the company is classified, highlighting companies that are cheaper than the norm for the industry.
Since profit margins vary by industry, the First Cut also requires that the company’s gross margin and operating margin be higher than the industry norm. This type of filter helps to highlight companies that have a competitive advantage. Gross margin (gross profit divided by sales) examines the competitive pricing power of the firm, while operating profit margin (operating income divided by sales) examines the relationship between sales and management-controllable costs.
The First Cut then focuses on financial leverage and strength by requiring that each firm’s ratio of total liabilities to assets and ratio of long-term debt to equity both come in below their respective industry medians. Industry comparisons are desired, as companies in more stable industries can safely assume greater levels of debt.
The final First Cut filter requires a positive consensus earnings per share estimate for the current fiscal year and expected growth in earnings over the next fiscal year. This filter is seeking companies with minimum levels of expected future growth in bottom-line profitability.
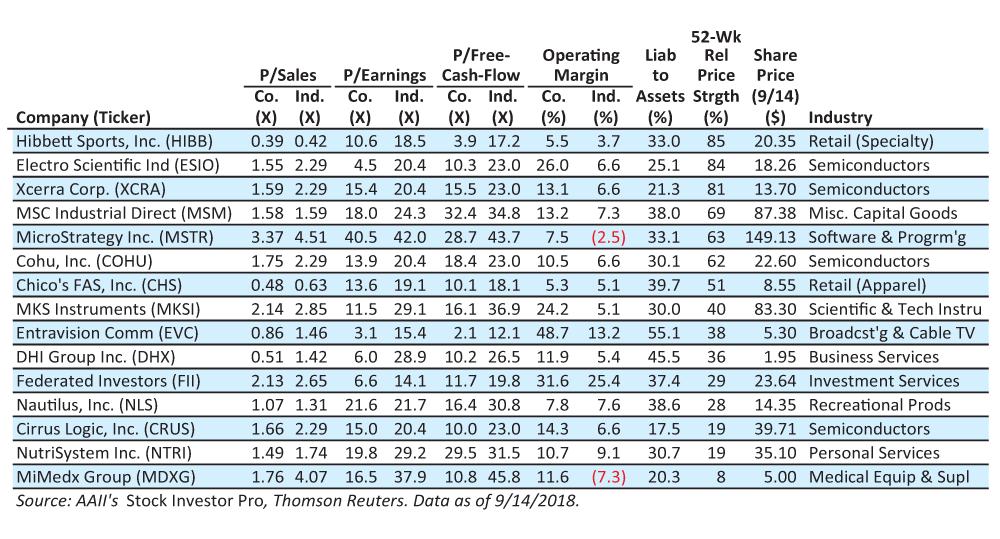
The stocks passing the First Cut are domestic exchange-listed companies with minimum trading liquidity of $300,000 in average daily dollar amount. This trading liquidity measure reflects the current price of a stock multiplied by its average daily volume over the last three months. The 15 stocks making the First Cut are presented in the table ranked by their 52-week relative price strength.
—John Bajkowski, AAII president
| Field: | Operator: | Factor: | Compare to: | |
|---|---|---|---|---|
| Exchange | Not Equal | Over the counter | ||
| And | ADR/ADS Stock | Is False | ||
| And | Country | Equals | United States | |
| And | Volume--Dollar Daily Avg 3m | >= | 300 | |
| And | Industry | Not Equal | Misc. Financial Services | |
| And | Industry | Not Equal | Real Estate Operations | |
| And | Price/Sales | < | Industry Price/Sales | |
| And | PE | < | Industry PE | |
| And | Price/FCFPS | < | Industry Price/FCFPS | |
| And | Gross margin 12m | > | Industry Gross margin 12m | |
| And | Operating margin 12m | > | Industry Operating margin 12m | |
| And | Total liabilities/assets Q1 | < | Industry Total liabilities/assets Q1 | |
| And | LT Debt/equity Q1 | < | Industry LT Debt/equity Q1 | |
| And | EPS Est Y0 | > | 0 | |
| And | EPS Est Y1 | > | EPS Est Y0 |
Discussion
FREE REPORT

No comments have been added yet. Add your thoughts to the discussion!
You need to log in as a registered AAII user before commenting.
Log InCreate an account