


Marc Gerstein is director of research at Portfolio123, a stock screening and research website.
It’s 1980-something and I’m standing in the office of then-Value Line research director Lou Kirschbaum with a few other senior members of the research staff. Lou, a self-described fan of the emerging PC era, is demonstrating a new piece of software that can be used to zip through a database and find the exact kinds of stocks one wants to find. We watch in amazement as the lights flash back and forth to show the computer going between the A drive (in which the floppy disk containing the program was inserted) and the B drive (containing a floppy disk that held the entire Value Line equity database) and then voila! barely a minute later, the monitor flashes names and tickers of a dozen or so stocks with price-earnings (P/E) ratios under 15x (or something similar) and company growth rates above a target that we told Lou to input. I was hooked, my career turned on a dime and I never looked back.
Before getting into Portfolio123, I want to reinforce how important this topic really is. Screening and all that surrounds it is not a trade-show gimmick, a tool, a gizmo, a feature or anything like that. It’s the solution to the investor’s main pain points: What to buy, when to buy and, yes, even the age-old conundrum of when to sell.
Actually, my interest in this area was stoked even earlier (before the Lou story above), back in the 1970s before screening debuted. It took root in an MBA portfolio management class. We had to manage hypothetical portfolios for a class project and, of course, use all the fancy ways of putting them together (efficient frontier, etc.). At term’s end, we did show and tell. Sitting in the back of the room (my favorite location), I noticed something interesting as one student after another droned on. All of the success or lack thereof that each student achieved was related to whether they had good stocks. If they did, their results would be great no matter how they botched the application of the fancy portfolio selection techniques. If they had dogs, there wasn’t an algorithm on this or any other planet that could have helped. How, I wondered, could I make sure I would only look at stocks worthy of being looked at?
Later, as an analyst at Value Line, I couldn’t help but notice that the analysts who were assigned to cover what turned out to be good stocks got all the attention, all the calls from the media, etc. Those who covered dumpster fires were ignored—even though they may have had far-superior analytic skills. Lesson learned: Proficiency in analyzing stocks was useless if the only stocks one got to analyze were toxic.
Screening solves our problems. It helps us see which stocks are worth analyzing, and what existing positions ought to be sold.
Screening in Portfolio123
There are two ways to use Portfolio123.
One way is to use it the way you use every other screener around: as an idea generator. This means you would use a screen to narrow a huge investment universe down to a reasonable number of stock candidates. How many is reasonable? As many as you have time to analyze in depth based on whatever approach you like. My guess is that for the average individual investor, 20 may be at or near the upper boundary. However, as much work as this may still be, you’d be way better off than you would have been if you approached the entire universe from scratch. And the 20 or so stocks you have aren’t just any 20—these are 20 that are prequalified according to characteristics you believe will be associated with probable investment success consistent with your goals.
You could of course bypass screening and get your ideas from CNBC, Seeking Alpha, your friends, your relatives, etc. But seriously, how has that worked out for you?
Idea-generation screening is something I have done right from the start. But after joining Portfolio123 in mid-2008, I discovered the second way to use the platform and upped my game accordingly.
The second approach, creation of and reliance on fully automated models, is something that became possible because Portfolio123 allows users to backtest screens without having to fiddle with a pile of old data CDs. Once I got the hang of this, I took advantage of the full suite of Portfolio123 capabilities to develop fully automated investment strategies through which I buy all of the stocks the model identifies and sell them when the model tells me to do so.
Use of a fully automated system is something that should probably not be done without testing. Portfolio123 lets you do a lot of that—easily and quickly (very quickly, often giving you barely enough time to reach for a cup of coffee before the test is completed). You can test screens, ranking systems and comprehensive strategies that combine screening rules, rankings and sell rules.
You’re never forced to do everything an automated model tells you to do. You can always overrule it, and early on I did plenty of that. Let’s face it, quant is an inexact endeavor so you’re always likely to look at a list and say to yourself “Hmm, how the $%#&@ did that thing get in there?” But here’s what I found. I wasn’t nearly as good at spotting the pigs as my multi-decade analyst resumé led me to believe I was. After a while, I found that I got better results if I just let the model do its thing and count on diversification to allow the legit stocks to overpower the inevitable garbage, especially since I wasn’t all that good at sniffing out the garbage ahead of time.
The best way to demonstrate the difference between the two methods of using Portfolio123 is this: When I use method one (idea generation), I can tell you which stocks I own and talk about them, but with method two (use of a fully automated model), I have no idea what I own, a situation I described in “A Stock Market Pro’s Possibly Bizarre Confession.”
So, which is the right way to use Portfolio123? Whichever way you like: as an idea generator, to give you fully automated investment signals, to give you investment signals you can edit as you like, whatever feels comfortable to you.
From Newbies to Power Users
I’ve heard some say that Portfolio123 is complicated. That’s true if you want it to be. But if you want to be guided step-by-step, we have—in addition to lots of tutorials in the support area, human support from my colleague Paul (yes, support comes not from a telephone bank but from a former Value Line and Reuters analyst) and in the forums from other Portfolio123 users—an automated rules wizard that I’ll show you below.
As for power users (those who are such on day one or those who, like many of our users, evolve into that status), fasten your seatbelts. In addition to the basic stock strategies, you can:
- Mix wizard-generated rules and free-form (power user) rules within the same screen, something that is great at helping you expand your capabilities;
- Use fundamental and/or technical analysis even within the same screen or ranking system;
- Work with stocks, exchange-traded funds (ETFs) or closed-end funds (CEFs);
- Develop, test and use what we refer to as “books” (a portfolio of portfolios), which is the way to build a strategy that includes stocks, ETFs and/or CEFs;
- Build, test and use a screen of screens;
- Develop, test and use short-selling strategies;
- Develop, test and use long-short market neutral strategies;
- Test the impact of trading costs;
- Test the impact of using margin;
- Develop, test and use strategies involving different weighting protocols (i.e., you can create your own smart beta strategy);
- Develop, test and use market timing and hedging techniques.
In the rest of this article, I give a newbie’s view of Portfolio123. I build a simple screen using the wizard, use a pre-set ranking system (available to all users) to narrow the results list down to 15 positions that you want to own, and test the strategy by assuming you want to re-run the screen every three months, sell any stocks that no longer pass muster under the screen and ranking system and replace sold stocks with as many of the top-ranked stocks as you need to bring the number of holdings back up to 15.
I assume that, at the outset and each time the model is refreshed, the portfolio is set to equal weighting. I also penalize each initiation and closing of a position by 0.25% “slippage” to provide a rough estimate of trading costs.
My VQS Model
The first step with Portfolio123 or any other approach you use to find stocks is to determine your strategy. I like value, but not just any value. I want value that can work with real money, which means I cannot think about P/E, etc., until I find a way to screen out financial detritus (i.e., stocks that deserve to be cheap because companies are going to you-know-where in a handbasket). Through experience and machinations with financial theory (the dividend discount model, the concept of discounted cash flow, etc.) that are beyond the scope of this article, I know that ideal valuation ratios rise with increases in growth expectations and/or company quality (the latter is the equivalent of saying reductions in company risk). Also, and again for reasons beyond the scope of this article, I use data relating to analyst sentiment as a proxy for investment-community expectations regarding future growth prospects.
In sum, I’m building a simple VQS (Value-Quality-Sentiment) model that’s sufficiently down-to-earth to allow for real-world use.
Getting Started
I work with the broad Russell 3000 index universe and compare my results with the SPDR S&P 500 ETF (SPY) which, for many, is the default choice when they throw up their hands and say stock-picking is too hard. You need to compare what you do to the results that could have been obtained by investing in a simple, no-need-to-think alternative in order to know if you were good or lucky. If my model helps me generate a gain of 15% in a year, I won’t be able to celebrate if a one-trade no-brainer investment in SPY would have generated a 20% gain. Both the tests of my model and the benchmark include dividend payments. I set the desired number of stocks to 15 and choose to rank stocks with the “Basic: Value” ranking system included in Portfolio123. [The operative word here is “Basic.” The ranking system is based on standard ratios such as the P/E, the price-earnings-to-earnings-growth (PEG) ratio, the price-to-sales (P/S) ratio, the price-to-free-cash-flow (P/CF) ratio and the price-to-book (P/B) ratio.]
The Lay of the Land
It can be nice, before getting far into the grunt work, to get a sense of what we’re up against. Portfolio123 can easily paint this sort of picture.
I know I can easily buy the market, SPY, with one trade. Can I profit simply by taking the top 15 value-rated stocks? Value is all well and good, but there’s no point bothering with it if I can’t use it to beat the single-trade SPY.
Figure 1 shows my results if I simply pick the best 15 value stocks.
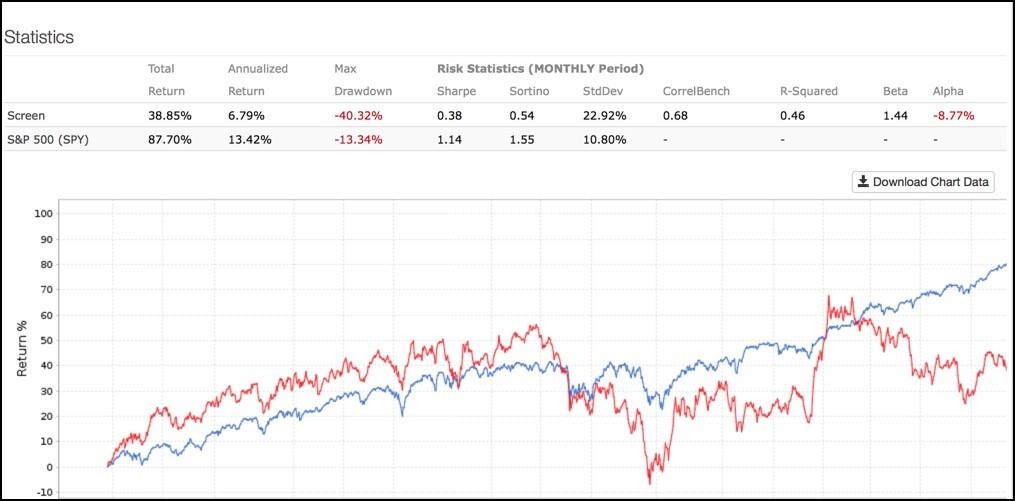
Ouch. Obviously by clustering among the best of the best values (the cheapest of the cheapest, the stocks with the lowest tallies under the ratios used in the “Basic: Value” ranking system), I’m getting into a lot of extreme situations, exceptionally cheap (low value ratio) stocks. Let’s see what happens if I make the list less extreme: Instead of taking the 15 cheapest stocks, I’ll take the 100 best values.
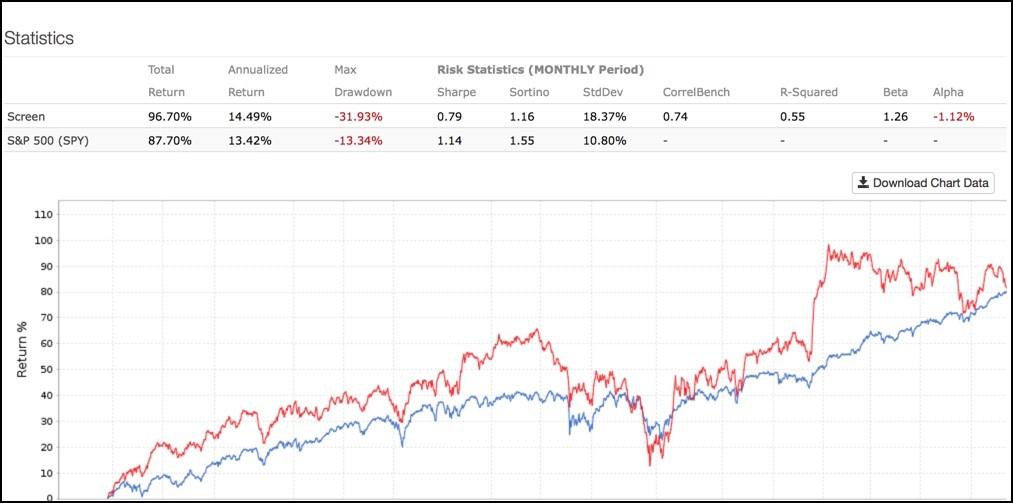
That’s better. We’re closer to SPY’s performance, as Figure 2 shows. Admittedly, “close to,” like beauty, is in the eye of the beholder. Visually, I’m intrigued by seeing the red line, which tracks the portfolio, consistently above the blue line, which tracks SPY. But then I look at the numerical comparisons above the graph and see that the 14.49% annualized return was not so much better than the 13.42% logged by SPY. The negative alpha also tells me that the level of “excess” return I achieved was not enough to justify the more-than-SPY level of risk I took (the portfolio beta is well above 1.00 and the model’s standard deviation was way above that of SPY). Given the extra risk and my ever-present awareness that past performance does not assure future outcomes (which means we must always think in terms of approximation rather than precision), I say there’s no point in owning and trading 100 or more stocks for outcomes this close to the level of performance with one ETF. Since I know there’s probably no way in the real world (as opposed to my ego) I can tinker with the “Basic: Value” ranking system in such a way as to do consistently and meaningfully better, I need to dig into the above-referenced financial theory. I need to limit the group I’ll sort for Value to stocks with good growth expectations (expressed, as I do, through favorable analyst-related data) and good quality. So, I reset the targeted number of Value positions at 15 and move into the screener, which is where I’ll input the Sentiment-Quality rules.
The Strategy
Here are the rules I use:
Sentiment Rules
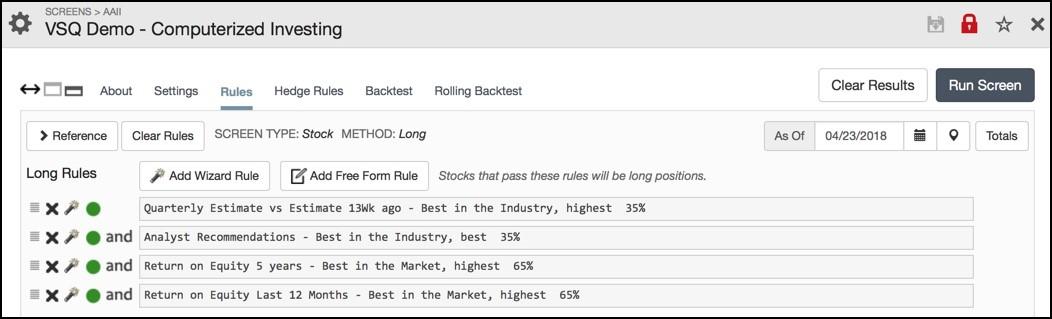
- Improvement in the Capital IQ consensus quarterly earnings per share (EPS) estimate must rank in the top 35% compared to other firms in the same industry.
- The overall analyst recommendation score must rank in bullish 35% compared to other firms in the same industry. [This is a very handy way of comparing one collection of analyst ratings to another; each rating is translated into a numerical score ranging from 1 (most bullish) to 5 (most bearish). Then, an average score is computed by averaging all scores received by a stock weighted by the number of analysts issuing that rating. Therefore, a score of 1.25 suggests a lot more bullish sentiment than a score of, say, 2.93 and better still, we need not care if nobody ever says “sell.” We understand that an average rating score of 3.00 is, wink, wink, pretty bearish.]
Quality Rules
- The five-year average return on equity (ROE) must rank in the top 65% compared to the market (which the Wizard defines as the universe we chose to use) as a whole.
- The trailing 12-month return on equity must rank in the top 65% compared to the market as a whole.
How ’bout those quality (ROE) rules! I asked for the top 65%.
First, note that I framed the rule in terms of a rank position rather than an absolute number. I tend to do this to keep my rules relevant even if conditions change. For example, at some points in time, a 15% ROE may be excellent. Other times, it may be just ordinary. But a return that is better than 65% of all others always has the same meaning.
As to the choice of better-than-65%, as opposed to 95% or 90%, this sort of thing is always a judgment call. For the context of this model, I don’t need the return to be super duper. Decent is fine. The more you do this, the more you see that you don’t always need to strain for the best of the best. Quality is one example of how you can often accomplish more by eliminating junk than by obsessing over gems.
Passing stocks are sorted on the basis of the “Basic: Value” ranking system and I use the top 15 issues.
Setting It Up in Portfolio123
The strategy may look like something beyond the newbie level. I’m not using any “absolute” criteria (like ROE > 15). I’m sorting in all cases, but the sentiment rules are sorting based on industry standing while the quality rules are being applied across all stocks. (Once again, this is a judgment call. Many in the investment community think in terms of and specialize in industry analysis. An industry as a whole may not attract much enthusiasm, but knowing that a stock is better regarded than others that analysts who are following the group are looking at is the kind of information I’d like to be able to tap into. Whatever basis of comparison you want to use, however, the Portfolio123 Rules Wizard, makes choosing and implementing rules as easy as can be.)
I start in the Rules interface within the screener.
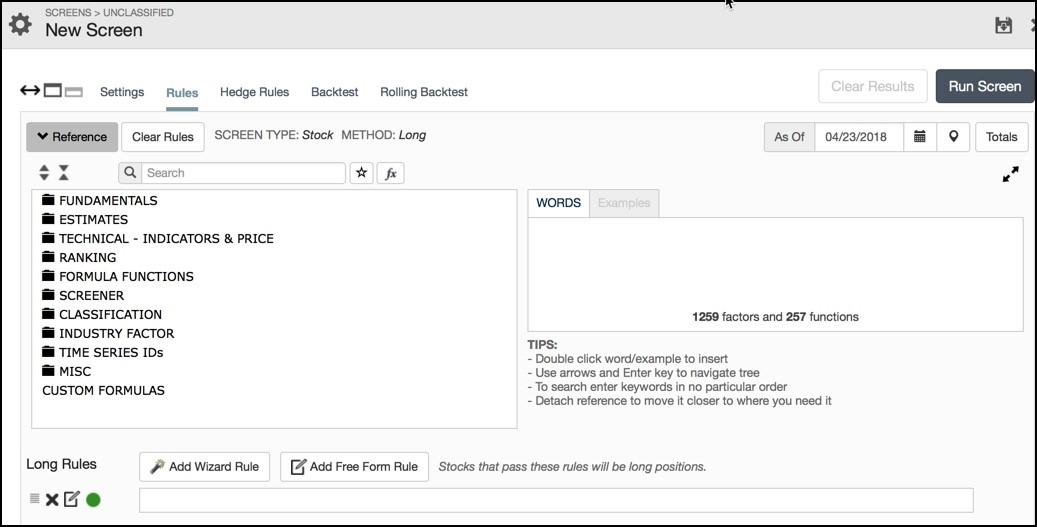
When I go into the screener and click “Add Wizard Rule,” I see a broad set of categories.
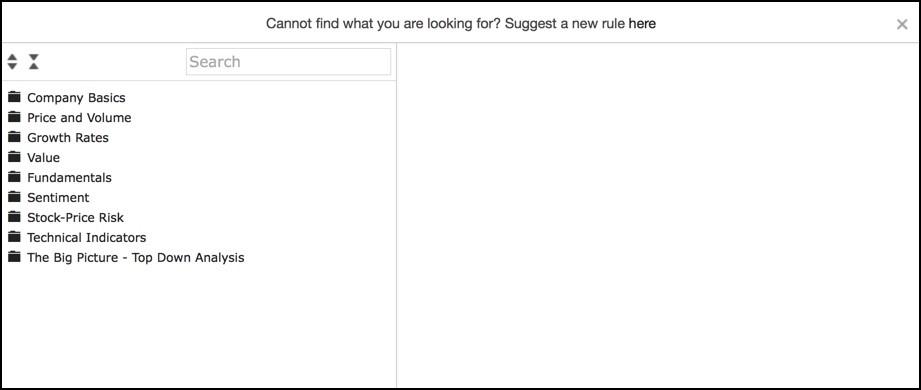
When I click on “Sentiment” and then again on “Analysts,” I see specific items from which I can choose.
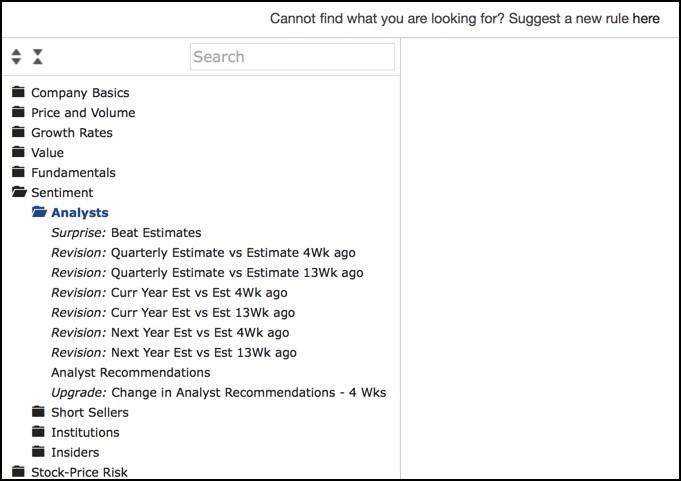
I choose “Revision: Quarterly Estimate vs. Estimate 13Wk ago.” This is a judgment call. (Hmm, how many times have I said that! Because we invest for the unknowable future, this can never be a complete certainty. There’s a lot of art here.) The available data typically allows us to examine changes over one, four, eight or 13 weeks. Novices tend to gravitate toward one-week comparisons, but this is often not as useful as the “freshness” of the information might suggest. Although information travels in nanoseconds nowadays, much of it is still absorbed, processed, evaluated and reacted to at a human speed. And as Wall Street analysts have become less cool than they seemed during the circa-2000 stock bubble (when many first discovered the existence of analysts and such notions as surprise, upgrades, etc.), I’ve been noticing stocks react in a more measured than jackrabbit pace to analyst information. So, I’ve been stretching my preferred comparison periods lately from four weeks to 13 weeks.
Here’s what pops up on the right once I do so.
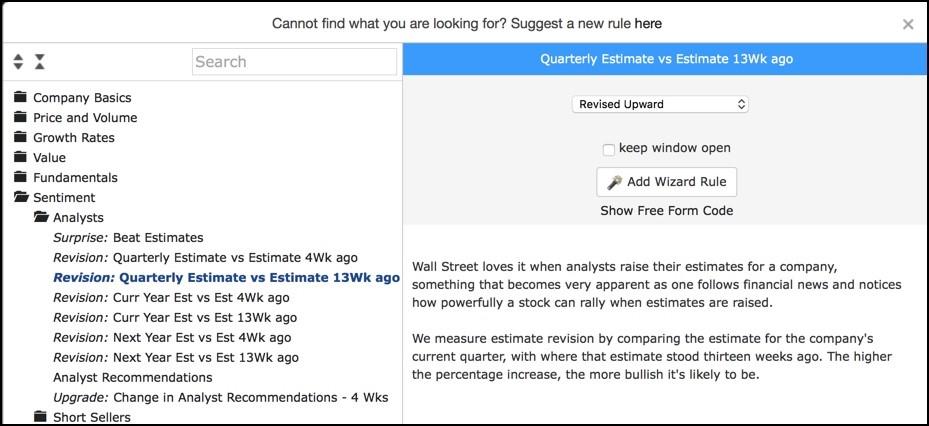
At the bottom, we see a plain-English explanation of how the item can be used, and a link inviting those seeking more detail to click if they wish to do so.
At the top, we see a dropdown menu that already has a default rule set. If you like it and want to use it, all you need to do is click “Add Wizard Rule.” But as you recall, that suggestion (that the estimate was revised upward) is not what I used. I wanted something more demanding. I got it by clicking on the dropdown and clicking on “Best in the Industry.”
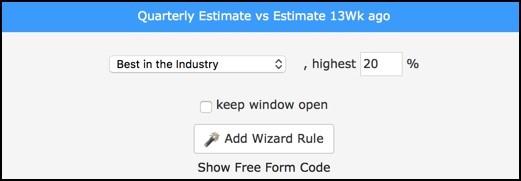
Once again, we have a suggestion (a default rule) and an opportunity to modify it, which I did by changing 20 to 35.

This is how the interface winds up looking when I’m ready to actually input my rule into the platform. As we saw when we considered Figure 6, I could have gone many different ways with this item (as well as all others) without breaking even the tiniest sweat.
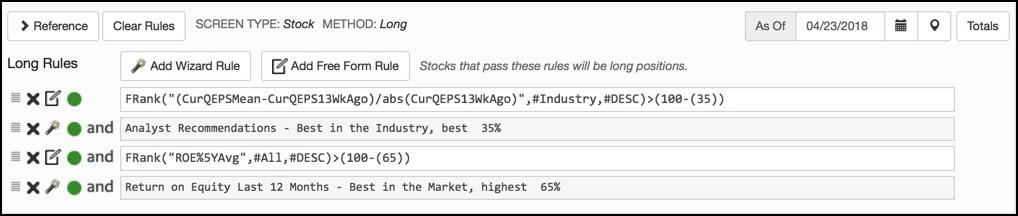
Figure 9 shows the complete screen.
Testing the Strategy
Figure 10 shows the results of a basic five-year backtest.
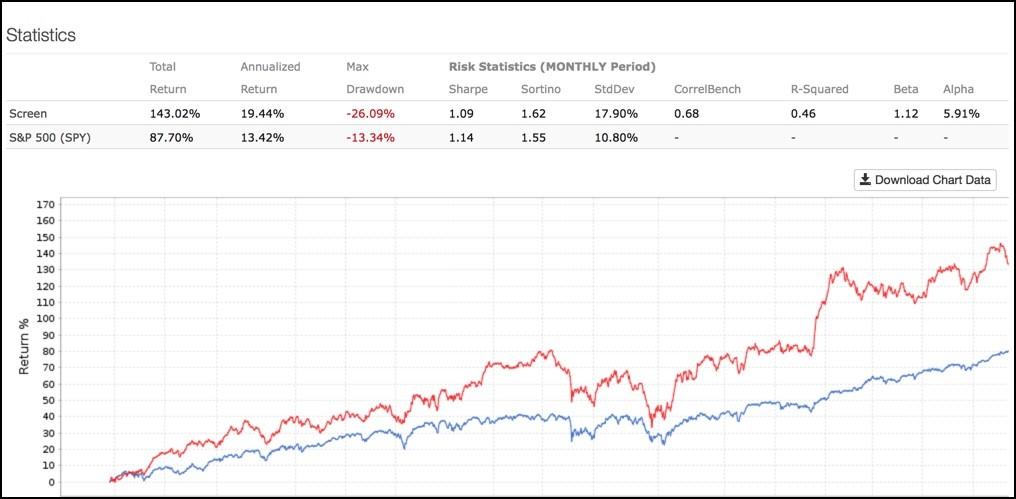
That’s pretty good, and definitely better than what we could have achieved with SPY.
But did we get lucky with our starting date? Were we bailed out by a generally bullish market environment during the test period? That’s an important question to ask. When the bull is stampeding, everybody is a genius. Suppose I had looked only at some slack periods in 2013–2014 and late 2015–2016? This is important to know since I can’t be sure the market will be great going forward—as we all know, past performance is not indicative of future results.
I could run more tests, many, many, many more tests with different stating dates. I’m not really up for that. And I don’t have to be. Portfolio123 gives me something called a “Rolling Backtest” that can tell me what I need to know all at once.
I look at the same five-year period, but this time, instead of running one hypothetical portfolio from start to finish, I run lots of portfolios that end 13 weeks after they begin. The first of these starts on 4/23/13 and runs through 7/23/13. The second one starts a week later, on 4/30/13 and runs through 7/30/13. The third one starts on 5/7/13 and so on and so forth. All in all, I’ll wind up with 262 of these 13-week portfolios.
I can quickly scan a results table and see how each of these did relative to the benchmark. But I like to go right down to the bottom and look at the summary presentation, which shows how the strategy fared overall during 13-week periods when the market rose and of particular importance, during 13-week periods in which the market fell.
Here’s the summary of the results:
|
|
Strategy (%) |
Benchmark (%) |
Excess (%) |
|---|---|---|---|
|
Average of All 13-Week Portfolios |
4.45 |
3.28 |
1.17 |
|
During Up Periods |
6.43 |
4.62 |
1.80 |
|
During Down Periods |
(5.81) |
(3.67) |
(2.14) |
There weren’t many down periods, as we recall from our memories of how things were (that’s the world in which we lived), and the model underperformed in those. (Table 1 shows an average decline of 5.81% for the model versus an average decline of 3.67% for the SPY benchmark we chose.) But I’m pleased to see that the strategy actually did better than SPY during the already good up periods: The top row of Table 1 shows that considering all periods, the up periods were good enough to have allowed the overall average return to come in for the strategy at 4.45%, versus 3.28% for SPY. Keep in mind that all of these tests account for trading costs by virtue of the 0.25% slippage penalty I built in. This gives us comfort that in the real world, what we see as good things from this strategy are not likely to be wiped out by trading costs.
So, is the model a “go?” Yes, if I still think there are good times ahead for the market. But if I’m less sanguine, I should probably tinker some more. I have to recognize that, contrary to a lot of guru-speak about margins of safety and the like, value is an aggressive strategy (all else being equal, lower valuation ratios are associated with higher risk and poorer company quality). Maybe I need to put my quality threshold up above 65. That should reduce the return in good periods, but it would, I expect better protect the downside. Or, perhaps, I might add another screening rule that eliminates all stocks that rate above 95 (or perhaps 98) according to the “Basic: Value” ranking system, as eliminating extremes can do wonders for models.
This isn’t just a matter of idle speculation. These are the kinds of thoughts I have when I see a red flag in a test and the way I decide on how I can revise and retest my strategies. With Portfolio123, the process of thinking-changing-testing-thinking can be done quickly and easily to the point of becoming second nature.
Can you hurt yourself by doing it recklessly? Yes, just as you can hurt yourself driving a BMW recklessly. It’s important to have sound reasons for the revisions you make. (I won’t, for example, add or test a rule that eliminates stocks based on a 30-day trading volume-to-depreciation ratio.) You have to supply sensible thought. Portfolio123 is what makes it actionable.
How does one learn to think sensibly? I’m glad you asked. I created a complete virtual strategy design course for users of Portfolio123. And you’re welcome to see all of it even without being a Portfolio123 subscriber or member. Click here and enjoy.
Conclusion: From Novice to Power User
We’ve just seen an example of how a novice screener can quickly create, test and refine a sensible stock-selection strategy and make it usable in a real world characterized by transaction costs and the realities that the typical individual is not likely to own many positions at the same time. We’ve also solved the age-old when-to-sell dilemma: If it falls out of the screen, kick it out of your portfolio. Many don’t approach the sell decision as cold-bloodedly as this. In fact, users of higher tiers of Portfolio123 can create sets of sell rules. But for basic-level users, this is a terrific, and objective, way to handle the decision without wrestling with all of the contradictory forms of advice you’ll find out there—ride winners and sell losers, average down on losers and take profits on winners—it’s enough to make your head spin. The protocol suggested here winds up seeking any stock your strategy doesn’t consider good enough to buy. How clear is that!
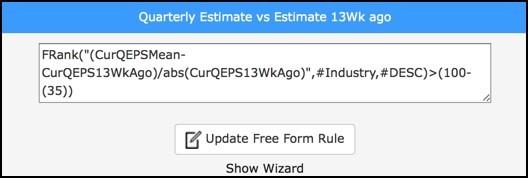
That said, we’ve seen only a small fraction of what Portfolio123 can do. To take advantage of all the good stuff, users will need to get comfortable with “free from” rules, which can look something like the following.
Wizard Rule:
Quarterly Estimate vs. Estimate 13 Wk ago, Best in the Industry, Highest 35%
Translation to Free Form:
FRank(“(CurQEPSMean-CurQEPS13WkAgo)/abs(CurQEPS13WkAgo)”,#Industry,#DESC)>(100-(35))
Ouch. How can anyone learn free form?
Actually, it’s not that hard. Let’s break it down to components that are immediately intuitive or learnable very quickly:
- FRank means Function: Ranking (i.e., we’re sorting something and normalizing the positions on a scale of 0 to 100);
- CurQEPSMean is Quarterly EPS Estimate;
- CurQEPS13WkAgo is EPS Estimate as of 13 weeks ago;
- #Industry tells the sort function to sort each company relative to industry peers;
- #DESC tells the sort function that it’s a descending sort (higher numbers are better);
- 100-35 is a way of saying FRank above 65, but doing it in a way that allows you to easily edit the 35 without dealing with the ascending-descending mental gymnastics; if you decide you want the top 25%, just change 35 to 25 and let the function restate it as a requirement that this particular FRank now be greater than 75.
The trickiest part is how we compare the current estimate (a) to the old estimate (b). We could just rank based on a – b. But if we do that, an estimate change from $1.00 to $1.10 (up 10%) would seem worse than one that rises from $5.00 to $5.20 (up 4%). So, we really need to be working in terms of percent change.
It’s tempting to rank based on a/b. That way, $1.00 to $1.10 works out to 1.10 and $5.00 to $5.20 works out to 1.04. That’s now correct. But what if one of the estimates is negative. Suppose an estimate moves from –0.02 to 0.05. Now, the a/b formulation produces 0.05/–0.02 or –2.5, which looks like a horrific downward revision. We correct for that by using the (a – b)/absolute value of b formulation whenever one of the numbers in a percent change might possibly be negative (that happens a lot with growth rates).
This is a bit complicated. But it’s important because it can prevent bad errors.
As you keep looking at the free form, you start to see that it’s understandable. If only you wouldn’t have to type these things in from scratch—and you don’t. Pointing and clicking can take you a long way, even when you leave the safe confines of the Wizard.
And, by the way, you don’t have to kick the Wizard cold turkey. You can use the Wizard to translate into free form so you can learn free form gradually by example.
And you can mix Wizard rules and free form rules as you wish, even in the same screen.
In my next article, we’ll step up from screening to full-fledged model building and more precise testing.
Discussion
FREE REPORT

Carl Giffels from DE posted over 8 years ago:
Carl Giffels from DE posted over 8 years ago:
Carl Giffels from DE posted over 8 years ago:
You need to log in as a registered AAII user before commenting.
Log InCreate an account