



The Model Fund Portfolio is being discontinued.
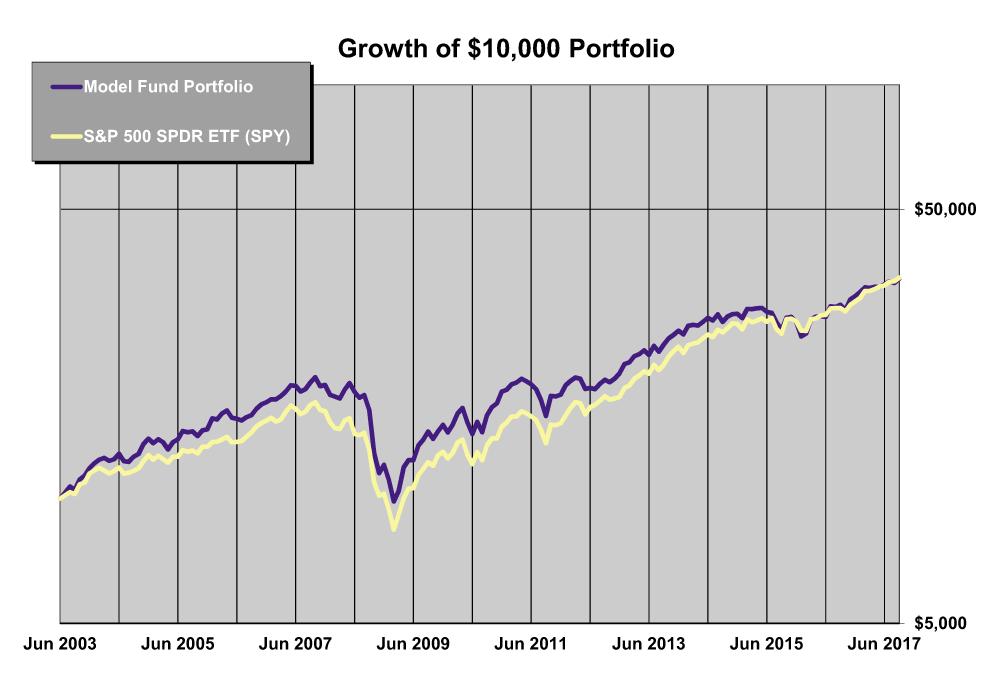
After 14 years, which is a fair period of evaluation and even included one of the three major crashes of the last hundred years, it seems the portfolio has not been able to beat the S&P 500 index as measured by the exchange-traded fund SPDR S&P 500  (SPY).
I do feel that the things I learned and shared with you made the exercise worthwhile. The usual figures and tables are presented here to provide a record up to the end. If you have been selective in the holdings you included and/or you used different weighings, you may have been more successful than with the model portfolio.
Please note that the Guggenheim S&P 500 Equal Weight ETF (RSP) has outperformed the SPDR S&P 500 since the portfolio began in 2003, and it also outperformed the overall portfolio.
Level3 Passive Portfolio
The Level3 Passive Portfolio, based on my book “Investing at Level3” (www.level3investing.com), will continue and will be carried in the AAII Journal within the Model Shadow Stock Portfolio update articles. (See the article in this issue about the Model Shadow Stock Portfolio).
The Level3 Passive Portfolio continues to lag the S&P 500 over the 17 months since its formation (Table 3). This is partly due to the continuing dominance of the mega-cap stocks for the last several years and partly due to the underperformance of the real estate sector. The Vanguard REIT Index ETF (VNQ) is a very conservative real estate fund, which is great defensively but causes it to underperform in an up market. Vanguard is about to change this by including the more aggressive real estate operations that have performed better.
There are several new funds that may make sense for the Level3 Passive Portfolio in the future, such as the Guggenheim SmallCap 600 Equal Weight ETF (EWSC), but their small size and lack of liquidity don’t make these ETFs practical as of yet.
The next coverage of the Level3 Passive Portfolio will be in the January issue with the Model Shadow Stock Portfolio article.
| Type | Fund (Ticker) | Market Cap Size | YTD Return (%) | Annual Return (%) | Fund Assets ($ Mil) | Exp Ratio (%) | Std Dev (36 Mo. Ann’l) (%) | Worst 3-Yr Cal Period (%) | |||
|---|---|---|---|---|---|---|---|---|---|---|---|
| 1-Yr | 5-Yr | 10-Yr | Since 6/30/2003 | ||||||||
| MF | Aston/Fairpointe Mid Cap N (CHTTX) | Mid-Cap | 5.9 | 19.8 | 13.9 | 9.1 | 11.3 | 1,394.9 | 1.12 | 15.1 | -7.9 |
| MF | Fidelity OTC (FOCPX) | Large-Cap | 30.7 | 29.1 | 20.3 | 11.8 | 13.2 | 12,660.4 | 0.81 | 14.8 | -9.3 |
| ETF | First Trust US IPO (FPX) | Large-Cap | 18.7 | 18.4 | 18.0 | 11.1 | nmf | 865.1 | 0.60 | 11.8 | -2.3 |
| ETF | Guggenheim S&P 500 Eq Wt Cons Stpls (RHS) | Large-Cap | 4.1 | 2 | 14.3 | 11.2 | nmf | 472.1 | 0.40 | 9.6 | 2.4 |
| ETF |
Guggenheim S&P 500 Equal Weight (RSP) |
Large-Cap | 11.7 | 15.8 | 14.6 | 8.4 | 10.5 | 13,768.1 | 0.20 | 10.3 | -11.4 |
| ETF | SPDR S&P Insurance (KIE) | Large-Cap | 9.8 | 23.4 | 18.4 | 6.5 | nmf | 819.5 | 0.35 | 11.6 | -13.7 |
| ETF |
Vanguard Mid-Cap Value (VOE) |
Mid-Cap | 10.3 | 15.2 | 15.2 | 8.4 | nmf | 7,709.3 | 0.07 | 10.3 | -12.1 |
| ETF |
Vanguard REIT Index (VNQ)*** |
Large-Cap | 3.5 | 0.4 | 9.5 | 6.0 | 10.2 | 34,117.6 | 0.12 | 14.3 | -11.9 |
| ETF | Vanguard Small-Cap Value (VBR) | Small-Cap | 6.9 | 17.6 | 14.8 | 8.5 | nmf | 11,916.8 | 0.07 | 12.5 | -8.9 |
| Avg of Funds in Actual Model Fund Portfolio* | 11.3 | 15.7 | 15.4 | 9.0 | 11.3 | 9,302.6 | 0.42 | 10.0 | -8.3 | ||
| Actual Fund Portfolio Performance** | 10.4 | 15.6 | 11.9 | 5.9 | 9.0 | — | — | 11.1 | -6.4 | ||
| Optional Investment: | |||||||||||
| ETF | iShares Barclays 1-3 Year Treas Bond (SHY) | Bonds | 0.6 | 0.1 | 0.5 | 1.6 | 2.4 | 11,185.7 | 0.15 | 0.8 | 0.3 |
| Comparison: | |||||||||||
| ETF |
SPDR S&P 500 (SPY) |
Giant-Cap | 14.2 | 18.5 | 14.1 | 7.3 | 9.0 | 241,411.8 | 0.10 | 9.9 | -8.4 |
|
nmf= no meaningful figure Source: Morningstar, Inc. Data as of 9/30/2017. |
|||||||||||
Investment Rationale and Processes
The Level3 Passive Portfolio is intended to be either the complete equity portfolio for those investors who wish to manage their own portfolio, but do not choose to be involved in individual stock selection, or one portion of a whole portfolio for those who may wish to select individual equities and actively managed funds on a limited basis but keep the majority of their portfolio in index funds.
The portfolio consists of index ETFs that should have, based on their approach, returns above that of the S&P 500 index. As a portfolio, it is more diversified than the S&P 500, which should reduce portfolio downturns that are based on the impact of a few sectors.
Portfolio changes should be relatively rare and will occur only when a new or different ETF is felt to be more effective at accomplishing a similar objective than one of the current holdings. There are some new index ETFs with promising approaches, but there will be a period of observation before they can be considered.
Table 2. Model Fund Portfolio Annual Performance
| Average Annual Return (%) | Cumulative Growth of $10,000 ($) | |||
|---|---|---|---|---|
| Model Fund Portfolio |
S&P 500 SPDR ETF (SPY) |
Model Fund Portfolio |
S&P 500 SPDR ETF (SPY) |
|
| 2003* | 18.6 | 15.0 | 11,858 | 11,500 |
| 2004 | 17.7 | 10.7 | 13,955 | 12,735 |
| 2005 | 5.4 | 4.8 | 14,711 | 13,350 |
| 2006 | 16.1 | 15.6 | 17,086 | 15,438 |
| 2007 | 10.2 | 5.4 | 18,820 | 16,268 |
| 2008 | -35.9 | -36.9 | 12,071 | 10,273 |
| 2009 | 24.9 | 26.4 | 15,080 | 12,981 |
| 2010 | 20.3 | 14.9 | 18,136 | 14,914 |
| 2011 | -1.7 | 2.0 | 17,827 | 15,207 |
| 2012 | 12.6 | 15.8 | 20,075 | 17,608 |
| 2013 | 26.7 | 32.2 | 25,436 | 23,279 |
| 2014 | 9.9 | 13.6 | 27,962 | 26,439 |
| 2015 | -4.5 | 1.3 | 26,711 | 26,793 |
| 2016 | 15.3 | 11.8 | 30,807 | 29,957 |
| 2017** | 10.4 | 14.2 | 34,004 | 34,197 |
| Since Inception** | 9.0 | 9.0 | 34,004 | 34,197 |
|
*June 30 to December 31, 2003 **Through September 30, 2017. Portfolio was started on 30-Jun-03 |
||||
Level3 Portfolio Holdings
Four ETFs make up the Level3 Passive Portfolio. The weights of the holdings in the portfolio may change over time based on experience.
A more thorough discussion of the ETFs in the Level3 Passive Portfolio and other new funds that might qualify when they have sufficient volume and history are discussed in my book “Investing at Level3” (www.level3investing.com).
Guggenheim S&P 500 Equal Weight ETF (RSP)
This exchange-traded fund has outperformed the cap-weighted S&P 500 index over the 14 years of its existence. Other indexes also indicate that equal weighting provides higher returns. Equal weighting gives more weight to value stocks and smaller-cap stocks in an index, which leads to superior performance over the long run.
This fund, because of its size and history, is given a portfolio weight of 40%.
PowerShares Russell 1000 Equal Weight ETF (EQAL)
This ETF includes the top 1,000 stocks by capitalization size and gives some exposure to mid-cap stocks. Mid-cap stocks historically have had higher returns than large caps. It is a new fund, however, and uses an innovative approach that needs some observation before comparing it to Guggenheim S&P 500 Equal Weight ETF.
It is weighted at 20% of the portfolio.
Vanguard Mid-Cap Value ETF (VOE)
Mid-cap value has had higher returns than large stocks or mid-cap growth stocks.
It is weighted at 20% of the portfolio.
Vanguard REIT Index ETF (VNQ)
The returns of real estate investment trusts (REITs) have exceeded the returns of the S&P 500 over the long run and provide diversification as well.
This ETF is weighted at 20%.
Table 3. Level3 Passive Portfolio
|
|
Initial Weight | YTD Return % | 1-Yr Return % | Return (%) Since 5/31/2016 |
|---|---|---|---|---|
|
|
||||
| Fund (Ticker) | ||||
|
Guggenheim S&P 500 Equal Weight (RSP) |
40% | 11.7 | 15.8 | 20.8 |
|
PowerShares Russell 1000 Equal Weight (EQAL) |
20% | 10.7 | 14.2 | 19.4 |
|
Vanguard Mid-Cap Value (VOE) |
20% | 10.3 | 15.2 | 22.0 |
|
Vanguard REIT Index (VNQ) |
20% | 3.5 | 0.4 | 5.8 |
| Weighted Avg of ETFs in Portfolio* | 9.6 | 12.3 | 17.8 | |
| Actual Level3 Passive Portfolio** | 9.5 | 12.3 | 17.7 | |
| Comparison: | ||||
|
SPDR S&P 500 (SPY) |
14.2 | 18.5 | 23.3 | |
|
*A weighted average return of the ETFs in the current Level3 Passive Portfolio. For more on the Level3 approach, go to www.level3investing.com. |
||||
Portfolio Management Notes
For the Level3 Passive Portfolio, the initial weightings are as previously indicated and as shown in Table 3. The approach to rebalancing is to keep it to a minimum.
While momentum is less of a factor with funds than it might be with stocks, and transaction costs for funds are much less than for stocks, rebalancing frequently is a distraction and can make taxes a significant consideration.
You should be able to achieve almost all the rebalancing necessary when you add and withdraw funds or when changes are made in the holdings.
Rebalancing decisions will have to be made by the individual since every investor will have added assets at a different time, so everyone’s weights will be different. But the following are some general guidelines:
-
Don’t rebalance any holding unless you have held it for over a year.
-
If a holding is 25% below where it should be with the planned weight, bring it back to the appropriate level by selling some overweighted holdings to provide funds.
-
If a holding is 33% above where it should be with the planned weight, bring it back to the appropriate level by selling the excess and using the funds to buy underweighted holdings.
Discussion
FREE REPORT

John Lambert from NJ posted over 8 years ago:
Ed from Wisconsin posted over 8 years ago:
John Lambert from NJ posted over 8 years ago:
Nitin from WI posted over 8 years ago:
Houyhnhnm from NM posted over 7 years ago:
Richard Kacsur from AK posted over 7 years ago:
Richard Kacsur from AK posted over 7 years ago:
Richard Kacsur from AK posted over 7 years ago:
You need to log in as a registered AAII user before commenting.
Log InCreate an account