



Related

Investing Gurus
Not only have dividend-paying stocks realized higher long-term returns, they also tend to rise prior to and after an interest rate increase.
by John Buckingham | May 2015

Though certainly not as sizable a contributor so far in the 21st century, over time, dividend income and its reinvestment has comprised a significant portion of long-term stock gains.
Even better, over the long term, dividend-paying stocks have delivered relatively better total-return performance than non-dividend-payers and generally have done so with lower volatility. In addition, we believe that dividend payouts are currently all the more attractive, given that yields on competing investments are at historically low levels. And lest folks fret about the timing and magnitude of Federal Reserve tightening, our recent crunching of the historical data reveals that dividend payers perform just fine even in a rising interest rate environment. While not quite the Holy Grail, higher returns, relatively lower risk and generous income can make for quite a powerful combination no matter the direction of interest rates.
Some commentators have been warning that income-producing stocks will not be appealing in a rising interest rate environment. However, such statements ignore the fact that investors actually have been more enthused about non-dividend-paying companies for three years running. S&P 500 stocks without a payout outperformed those with a payout by scores of 14.7% to 13.6% in 2014, 46.5% to 30.9% in 2013 and 20.2% to 15.5% in 2012. Looking at broader market data compiled by professors Eugene F. Fama and Kenneth R. French, the story was similar in two of the last three years. The duo evaluated all New York Stock Exchange (NYSE), American Stock Exchange (AMEX) and NASDAQ stocks, breaking the list down into non-dividend-payers as well as the lowest 30%, the middle 40% and the highest 30% of dividend payers. While non-dividend-payers outperformed in 2012 and 2013, they were a weaker performer in 2014, gaining only 10.0% compared to 9.6%, 15.2% and 10.8% for the low-30%, mid-40% and high-30% dividend payers, respectively. Illustrating that it was a mixed picture for dividend payers last year, the high-yielding utilities sector enjoyed the best return (29.0%) of the 10 S&P 500 sectors, while payout-rich sectors like energy, telecommunications and consumer staples received the least amount of love.
We suspect that few investors are complaining about returns the last three years, dividends or no. And despite those terrific gains, the forward (next 12 months) yield on the S&P 500 is still 2.0%, while the Russell 3000 boasts an annual payout rate of 1.9%, so we would think that dividends would continue to be appealing to the many investors seeking income from their portfolios. This is especially true after non-income-producing and formerly high-flying gold and silver have become a lot less precious, while fixed-income markets have seen volatility pick up even as interest rates rest near historically low levels.
No doubt, numerous folks today are still more concerned with return of capital than return on capital, and they are sitting in the safety of cash and cash-like investments. Of course, deciding to place one’s money into the modern-day equivalent of the mattress allows the chance to earn a whopping two basis points (0.02%) on average in taxable money market funds, according to iMoneyNet.com. Growth of capital is obviously not the objective, but it is amusing that at the current money market rate, cash will double in just 3,467 years!
Others are ‘hiding out’ in U.S. Treasuries, where the yield on the 10-year note is currently hovering around 1.9%, the yield on the 20-year bond is near 2.3% and the yield on the 30-year bond is in the 2.5% range as I write this in April 2015. Considering that inflation has averaged 3% per annum over the past eight decades, those willing to accept the current yields on 10-, 20- and 30-year Treasuries are likely to see a reduction in purchasing power and little in the way of real return if they hold to maturity. And should they wish to cash out prior to 2025, 2035 and 2045, respectively, they risk capital losses.
Looking across the pond, two-year government bonds throughout much of Europe currently have negative or near-zero yields, while Switzerland just cracked the zero barrier with a 10-year bond issuance. And, believe it or not, we recently saw what appeared to be the first instance ever of a corporate bond with maturity of more than one year reach a negative yield when Swiss food giant Nestle’s 500 million euro bond maturing in October 2016 slipped below zero. Certainly, we understand that there are other factors at play in Europe as investors bet on currency movements, deflation and the impact of the European Central Bank’s massive bond-buying program. Also, tremendous sums have poured into passive indexed products, meaning that the managers have no choice but to buy. But reward-free-risk is the observation that comes to our minds, while we would argue that the fact that corporations can borrow at the lowest rates in history bolsters the appeal of stocks.
Clearly, equity investors must continue to steel their nerves for heightened volatility, as concerns remain about the strong dollar and its impact on corporate profit growth, the commodity price collapse, the slowdown in China, the Greek debt drama, the crisis in Ukraine, the age of the bull market and elevated price-earnings ratios. Also, the strength of the global economy is still very much in question, while the Federal Reserve will most likely move to lift interest rates later this year. Nevertheless, relative to Treasuries, dividend yields are about as attractive as they’ve been in more than 50 years. Aside from several months at the height of the 2008–2009 global financial crisis, the last time the yield on the S&P 500 index was as close to the yield on the 10-year Treasury bond as it is today was 1958. And it wasn’t that long ago that stocks yielded more than a few basis points better than the 10-year Treasury.
What’s more, corporations have actually been boosting their payouts, as 381 members of the S&P 500 either raised or initiated a dividend in 2013 and 375 did the same in 2014. And we do not see any reason for that trend to change, as Standard & Poor’s (as of April 2, 2015) estimates that (bottom-up) operating earnings per share will rise from $113.02 in 2014 to $118.37 in 2015 and $134.72 in 2016, while corporate balance sheets continue to be loaded with record levels of cash.
Value stocks (those trading for lower fundamental valuation metrics) are providing even more generous income streams. Breaking down our benchmark Russell 3000 index into its value and growth components, one finds the former sporting a current forward yield of 2.3% compared to 1.4% for the latter. The forward yield of the Dow Jones industrial average is currently 2.3%, so the attractive payouts are also available in components of the most well-known market barometer.
While some may be less enthused about yields on stocks these days, we can’t forget that dividends and their reinvestment have long been a substantial contributor to the total return on equities. Morningstar’s Ibbotson Associates calculated that from 1927 through the end of 2012, the income component amounted to 42% of large-cap stock returns, 36% of mid-cap stock returns and 31% of small-cap stock returns. [Income return data for mid-cap and small-cap stocks was discontinued in 2013. Data through the end of 2014 was not available for large-cap stocks at the time of publication.]
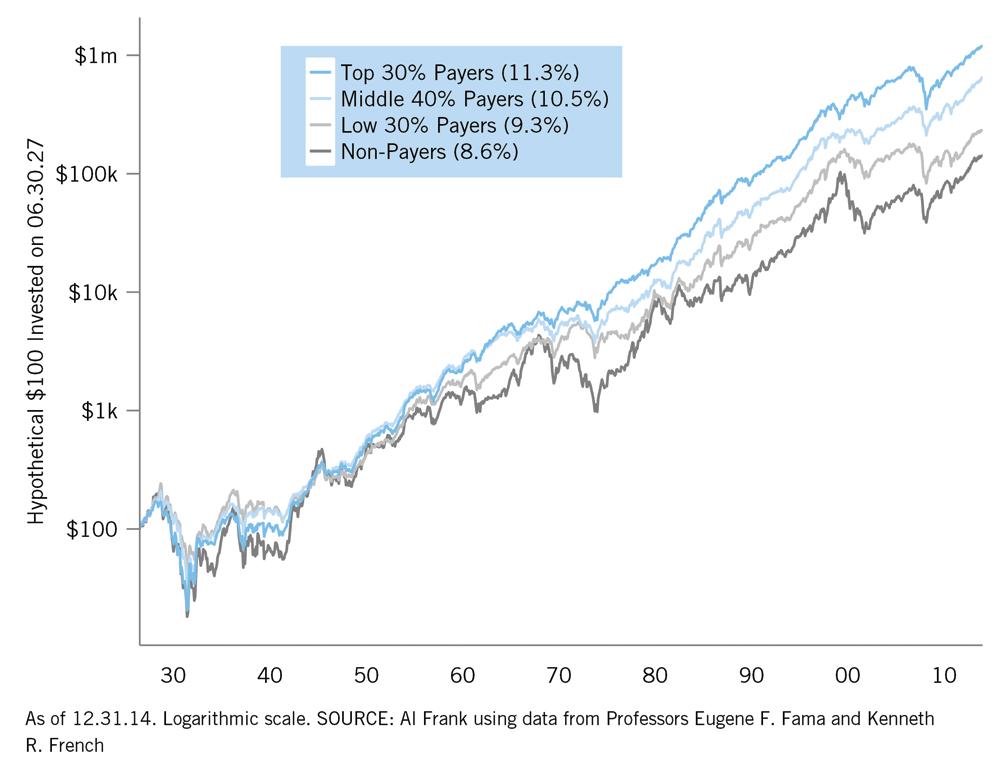
More importantly, freely available numbers we’ve crunched from Fama and French dating back to 1927 show that dividend payers have actually outperformed non-dividend-payers over the long term and they have done so with lower overall volatility. (The data is available on Kenneth French’s website.)
Annualized returns dating back to 1927 using the value-weighted monthly return series from Fama and French for dividend-paying stocks have ranged between 9.3% (the lowest 30%) and 11.3% (the highest 30%) compared to 8.6% for non-dividend-payers, as shown in Figure 1. Interestingly, the higher the dividend yield, the higher the long-term return.
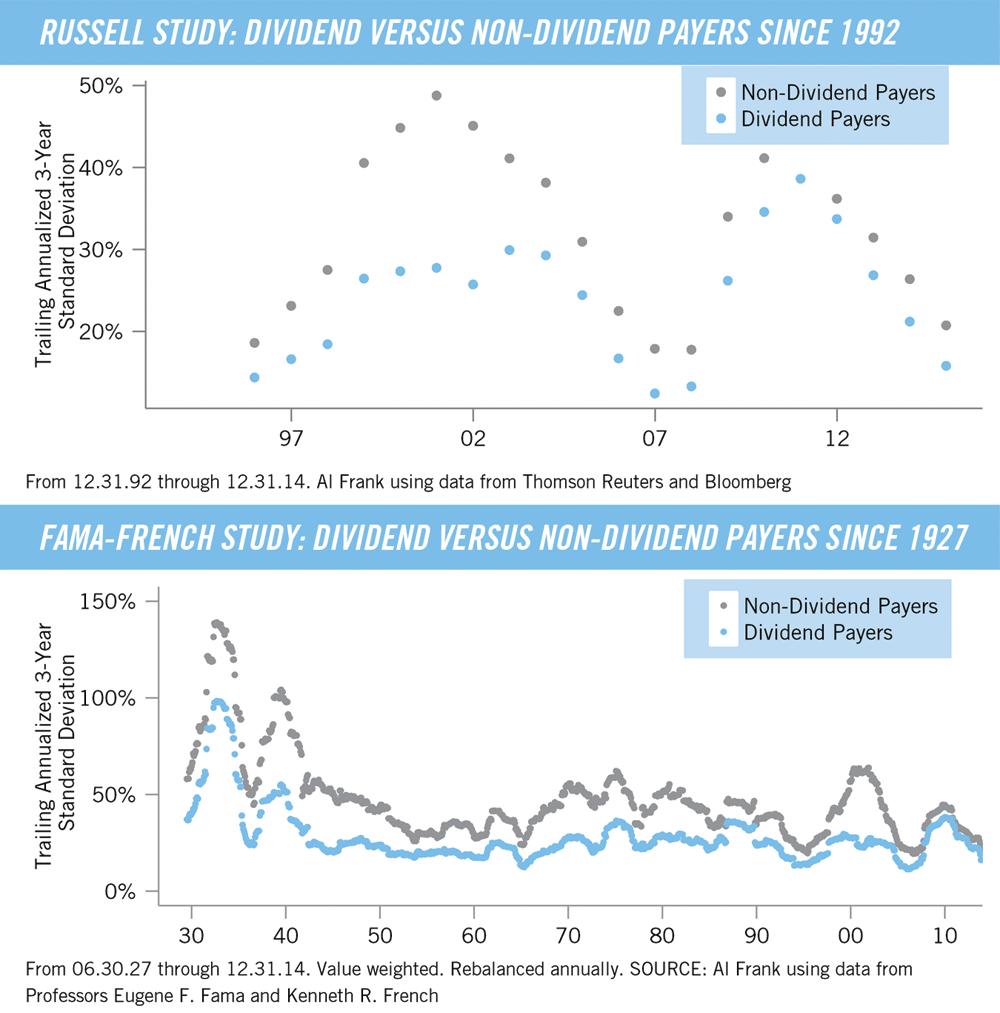
Not simply content to take the word of the good professors, we performed our own calculations looking at returns for the Russell 3000 constituent list since 1992. It is not easy to find accurate historical numbers—companies merge, issue spin-offs and go out of business—but we did our best to divide the Russell 3000 membership into dividend- and non-dividend-paying groups each year on July 31. We then created two sets of return series, the first consistent with each stock’s weighting in the index and the second utilizing an equal-weighted methodology. Interestingly, we found that on a capitalization-weighted basis, non-dividend-payers returned 10.3% per annum, versus 8.7% for dividend payers. No doubt, the tremendous returns of Internet and other computer-related stocks—most of which did not pay a dividend—accounted for much of the outperformance during the tech bubble. However, our research suggests a potential bias around the turn of the millennium that included and heavily weighted many high-flying non-dividend-paying stocks in the Russell while they were rising, but excluded or lightly weighted these companies as they quickly crashed and burned.
Of course, few of us invest on a cap-weighted basis. After all, one would have to own 15 times as much Apple (AAPL) as opposed to Target (TGT) or Caterpillar (CAT) to match the current weights in the Russell 3000. Indeed, since our founding in 1977, we have worked within an equal-weighting framework for our initial purchases. True, over time a big gain in stock X will mean that it outweighs stock Y that has fallen in price, but we find equal weighting to be very germane.
The Russell differences in our equal-weighted study are quite dramatically in favor of dividend payers, as they have enjoyed a 400-basis-point-better total return per annum over the last 23 years than non-dividend-payers. The significant long-term performance advantage of the equal-weighted numbers over the cap-weighted illustrates the opportunities available to even average stock pickers.
Even more important to some, we also reviewed the annualized standard deviation of the trailing 36-month returns for the cap-weighted Russell and Fama-French (combining the dividend payers) data sets to determine the spread of the numbers. Standard deviation is the square root of the variance, with the variance defined as the average of the squared differences from the mean. In simpler terms, the greater the standard deviation, the more volatile the return and the higher the risk that the return will deviate from the norm. As shown in Figure 2, dividend payers, despite their strong return characteristics, have had meaningfully lower standard deviation.
It is hard to argue with the historical evidence that dividend payers deserve a lion’s share of any equity allocation, and we’ve been incorporating dividends into our valuation analytics for a long time now. However, we remain equal opportunity stockpickers and we won’t discriminate against an undervalued company that chooses not to currently pay a dividend. Our long-time holding of Apple, which just initiated a payout in 2012, provides one such example, though we must confess that our recent recommendation of Gilead Sciences (GILD) was made easier when the biotech heavyweight issued a dividend for the first time this year.
We also note that dividend payers do not always outperform non-dividend-payers. There have been many stretches over the past eight decades when the tables have been turned. Interestingly, the periods of underperformance for dividend payers include four of the last five full calendar years, with a significant gap in the returns during 2009. That said, as contrarians, we don’t mind this recent trend, as the long-term evidence overwhelmingly favors dividend payers. Thus the majority of our recommendations offer a dividend yield, which we hope provides a little added comfort in a very uncertain geopolitical and economic environment.
Of course, we do not favor dividend-paying stocks for their yield alone, especially as the aforementioned historical data reveal that only 30% to 40% of the total returns enjoyed by equities have come from income. With capital appreciation accounting for the lion’s share of total return, we seek stocks that trade for inexpensive valuations (low multiples of sales, earnings and book value, as the historical data shows these are also excellent indicators of future price appreciation) first and foremost, with dividends always a secondary factor in our analysis.
With this in mind, we do not simply buy the highest-yielding stocks. Our strategy helped us in 2013, when rich-payout telecom services, utilities and real estate investment trust (REIT) companies were in the weakest-performing industry groups, but hurt us in 2014, when the latter two groups enjoyed gains in excess of 25%. The general underperformance of stocks with a yield over the last three years (in the first quarter of 2015, the 81 non-dividend-payers in the S&P 500 actually outperformed the 419 dividend payers by a score of 5.5% to 0.2%), in our view, suggests that there are reasonable market valuations for companies that return capital to holders via dividends.
Many attribute the latest weakness in relative performance for dividend payers to worries about a possible tightening of monetary policy by the Federal Reserve. Those concerns are interesting given that stock prices managed to survive and thrive despite the May 2013 Taper Tantrum, when then-chairman Ben Bernanke suggested that the Fed would soon start to reduce its massive bond-buying program. QE3, as the third round of quantitative easing stimulus was known, then encompassed purchasing additional agency mortgage-backed securities at a pace of $40 billion per month and longer-term Treasury securities at a pace of $45 billion per month. Likewise, the major equity market averages are nicely higher today even though the Fed did slowly trim QE3 from $85 billion per month in December 2013 all the way down to where it currently just reinvests mortgage-backed security principal payments and rolls over maturing Treasuries.
Alas, many equity market participants missed out on those gains, as fear of the Fed and potentially higher interest rates (ironically, rates are lower today than in December 2013) kept plenty of money sitting on the sidelines. And those investors are unlikely to be feeling better about stocks these days, given that current Fed chair Janet Yellen said in late March 2015, “With continued improvement in economic conditions, an increase in the target range for that [federal funds] rate may well be warranted later this year.”
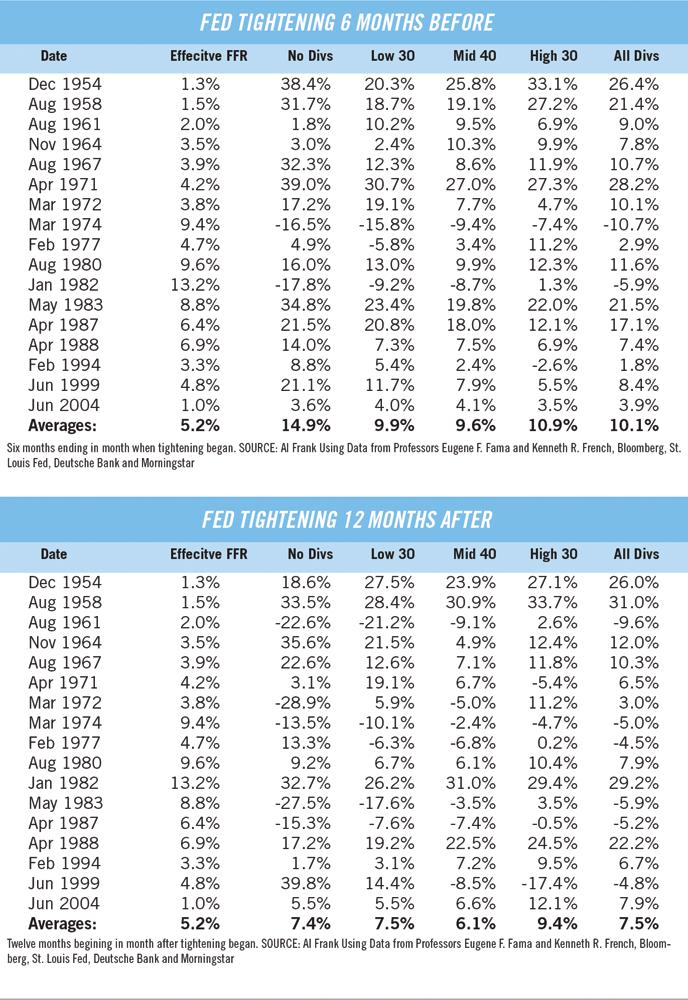
Not surprisingly, the financial press and even the mainstream media have again been busy sounding warning bells, with Time magazine suggesting in its March 19, 2015, edition, “The Fed has initiated a tightening cycle 16 times since the end of World War II. In 13 instances, the market fell in the six months leading up to the rate increase.” Sounds ominous, especially as numbers from the reputable data provider S&P Capital IQ are cited, until one takes a look at what has actually occurred for the full time-spans before and after the Fed has begun to tighten (Figure 3).
We do not mean to infer that equities would rather that rates were rising (even as the stronger economic growth necessary to compel the Fed to move is hardly a negative backdrop for corporate profits), but the number crunching we’ve undertaken (and we have run our data by the good folks at S&P) suggests that one should not believe everything that appears in print. Indeed, stocks have actually gained ground for the full six months prior to the start of Fed tightenings on all but a couple of occasions. The same thing goes for the 12 months afterward. No doubt, there has been plenty of volatility surrounding major Fed policy moves, with sizable short-term losses sometimes suffered by those who can’t stomach the fluctuations (which we are told was the gist of the S&P data), but those who are willing to remain patient have been rewarded more often than not.
Of course, the timing of the first rate increase is very much in question, given that the U.S. economy grew by only 2.2% in the fourth quarter of 2014, with the strong dollar and nasty weather likely to hamper first-quarter 2015 GDP growth. In addition, the Fed’s longer-run goals of maximum employment and inflation of 2% are not currently being met. Consensus estimates for the date of a rate increase have been pushed out to September 2015, but the Fed continuously has stated that any monetary policy moves will be data-dependent, not calendar-dependent.
And lest there be fear that rates will soon spike sharply, Yellen said recently, “The average pace of tightening observed during previous recoveries could well provide a highly misleading guide to the actual course of monetary policy over the next few years.” Also easing worries, the Fed has been very clear that economic conditions may, for some time, warrant keeping the federal funds rate below levels it views as normal in the longer run, while Federal Reserve vice chair Stanley Fischer recently said, “When we raise the interest rate, we will be moving from an ultra-expansionary monetary policy to an extremely expansionary monetary policy.”
We at AFAM Capital do not simply accept conventional wisdom—we do our own homework and crunch our own numbers to ensure that what we believe philosophically actually corresponds to what has proven to be successful from a historical perspective.
Happily, while we always reserve the right to get smarter and we will never rest on our laurels, our long-time emphasis on undervalued dividend-paying stocks is validated by more than eight decades of market history, with handsome average returns enjoyed even in the six months prior to and the 12 months following a Federal Reserve decision to begin to raise interest rates. Indeed, it is nice to see that over the long term dividend-paying stocks on average have outperformed non-dividend-paying stocks and they have done so with lower volatility.
Investing Gurus

Financial Statements
Dividends

Seth from NE posted over 11 years ago:
Erik Wiener from PA posted over 11 years ago:
Dave Gilmer from WA posted over 11 years ago:
Dave Gilmer from WA posted over 11 years ago:
Fernando Robles from FL posted over 11 years ago:
Ken from NC posted over 11 years ago:
Tom Simon from GA posted over 8 years ago:
You need to log in as a registered AAII user before commenting.
Log InCreate an account