


Wayne Thorp leads a class in AAII's new Essential Investing Video Course. Go to https://www.aaii.com/ves for more information and to subscribe.
The price-earnings (P/E) ratio—or earnings multiple—is one of the most popular measures of company value. It is the current stock price divided by earnings per share for the most recent 12 months.
The popularity of the price-earnings ratio stems from how it relates the market’s expectation of future company performance—embedded in the stock price component of the equation—to a company’s actual recent earnings performance.
The price-earnings ratio is primarily driven by stock prices, although earnings also respond to changing business conditions. When greater risk and uncertainty in company prospects are perceived, valuations decline as investors are only willing to pay a small amount for a given level of company earnings. The greater those expectations, the higher a multiple of current earnings investors are willing to pay for the promise of future earnings.
But price-earnings ratios are not across-the-board comparable in terms of value. How, then, do you judge whether a company’s price-earnings ratio represents a good value?
There are models that help gauge whether a company’s price-earnings ratio is reasonable. The price-earnings relative ratio approach looks back at the relationship of the price-earnings ratio of a stock to the price-earnings ratio either of the overall market or of the company’s industry.
What Is the Price-Earnings Relative?
The price-earnings relative is determined by dividing a company’s price-earnings ratio by the market multiple. A price-earnings relative averaging above 1.0 would indicate that a company’s price-earnings ratio is typically above the market’s price-earnings ratio, and vice versa.
Based on relative growth and risk expectations, companies trade at multiples greater or smaller than that of the market multiple. One would expect a company with prospects better than the market, or with lower risk, or both, to have a higher price-earnings ratio than the market. Comparing a firm to its industry is an equally useful technique that has the benefit of isolating interesting candidates within a specific industry.
What Does the Price-Earnings Relative Indicate?
Changes in the relative levels of the price-earnings ratio may signal that the market, for whatever reason, is changing its expectations about the future earnings potential of a firm or losing track of this and mispricing the stock. The price-earnings relative valuation model, however, assumes that the long-term growth and risk profile of the firm has not fundamentally changed over time.
How Is the Price-Earnings Relative Calculated?
Using Stock Investor Pro, AAII’s fundamental screening and research program, “market” price-earnings ratios are calculated for each of the last five years and are then used to calculate annual price-earnings relatives for individual companies for each of the last five years (in order to calculate a price-earnings relative value, a company must have positive earnings). Based on these annual price-earnings relative values, we arrive at a five-year average price-earnings relative value for the company.
Multiplying the average stock price-earnings relative by the market’s current price-earnings ratio provides an adjusted price-earnings ratio. The assumptions behind this model are that the market is fairly valued, which is not always the case, and that the company’s relationship to the market has not changed.
A stock price valuation can be determined by multiplying this adjusted price-earnings ratio by the company’s trailing 12-month earnings per share. Dividing the current share price by the valuation provides a useful screening measure; 1.00, or 100%, indicates that the valuation and current stock price are equal. Figures above 100% point to prices above valuation estimates, while figures below 100% may highlight undervalued companies.
The P/E Relative Screen
AAII has developed a screen based on this price-earnings relative that seeks stocks that have:
- A current stock price below its adjusted-price-earnings-relative valuation;
- Recent upward revisions in annual earnings estimates; and
- Recent increases in annual consensus earnings estimates.
The P/E Relative screen requires that the firms have five years of data and that the earnings be positive for each of the last five years. A price-earnings ratio can only be calculated with positive earnings per share.
Unusually low earnings may also throw off standard price-earnings ratio screens. Short-term drops in earnings due to incidents such as special charges, extraordinary events, or in some cases even recessions may lead to unusually high price-earnings ratios. As long as the market interprets the earnings decrease as temporary, the stock price may not fall as dramatically as the earnings, resulting in a high price-earnings ratio. Because the average price-earnings relative model relies on a normal situation, these “outlier” price-earnings ratios should be excluded.
Screening for stocks by looking at price-earnings ratios can help highlight firms that have fallen out of favor. Price-earnings relatives help establish benchmark comparisons that can identify firms that have deviated from their normal valuation level—with the critical assumption that nothing fundamental to the company, industry or market has changed significantly. The analysis can highlight companies worthy of further analysis given the expectation they will move back to their typical levels.
The P/E Relative Screen Performance
The price-earnings relative screen is built into Stock Investor Pro and can also be found using the A+ Investor service. In addition, the companies passing this screen are posted each month on AAII.com and the performance of these stocks in a hypothetical portfolio is tracked online.
The price-earnings relative screen has outperformed the large-cap S&P 500 index and other broad market indexes since the beginning of 1998. As of August 31, 2022, the P/E Relative screen has a return since inception of 13.7% and over the last five years, it has an annualized return of 9.3%. This compares to the S&P 500, which has a 5.5% return since inception and an 8.1% five-year return.
Figure 1. Performance of the Price-Earning Relative Screen

Overview of Passing Companies in the P/E Relative Screen
The characteristics of the stocks currently matching the price-earnings relative criteria presented in Table 1.
Stocks passing the P/E Relative screen have a lower median price-earnings ratio of 12.1 than the universe of all exchange-listed stocks at 17.0, along with a higher median five-year earnings growth rate of 19.9% than exchange-listed stocks at 12.5%. The stocks passing the screen have a median market capitalization (share price times shares outstanding) of over $5.5 billion. The typical exchange-listed company is trading with a market cap of $564 million. While the stocks currently passing the screen have outperformed the S&P 500 by 11.4% over the last 52 weeks, the typical exchange-listed stock has underperformed the S&P 500 by 13.2% over the same period.
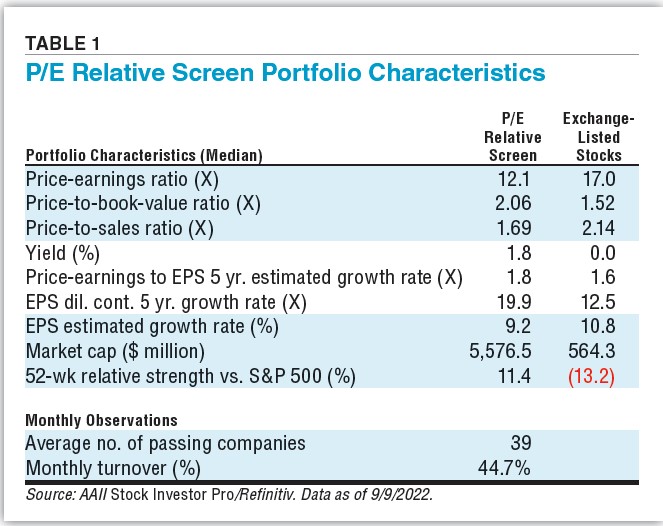
Characteristics of the P/E Relative Screen
Investors often look for a catalyst to help attract attention to a company and boost its stock price. The prices of many attractively priced stocks often languish until investors find a reason to reevaluate the prospects of the firm or its industry.
Upward earnings revisions are events that make investors take notice of a company. Revisions in earnings estimates lead to price adjustments and when earnings estimates are revised upward significantly, stocks tend to show above-average performance. Stock prices of firms with downward revisions tend to show below-average price performance following the adjustment.
The price-earnings relative screen requires at least one upward revision in the current and next year’s earnings estimates over the last month. It also requires that there be more upward revisions than downward revisions in the current and next year’s earnings estimates over the last month. Lastly, it calls for an increase in the consensus estimate for both the current and next fiscal year over the last month.
Intuitively, you may expect that if there has been at least one upward revision and upward revisions outnumber downward revisions, the consensus estimate would automatically increase. However, this is not always the case, as analysts may drop coverage, which could lower the consensus estimate without an actual downward revision.
For a current list of companies passing the P/E Relative screen, please go here. Lists are updated monthly.
Price-Earnings Relative Screen Criteria
Before you decide whether or not to follow or use this specific screen, you have to understand its criteria and what a passing company must possess before being added. Key criteria for the P/E Relative screen are:
- Companies that trade as American depositary receipts (ADRs) are not included
- Companies that trade on the over-the-counter (OTC) market are not included
- The average price-earnings ratio for each of the last five fiscal years is less than or equal to 100
- The current stock price as a percentage of the price-earnings relative valuation is less than 75%
- At least three analysts provide earnings estimates for the current fiscal year (Y0)
- The current consensus earnings estimate for the current fiscal year (Y0) is greater than it was one month ago
- The number of upward revisions in earnings estimates for the current fiscal year (Y0) over the last month is greater than the number of downward revisions in earnings estimates for the current fiscal year (Y0) over the same period
- There has been at least one upward revision in the earnings estimates for the current fiscal year (Y0) over the last month
- The current consensus earnings estimate for the next fiscal year (Y1) is greater than it was one month ago
- The number of upward revisions in earnings estimates for the next fiscal year (Y1) over the last month is greater than the number of downward revisions in earnings estimates for the next fiscal year (Y1) over the same period
- There has been at least one upward revision in the earnings estimates for the next fiscal year (Y1) over the last month
After reviewing the primary criteria for the screen, it’s now time to decide whether this specific strategy fits your individual needs.
Should I Use the P/E Relative Screen to Invest?
Screening for stocks by looking at price-earnings ratios can help highlight firms that have fallen out of favor. Price-earnings relatives establish benchmark comparisons that help identify firms that have deviated from their normal valuation levels—with the critical assumption that nothing fundamental to the company, industry or market has changed significantly. The analysis can highlight companies worthy of further analysis, given the expectation that they will move back to their typical levels.
In constructing screening criteria—especially for value-oriented approaches—you may wish to include a number of conditioning criteria that help indicate items such as the future earnings potential of the firm, the financial strength of the firm, as well as the strength of the firm within its industry. Investing in low price-earnings stocks can be rewarding, but caution is required.
Finally, it is important to keep in mind that stock screening is only the first step in the stock selection process. The stocks passing the price-earnings relative screen do not represent a “recommended” or “buy” list. Due diligence must be performed to verify the financial strength of the companies and to identify those stocks that match your investing tolerances and constraints before committing your investment dollars.
Additional Resources About Using the P/E Relative Screen
If you’re interested in learning more about how to use the P/E Relative screen as well as other metrics to invest, we’ve compiled a few helpful articles you can use to decide what’s best for you and your individual strategy.
This article was originally published in the February 2009 AAII Journal. Click here for a PDF of the original article.

Related

Financial Statements
Introduction to Stock Valuation: The Price-Earnings Ratio
Discussion
FREE REPORT

Get your free copy of our special
report analyzing the tech stocks
most likely to outperform the
market.
No comments have been added yet. Add your thoughts to the discussion!
You need to log in as a registered AAII user before commenting.
Log InCreate an account