


Wayne Thorp leads a class in AAII's new Essential Investing Video Course. Go to https://www.aaii.com/ves for more information and to subscribe.
Return on equity (ROE) is a popular measure of profitability and corporate management excellence. The simplest method of calculation is to divide earnings for the last four quarters (trailing 12 months) by shareholder’s equity. This relates earnings generated by a company to the investment that stockholders have made and retained within the firm. The latter figure—stockholder’s equity—is equal to the total assets of the firm less all debt and other liabilities of the firm and represents investors’ ownership interest in the company. On the balance sheet, it is the sum of preferred stock, common stock, and retained earnings.
| AAII Stock Screens |
| AAII tracks over 50 stock screening methodologies and reports the companies passing each of these screens on a monthly basis. A complete description of the screens, as well as up-to-date performance results, is available at AAII.com in the AAII Stock Screens area. |
Return on (stockholder’s) equity indicates how much stockholders have earned for their investment in the company.
Although ROE can be simply calculated as noted above, it is useful to break it down into several components that are key determinants of a firm’s ROE:
- Net profit margin (net income divided by sales),
- Asset turnover (sales divided by total assets), and
- Financial leverage (total assets divided by common shareholder’s equity).
The net profit margin reflects how efficient a firm is in terms of its operations, administration, financing, and tax management for each sales dollar. The greater and more stable the net profit margin, the greater and more stable will be the earnings generated by the firm. An improvement in profit margin translates into an increase in earnings, assuming sales are held steady.
Asset turnover shows how well a company uses its asset base to generate sales. Poorly deployed or redundant assets result in a low asset turnover that adversely reflects return on equity and profitability.
Multiplying net profit margin by asset turnover produces return on assets, which is essentially return on equity that has not yet been adjusted for financial leverage. In fact, for a company with no liabilities, return on assets and return on equity are equal. A firm can increase its return on assets—and thereby its return on equity—by increasing its profit margin or its operating efficiency as measured by return on assets. Margins are improved by lowering expenses relative to sales. Asset turnover can be improved by selling more goods with a given level of assets. This is why companies divest assets (operations) that do not generate a high degree of sales relative to the value of the assets, or assets with declining sales generation.
When examining profit margins or asset turnover, it is important to consider industry trends and compare how a company is doing within its industry. A supermarket chain, for example, would tend to have low profit margins, but make up for it with high asset turnover.
Finally, financial leverage indicates to what degree the firm has been financed by debt, as opposed to equity. The greater the amount of debt used, the greater the leverage and the financial risk of the firm—but also the greater the return on equity. The risk with high debt levels is that a company will not generate enough cash flow to cover its interest payments during periods of weak financial performance. Debt magnifies the impact of earnings on return on equity during both good and bad years. When large differences exist between return on assets and return on equity, an investor should closely examine the liquidity and financial risk ratios of the firm.
The ideal firm will maintain a high net profit margin, utilize assets efficiently, and do it all with low risk (low financial leverage). The key in working with ROE is examining and understanding the interplay between the determinants of the ratio.
This article introduces a stock screen that focuses primarily on ROE. It seeks companies with:
- ROEs that are consistently above the industry benchmark,
- Financial ratios that are better than their industry benchmarks, and
- Positive growth in sales and earnings that also exceed industry norms.
The specific criteria used for the return on equity screen appear at the end of this article. Stock Investor Pro, AAII’s fundamental stock screening and research database, includes the ROE screen.
|
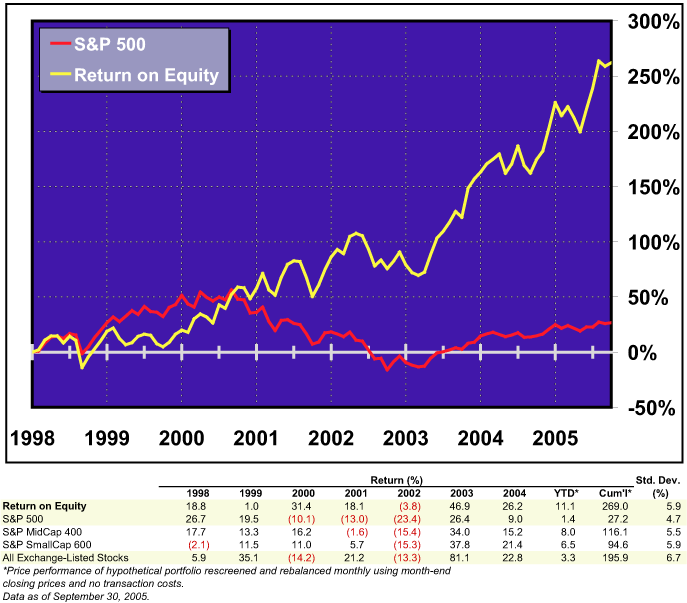
Figure 1 shows the performance of the return on equity screen. The stocks passing this screen have been able to generate positive returns in each year since 1998 except for 2002, although they still managed to outperform the broad market indexes in that year. Overall, the ROE screen has outperformed the small-, mid-, and large-cap indexes over this seven-plus-year period, gaining a cumulative 269.0% between January 1998 and the end of September 2005, compared to a 27.2% increase for the S&P 500. The stocks that passed the screen as of October 7, 2005, have outperformed the S&P 500 by 28.5 percentage points over the last 52 weeks, while the typical exchange-listed stock has only managed to match the S&P over the same period.
The characteristics of the stocks passing the ROE screen as of October 7, 2005, are presented in Table 1. Forty-six companies passed the ROE screen as of October 7, 2005, and the 30 companies with the highest current returns on equity are listed in Table 2 (ranked in descending order by current return on equity). The total number of passing companies exceeds the historical monthly average number of 35. The screen also has a historical monthly turnover rate of 20.1%.
| Table 1. Return on Equity Portfolio Characteristics | ||
| Portfolio Characteristics (Median) |
Return on Equity |
All Exchange- Listed Stocks |
| Price-earnings ratio (X) | 25.9 | 19.7 |
| Price-to-book-value ratio (X) | 4.34 | 2.18 |
| Return on equity (%) | 21.4 | 10 |
| EPS 5-yr. historical growth rate (%) | 28.3 | 10 |
| EPS 3-5 yr. estimated growth rate (%) | 17.5 | 14.5 |
| Market cap. ($ million) | 1,828.10 | 406.7 |
| Relative strength vs. S&P (%) | 28.5 | 0 |
| Monthly Observations | ||
| Average no. of passing stocks | 35 | |
| Highest no. of passing stocks | 52 | |
| Lowest no. of passing stocks | 20 | |
| Monthly turnover (%) | 20.1 | |
Since the ROE screen is growth-oriented, with no value components, it is not surprising that we find that the passing companies have a higher median price-earnings multiple, 25.9, than the typical exchange-listed stock, 19.7. In addition, the median price-to-book ratio of the passing stocks, 4.34, is twice the median value for exchange-listed stocks, 2.18.
Requiring ROEs that exceed the industry median by 50% leads us to a group of passing companies with a current median return on equity of 21.4%, versus 10.0% for exchange-listed stocks. NVR, Inc. (NVR), a homebuilding and mortgage banking company, has the highest current return on equity of 76.8%. At the other end of the spectrum, apparel, accessory, and fragrance designer and marketer Liz Claiborne, Inc. (LIZ), has the lowest ROE for this group at 17.4. Interestingly, however, both of these companies’ current returns on equity are below their five-year average.
Although it is not part of the screen described here, you may wish to analyze the year-to-year trend in ROE to see if it is improving or declining. This underlines an important aspect of ratio analysis. It is important to remember, however, that meaningful analyses of ratios such as this are done by comparing company data to historical trends and industry or sector norms.
Beyond the ROE criteria, this screen’s growth focus is captured with its requirements that 12-month and five-year earnings and sales growth rates not only be positive but also exceed industry norms. As a result, the median five-year earnings growth rate for the ROE screen is 28.3%, compared to 10.0% for all exchange-listed stocks. Ultra Petroleum Corp. (UPL), an oil and gas exploration and development company, has seen its earnings per share grow at an annualized rate of 137.1% over the last five years—growing from a $1.6 million loss in 1999 to a $109.1 million profit in 2004.
In addition, analyst expectations of growth for these companies exceeds those for all exchange-listed stocks—the median estimated earnings growth rate for those companies passing the ROE screen, 17.5%, is higher than that of all exchange-listed stocks, 14.5%.
As discussed earlier, ROE is influenced by profitability, efficiency, and leverage. While the ROE screen attempts to isolate companies with consistently high return on equity, it also makes use of secondary filters to weed out firms with high levels of debt relative to assets, low profit margins, and low asset turnover.
Table 2 presents the current company values and industry medians for two of the components of ROE—net profit margin and asset turnover.
| Table 2. Companies Passing the ROE Screen | ||||||||||
| Company (Exchange: Ticker) |
Return on Equity |
Net Margin | Asset Turnover |
EPS Grth 5 Yr (%) |
Sales Grth 5 Yr (%) |
Description | ||||
|
Co. 12- Mo (%) |
Ind. 12- Mo (%) |
Co. 5- Yr Avg (%) |
Co. 12- Mo (%) |
Ind. 12- Mo (%) |
Co. 12- Mo (%) |
Ind. 12- Mo (%) |
||||
| NVR, Inc. (A: NVR) | 76.8 | 12.7 | 82.1 | 12.6 | 2.5 | 2.5 | 1.3 | 49.9 | 16.6 | homebuilding, mortgage banking |
| USANA Health Sciences (M: USNA) | 67.6 | 12.2 | 44.8 | 11.8 | 1.6 | 3.8 | 1.3 | 46.3 | 15.2 | nutrition, care prods |
| Ultra Petroleum (A: UPL) | 52 | 13.9 | 31.1 | 43.2 | 12.5 | 0.6 | 0.4 | 137.1 | 121.9 | oil & gas |
| Graco Inc. (N: GGG) | 49.70 | 10.2 | 51.8 | 17.5 | 2.2 | 1.7 | 1.3 | 12.5 | 6.1 | manufacturing prods |
| Eaton Vance Corp. (N: EV) | 42.9 | 14.4 | 37.7 | 26.6 | 9.3 | 1 | 0.6 | 56.4 | 13.3 | investment adviser |
| KOS Pharmaceuticals (M: KOSP) | 33 | -35.9 | 40.3 | 24.5 | -48.5 | 1 | 0.4 | 26.4 | 68.8 | prescription prods |
| SCP Pool Corp. (M: POOL) | 31.5 | 10.4 | 28.6 | 5.4 | -0.9 | 2.5 | 1.2 | 28.7 | 18 | swimming pool prods |
| FactSet Research Sys (N: FDS) | 30.1 | 9.4 | 28.8 | 23 | 0.2 | 1 | 0.9 | 23.6 | 18.4 | financial database info |
| Gilead Sciences (M: GILD) | 29.9 | -35.9 | 6.4 | 35.6 | -48.5 | 0.7 | 0.4 | 49.5 | 51 | biopharmaceutical co |
| M.D.C. Holdings (N: MDC) | 29.9 | 12.7 | 26.8 | 10 | 2.5 | 1.6 | 1.3 | 31.7 | 20.7 | homebuilding, financial servs |
| Meritage Homes (N: MTH) | 29.7 | 12.7 | 30.4 | 7.2 | 2.5 | 1.7 | 1.3 | 43.7 | 42.9 | single-family homes |
| Lennar Corp. (N: LEN) | 28.5 | 12.7 | 26.4 | 9.3 | 2.5 | 1.4 | 1.3 | 35.2 | 27.5 | homebuilding, financial servs |
| Cognizant Tech. Solutions (M: CTSH) | 26 | 5.8 | 27.7 | 17.3 | -4.2 | 1.2 | 0.8 | 50.4 | 45.8 | custom IT servs |
| C.H. Robinson Worldwide (M: CHRW) | 25.8 | 8.1 | 24.3 | 3.4 | 2.4 | 4.4 | 2 | 20 | 13.9 | freight transport & logistics |
| Quality Systems (M: QSII) | 25.8 | 5.8 | 17.2 | 18.5 | -4.2 | 0.9 | 0.8 | 44.3 | 19.6 | healthcare info sys |
| Biomet, Inc. (M: BMET) | 25.6 | 7.7 | 22 | 20.3 | 1 | 0.9 | 0.8 | 16.1 | 15.3 | surgical, therapy prods |
| Plantronics, Inc. (N: PLT) | 25.1 | 1.1 | 32 | 16.8 | -3.3 | 1. 2 | 0.9 | 9.2 | 12.6 | communications headsets |
| Ansoft Corp. (M: ANST) | 24.9 | 5.8 | 4.1 | 15.2 | -4.2 | 1.1 | 0.8 | 111.7 | 15.1 | design software |
| Harman Int’l Industries (N: HAR) | 22.5 | 2.2 | 16.3 | 7.7 | -0.6 | 1.4 | 1 | 26.8 | 12.6 | audio & video prods |
| Travelzoo Inc. (M: TZOO) | 22.5 | 9.4 | 64.4 | 17.7 | 0.2 | 1.1 | 0.9 | 104.8 | 102.1 | Internet media co. |
| Thor Industries, Inc. (N: THO) | 22.1 | 5.6 | 19.1 | 4.8 | 1.2 | 3.2 | 2.3 | 24 | 21.5 | RVs, buses, motor homes |
| Fastenal Company (M: FAST) | 21.8 | 11.9 | 19.2 | 10.8 | 2.6 | 1.8 | 1.4 | 15 | 14.9 | indust & construct supplies |
| Biosite Inc. (M: BSTE) | 21.4 | -35.9 | 14.5 | 18.4 | -48.5 | 0.9 | 0.4 | 100.8 | 41.2 | med diagnostic prods |
| Guitar Center (M: GTRC) | 21.4 | 11.3 | 20.4 | 4.2 | 1.9 | 2.7 | 1.9 | 25.2 | 19.5 | retail music equip |
| Lifeline Systems (M: LIFE) | 19.3 | 1.1 | 12.7 | 13.7 | -3.3 | 1.1 | 0.9 | 34.4 | 13 | emerg response servs |
| Mikron Infrared (M: MIKR) | 18.5 | 8.4 | 11.7 | 8.2 | 4.8 | 1.4 | 0.9 | 40.1 | 29.6 | infrared instruments |
| Balchem Corp. (A: BCP) | 18.2 | 11.3 | 20.2 | 12.8 | 3.5 | 1.1 | 1 | 20.6 | 17.8 | performance prods |
| NVIDIA Corp. (M: NVDA) | 17.8 | 0.3 | 18.9 | 9.5 | -2.1 | 1.4 | 0.7 | 12 | 39.9 | computer prods |
| Canterbury Park Holding (A: ECP) | 17.5 | 9.5 | 16.5 | 6.6 | -7.8 | 1.9 | 0.6 | 48.8 | 22 | racetrack, wager servs |
| Liz Claiborne, Inc. (N: LIZ) | 17.4 | 5.2 | 19.9 | 6.6 | 1.8 | 1.6 | 1.4 | 13.2 | 10.5 | apparel, accessories |
|
Exchange Key: N=New York Stock Exchange, A=American Stock Exchange, M=NASDAQ National or NASDAQ Small Cap Market.
Source: AAII’s Stock Investor Pro / Reuters Research Inc. Data as of 10/7/2005. |
||||||||||
No matter how well a stock screening methodology has performed (or underperformed) over the long term, it is important to realize that stock screening is only the first step in the stock selection process. The stocks passing the ROE screen do not represent a “recommended” or “buy” list of stocks. It is important to perform due diligence to verify the financial strength of the passing companies and to identify those stocks that match your investing tolerances and constraints before committing your investment dollars.
| What It Takes: Return on Equity Screen Criteria |
|
Discussion
FREE REPORT

No comments have been added yet. Add your thoughts to the discussion!
You need to log in as a registered AAII user before commenting.
Log InCreate an account