


George Pearson thinks he had a pretty good year last year. He saw his portfolio grow from $260,000 at the beginning of the year to $356,714 by year-end. But part of that growth was due to a fairly large addition to his portfolio—$50,000 he received from a small inheritance mid-year. He also made a series of withdrawals—$1,200 each quarter—and he added $5,000 to his portfolio toward the end of the year.
So, how did he really do? What George needs to do is to figure out the return on his portfolio.
What’s in a Return?
An investor’s total portfolio return consists of the change in value of the portfolio, plus any income provided by the portfolio during the investment period. Translating this into an equation, assuming no additions or withdrawals, is relatively simple; it compares the ending value to the beginning value to determine a percentage change in value:

Using the equation for George’s portfolio results in a 37% increase in value. But for George’s situation, this is misleading—although his portfolio did increase 37% last year, a good part of that was due to his own cash infusion into the portfolio. This equation, then, does not answer his question concerning how well his invested assets performed.
The most accurate measure of portfolio performance is the internal rate of return, also known as the compound return. This provides the actual return that the portfolio received over a certain time period, taking into consideration all “cash flows” and their timing. How do cash flows affect the return?
Money added to the original investment is not part of the investment’s return, but anything the addition earns is part of the return. For example, if you add $1,000 to a portfolio at the beginning of the year, it works for you (or against you, if the investment sours) for a longer time than if you were to put it in at the end of the year; yet in both situations, you have added the same amount—$1,000—to the same original portfolio value.
The formula for determining a compound total return is too complex to do by hand. Instead, a financial calculator or computer is needed; many financial software programs exist to help investors accurately determine their return.
George, however, doesn’t have a computer or financial calculator. How can he measure his portfolio return? There are several measures George can use to determine an approximate return on his portfolio.
The Approximation Method
One approach is to use the approximation formula. It is relatively simple and reasonably accurate—close enough to make an informed decision. The information needed to perform the calculation is contained in brokerage and mutual fund statements.
The return calculation compares ending values to beginning values and adjusts for net additions or withdrawals by subtracting 50% of net additions from the ending value and adding 50% to the beginning value. The 50% adjustment to both the beginning and ending values creates a midpoint average for the cash flows no matter when they were actually made. The equation is more accurate when additions and withdrawals are relatively periodic and are not large (greater than 10%) relative to total portfolio value.
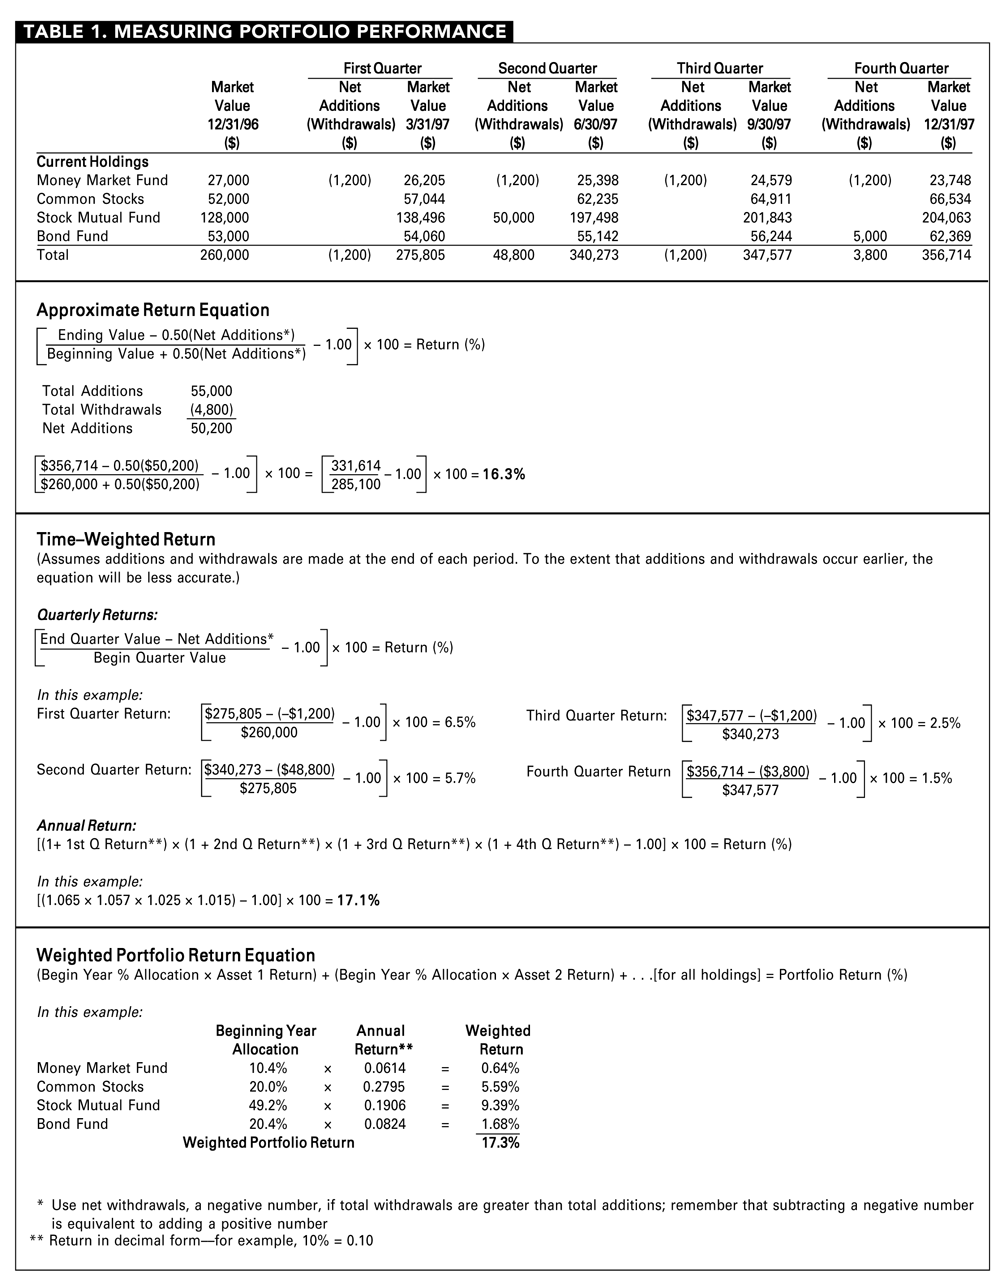
Table 1 illustrates the equation for George’s portfolio: Half of his net additions of $50,200 are subtracted from the $356,714 ending value, and half are added to the $260,000 beginning value; dividing the adjusted ending value by the adjusted beginning value and subtracting 1.0 results in a portfolio return of 16.3%. That compares to an internal rate of return (IRR) for the portfolio of 16.5% (the IRR calculation was performed using Captool, a popular portfolio management program).
In this example, George’s net additions of $50,200 represent a substantial portion of his total portfolio value. However, the bulk of the addition—$50,000—occurred mid-year, so the approximate return equation is relatively close to the more accurate internal rate of return figure. If George’s $50,000 addition had occurred at a different time, the approximation equation would be less accurate.
Time-Weighted Returns
Another measure of portfolio performance, particularly useful when large additions or withdrawals are made, is to determine the time-weighted return.
This method is relatively straightforward: Returns are determined for each subperiod up to the point in time when the addition or withdrawal occurs, and for the subperiod after the addition or withdrawal. These subperiod returns are then linked together (compounded) to produce a total return for the overall period. To link together the subperiod returns, you simply add 1.0 to each subperiod return (in decimal form), and multiply all the subperiod factors. This approach is illustrated in Table 1.
The most accurate time-weighted return would be one in which the subperiods are based on the portfolio value on the days in which the actual addition or withdrawal occurred. In practical terms, this may be difficult for many investors, since brokerage and mutual fund statements provide only end-of-month valuations. As an approximation, you can assume that the addition or withdrawal occurred at the end of the month. Make sure, however, to exclude the cash addition or withdrawal from the ending portfolio value of the subperiod in which the addition or withdrawal occurred, and include the addition or withdrawal in the following subperiod’s beginning portfolio value.
Confused? The example in Table 1 illustrates George’s time-weighted return using quarterly subperiods, and assumes that the additions and withdrawals occurred at the end of each quarter. For example, at the end of the first quarter, George withdrew $1,200, and had an end-quarter portfolio value of $275,805. To determine his first-quarter return, he assumes the withdrawal has not yet occurred (he adds it back in), so that his first-quarter ending portfolio value is $277,005. He divides this by his beginning-quarter portfolio value of $260,000, subtracts 1.0, and determines a first-quarter return of 6.5%.
For the second-quarter return, his beginning value takes into consideration the $1,200 first-quarter cash withdrawal—$275,805, while his end-of-quarter value excludes the net additions that occurred at the end of the second quarter.
Linking the four quarterly returns produces a time-weighted return of 17.1% in George’s portfolio, as shown in Table 1.
Why the difference between George’s time-weighted return and his compound total return?
The time-weighted return excludes the timing influence of the cash flows. This is particularly important when comparing the decision-making abilities of whoever is managing the portfolio’s assets. For instance, assume you start out the year with $100,000 in a portfolio of stocks, and you are able to add $5,000 to this portfolio during the year. If you add the money at the beginning of the year, your end-of-year amount would be different than if you added it later in the year, and it would depend on returns over different time periods. However, the difference in the year-end amounts would not be due to your stock-picking ability, but rather to the timing of the additional funds.
In George’s situation, part of his assets (the addition) were invested for only part of the year in which returns were positive in all quarters. The compound return on his assets of 16.3% reflects the impact of the timing of this cash flow on his invested assets, while his time-weighted return of 17.1% excludes the impact of the cash flow.
Weighted Portfolio Returns
Another approach to portfolio measurement is to measure the total by measuring the components—a weighted portfolio return.
This approach is relatively straightforward (see Table 1), assuming you can get the total return of your portfolio components from published sources, or from your brokerage account statement for individual stock holdings, and assuming you haven’t made significant additions or withdrawals. First, you determine the percentage of the portfolio represented by each holding at the beginning of the year. For example, George’s beginning-year portfolio was composed of: 10.4% in a money market fund; 20.0% in individual stocks; 49.2% in a stock fund and 20.4% in a bond fund.
These percentage holdings at the beginning of the period are multiplied by the return for the holding over the period to determine a weighted return. For instance, George’s stock fund returned 19.06% for the year, and represented 49.2% of his portfolio; the fund therefore contributed 9.39% (49.2% × 0.1906) to his overall portfolio return during the year.
Adding up the weighted component returns provides the total portfolio return. The result for George’s portfolio is 17.3%.
Which One is Right?
Can returns that are 1% apart for the same portfolio both be right?
The answer is no, but sometimes one may be more appropriate to use depending on your circumstances and what exactly it is that you are trying to measure.
A mutual fund’s reported return is an internal rate of return—a compound total return. That’s because the timing of cash flows into and out of the fund will have an impact on fund performance and individual shareholders.
Investment managers, on the other hand, are required to use time-weighted returns when reporting their performance for individual accounts. That’s because a prospective client needs a measure of the decision-making ability of the manager that excludes the effect of cash inflows and outflows that are beyond the manager’s control.
Here are some guidelines about which to use when measuring your portfolio:
-
If cash inflows and outflows to your portfolio are not substantial (the net amounts represent less than 10% of the total portfolio value), all of the approaches will provide similar returns.
-
If cash inflows and outflows are substantial, and you want to determine how well your invested assets performed—in other words, how much your money earned for you during the year—you should use a calculator or computer program that can perform an internal rate of return calculation.
-
If cash inflows and outflows are substantial and you want to measure your success as a decision-maker—how well did your selection of assets perform relative to a benchmark portfolio or another manager—use the time-weighted return equation, or its approximation, the weighted portfolio return.
-
If you want to brag to friends about how well your portfolio did—use whichever return is higher.
This article was written by Maria Crawford Scott for the April 1998 issue of the AAII Journal. At the time, Crawford Scott was editor of the AAII Journal.
Discussion
FREE REPORT

Charles B. from TX posted over 7 years ago:
Patrick D. from CA posted over 7 years ago:
Bill from HI posted over 7 years ago:
John K. from Texas posted over 7 years ago:
Jean from AAII posted over 6 years ago:
You need to log in as a registered AAII user before commenting.
Log InCreate an account