


According to the Investment Company Institute’s Fact Book, in 2013, there were 7,707 mutual funds in the U.S.
This is more than the current number of stocks listed on the NASDAQ, NYSE and Amex exchanges. [Editor’s note: As of March 7, 2015, there were slightly under 5,000 stocks listed on the major exchanges according to AAII’s Stock Investor Pro database.] It is not trivial to select a stock for your investment portfolio. It is even less non-trivial to choose a fund that invests in a portfolio of stocks.
There is, however, a big difference between stocks and mutual funds when it comes to picking a winner based on observable characteristics. Stock prices promptly adjust to information. If there is an observed characteristic that predicts higher performance, the stock price will rise immediately and thus eliminate any profit that could be had from investing in the stock. The information is already in the price.
However, investors can take advantage of an observed characteristic that predicts higher fund performance. As long as the fund keeps its strategy unaltered, and as long as the observed characteristic predicts good performance, investors will benefit by investing in the fund. True, in the long run, if the fund becomes very large, it may be less flexible and its advantage will be eroded. But this takes time; meanwhile, the fund investor can enjoy overperformance.
Here enters our research, “Mutual Fund’s R2 as Predictor of Performance” (Review of Financial Studies, March 2013). We studied all actively managed stock mutual funds that invest at least 75% of their holdings in stocks. For each fund, we conducted a regression of its monthly returns (in excess of the risk-free rate) on the four factors that are due to Eugene Fama and Kenneth French (“Common Risk Factors in the Returns on Stocks and Bonds,” Journal of Financial Economics, 1993) and Mark Carhart (1997): Market, size, value and momentum. This generated alpha, the excess fund return, and R2 (or R-squared), the fraction of the total variability in the fund’s return that is explained by the variability of the four factors. (See the box here for the formulas we use to estimate R-squared.) R-squared will be lower when the stock weights in the fund’s portfolio deviate more from the weights of these stocks in the benchmark factors, or when altogether the fund’s investment does not emulate the stock portfolios that represent these factors. The closer R-squared is to 100%, the more of the fund’s return that can be replicated by simply holding the four benchmark factors. These factors are related to traded indexes, and an investor can invest in them through low-cost exchange-traded funds ETFs. The market factor can be replicated by holding the market portfolio (e.g., an S&P 500 ETF). The size factor is related to going long small-cap index and short large-cap index, the value factor is related to going long value and short growth stocks, and the momentum factor is related to going long winners and short losers. These indexes are constructed mechanically.
We found that many funds are “closet indexers:” Half of them have R-squared of 93% and above. Many funds have R-squared of 98% and 99%, meaning that they basically track the indexes. Many funds practically index most of their holdings and use discretion with a very small part of their net asset value, yet they charge management fees as if they were active funds.
Our main finding: Funds with past high alpha and low R-squared overperform.
Low R-squared suggests greater selectivity by the fund manager. That is, the fund employs strategies that distinguish its investments from those captured by common benchmark indexes. R-squared is effectively one minus the ratio of the fund’s tracking error relative to the total variation in the fund return. Higher R-squared means that a smaller share of its variability is due to tracking error and more is due to the indexes the fund emulates.
The Formulas for Measuring Performance
The model for calculating the four factors identified by Eugene Fama and Kenneth French is:
(Ri-Rf)t=alphai,t+βrm,t(RM-Rf)t + βsmb,tSMBt + βhml,tHML + βumd,tUMD + εi,t .
Where:
Ri,t is net (after expenses) fund i month t return;
Rf is the risk-free (Treasury bill) rate;
RM, SMB, HML and UMD are, respectively, the returns on the market, small-minus-big portfolio, high-minus-low book-to-market stocks portfolio, and up-minus-down stocks portfolio, respectively;
alphai,t is risk-adjusted fund i return for month t;
βrm, βsmb, βhml and βumd are factor loading on market, size, value and momentum premiums respectively; and
εi,t is an error term.
R-squared (R2) is estimated from this regression. We estimate this model by regressing funds historical monthly returns on the four benchmark portfolios using 24-month rolling window.
Our measure of selectivity is:

RMSE is the idiosyncratic volatility—the volatility of the residual from the above regression—and SystematicRisk2 is the return variance that is due to the benchmark factors’ risk. Selectivity is greater if the fund’s idiosyncratic volatility is higher relative to its total variance, meaning that the fund’s volatility is less driven by factor-based (systematic) volatility.
R-Squared versus Active Share
We pause and compare R-squared to another measure, Active Share (AS), proposed by Martijn Cremers and Antti Petajisto in the Review of Financial Studies (“How Active Is Your Fund Manager? A New Measure That Predicts Performance,” September 2009). AS is the sum of absolute deviations of the fund’s weights of holdings in various stocks from the weights of these stocks in the index portfolio that is the fund’s benchmark index. Indeed, higher AS is related to lower R-squared, but they are far from being the same.
Suppose that a fund declares the S&P 500 as its benchmark index, and then passively invests part of its holdings in the Russell 2000 small-cap growth index, which is riskier than the S&P 500 and on average generates higher return. This fund will exhibit high AS because it deviates from its benchmark index, but in fact it is a passive fund. It invests in passive ETFs and charges a fee as if it were active. Our R-squared measure will be close to 100% and will thus correctly identify this fund as passive. Its gross return alpha will be zero and its net (net-of-expenses) alpha will be negative.
The question boils down to what is meant by a fund being “active.” If it includes passive investment in indexes that deviate from the benchmark index, then AS reflects fund activity properly, whereas R-squared does not. But if active management means selecting individual stocks that outperform any passive index investing, R-squared captures that better than AS. R-squared close to 100% tells investors that the fund’s investment strategy can be replicated by investing in passive indexes (e.g., ETFs), usually for much lower cost.
R-squared is also a good measure to estimate the extent of selectivity of funds that invest in more than one asset class and have mixed investment strategies, meaning funds that invest in both stocks and bonds. We can regress its return on both stock and bond index returns and thus measure to what extent it deviates from passive investment in these indexes.
In addition, R-squared is easy to calculate from readily available fund return data, whereas AS is calculated from portfolio holdings, which requires more data.
Finally, AS and R-squared treat the return correlation between index stocks and stocks that replace them in the fund’s portfolio differently. When an index stock is replaced by another stock, AS rises regardless of the correlation between the returns on these two stocks (e.g., regardless of whether the two stocks are from the same or different industries), whereas the change in the value of R-squared depends on this correlation. The question then is whether active management means deviation from the benchmark’s stock composition or deviation from the characteristics of the stocks that comprise the index. Each measure answers this question differently.
Measuring Portfolios’ Performance on R-Squared and Alpha
Our strategy is to invest in funds with low past R-squared and high past alpha. How does this strategy perform using past data? We analyzed all actively managed stock funds between 1990 and 2012. We eliminated index funds and removed closet indexers and rogue investment funds (trimming top and bottom 0.5% by R-squared). We ended up with 3,409 active equity funds that have at least 75% of their holdings in U.S. common equity. (Not all funds survived over the entire period). The average net (after expenses) annualized alpha (the excess return attributed to the manager’s skill) is –0.88%. Thus, on average, after paying expenses, investors who leave their money with mutual funds lose approximately 1% per year compared to investment in the benchmark indexes (if such an investment were costless). If we add expenses back to the returns and recalculate the alpha, then we get a positive alpha of 0.38% per year, which is, however, statistically insignificant.
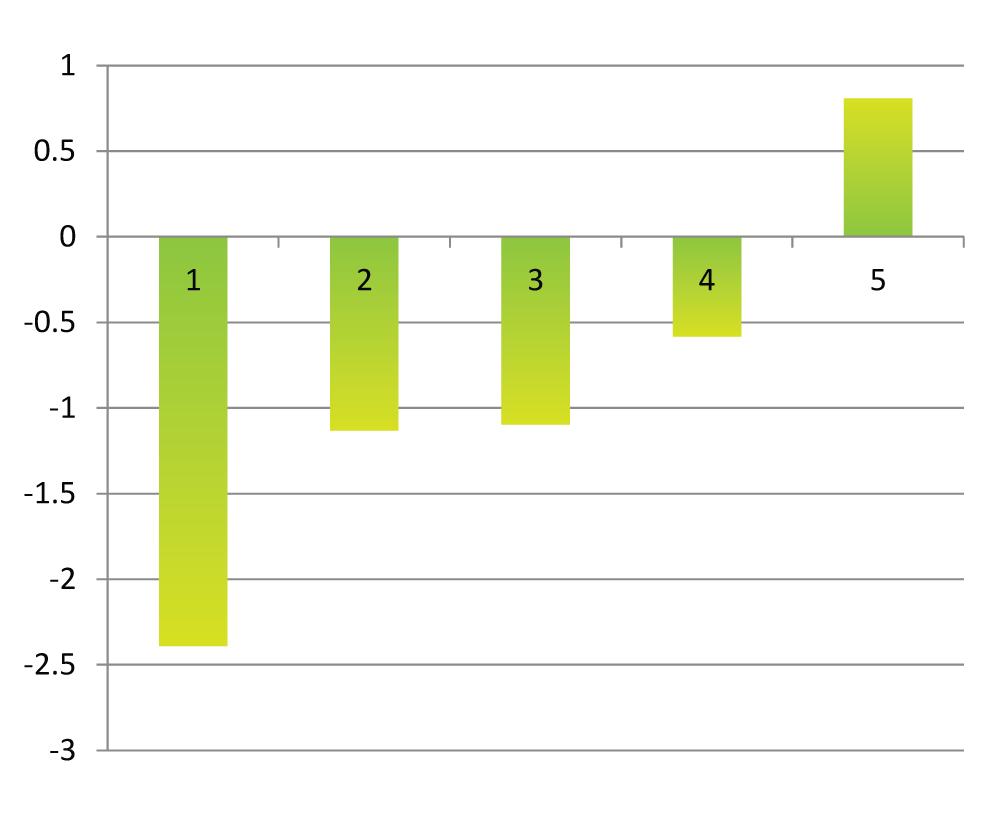
Now, assume you invest in funds by their past alpha and rebalance your portfolios monthly. Every month, which we label “(t-1),” we sort all funds into five portfolios based on their alpha in the preceding 24 months with portfolio 5 containing the highest alpha funds, and then compute risk-adjusted average portfolio of funds return for the next forthcoming month “(t).” Figure 1 presents the results.
Portfolio 5, the highest alpha portfolio of mutual funds in month (t-1), retains the highest performance in month (t) with the annualized-after-expenses alpha of 0.81%. Though positive, it is still statistically insignificant. Thus, if you are actively chasing funds with high alpha this month, on average they will only break even next month, and again you will not gain abnormal profits. But poorly performing funds continue to perform poorly. On average, about 60% of all funds have significantly negative performance.
Very often industry professionals refer to tracking error as a measure of fund selectivity. Higher tracking error suggests higher deviation from fund’s benchmark. It usually implies that a manager makes more selective bets, and as a result is expected to deliver higher future performance.
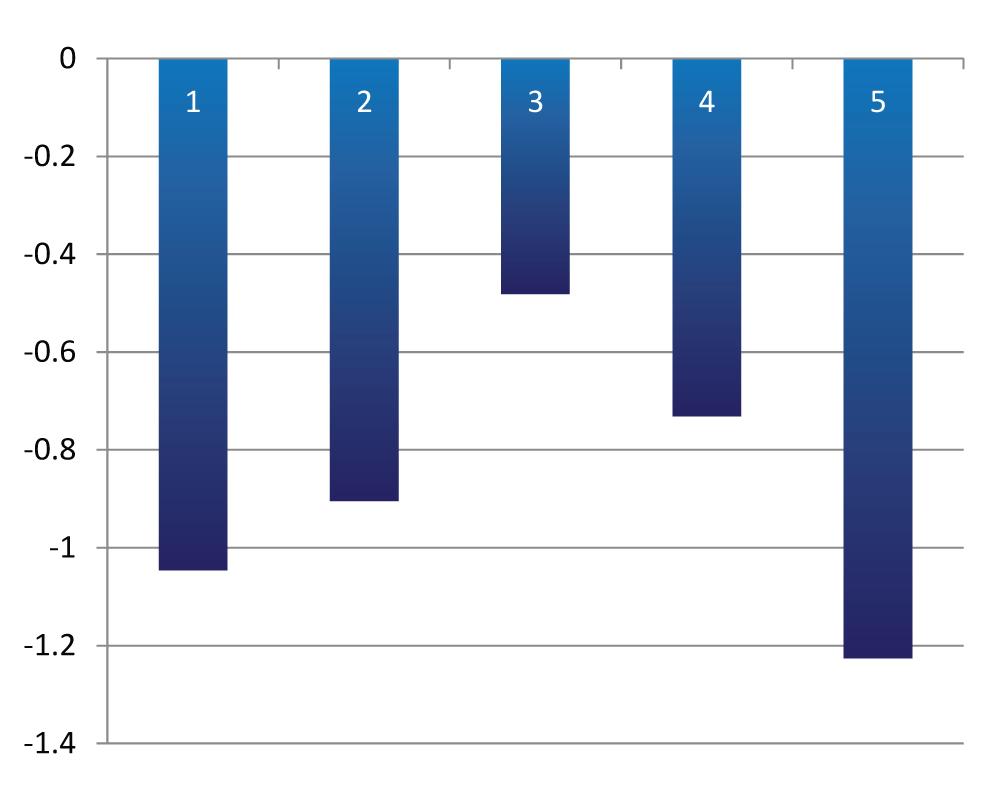
The same exercise as above is repeated, only instead of alpha (t-1), we sort funds into portfolios grouped on funds’ idiosyncratic variances, which are not attributed to the variance of four systematic factors or benchmark indexes described above. In other words, we created quintile portfolios of funds based on root mean squared error, which is a measure of tracking error from our benchmark model. The results are shown in Figure 2.
As can be seen, tracking error works worse than simple past historical alpha. There is no monotonic relationship between past tracking errors and expected next period performance. Moreover, the premise that higher tracking error should be accompanied by higher returns is not quite right: Higher tracking error seems to lead to lower returns.
Identifying Good Fund Managers Who Invest Differently
How do we identify managers who do well on stock picking and deviate from investing into standard benchmarks?
Normally, when a fund delivers positive abnormal performance, it experiences a high inflow of funds due to investors rushing to invest with a “star” manager. However, as Figure 1 shows, on average the best performance does not persist. There are few reasons for this. One reason is that a fund manager may have made a risky bet and it paid off, (e.g., he or she got lucky). Similar to a casino gambling experience, you might not expect the luck to repeat itself.
Another reason is size effect. Once a fund outperforms consistently, it gains visibility, attracts a lot of cash flow and becomes too big. The bigger size has negative effect on fund performance. It is very expensive to stay active and rebalance frequently when a fund is big. In fact, many such funds start behaving more like an index and start gaining in diversifying their portfolios rather than continuing stock picking.
Among those funds that continue stock picking, fund managers differ in their skill levels. The more skilled ones will continue to invest in undervalued securities after reporting higher alphas. On the other hand, managers with lower skills or for other reasons (such as bigger size after fund inflows or other institutional constraints) will try to take less “risk” and start diversifying more.
If a fund manager continues picking stocks after reporting high alpha, we should observe funds with both lower levels of R-squared and high alpha. In other words, we should see funds whose returns both deviate from the benchmark and beat the benchmark thanks to the manager’s skill.
To see if this true, we conducted another analysis. Funds are first sorted into five portfolios ranging from high to low R-squared for month (t-1). Then each R-squared portfolio is sorted into five portfolios based on their alpha for (t-1). We are able to identify a portfolio of mutual funds with highest alpha and lowest R-squared. We predict that this portfolio of funds (or fund managers) will continue providing abnormal performance in the following month. Table 1 reports the results of this sorting exercise.
Table 1. Mutual Funds Sorted by R-Squared and Alpha
| The funds in this table were sorted first by into five portfolios ranging from high to low R-squared for month (t–1). Then each portfolio is sorted into five portfolios based on alpha. As the results show, a portfolio constructed of funds with the lowest R-squared and the highest alpha outperforms. | |||||
|
|
R2 (t-1) | ||||
| Alpha (t-1) | Low | 2 | 3 | 4 | High |
| Low | –2.829 | –2.066 | –2.334 | –2.489 | –2.188 |
| 2 | –0.570 | –1.483 | –1.114 | –1.336 | –1.652 |
| 3 | –0.516 | –0.615 | –0.658 | –1.323 | –1.068 |
| 4 | 0.972 | 0.023 | –0.507 | –1.255 | –1.071 |
| High | 3.484 | 1.142 | –0.280 | –0.988 | –1.310 |
Conditioning on both R-squared and alpha, the portfolio of funds with the lowest past R-squared and highest past alpha generates about 3.5% in risk-adjusted net-of-expenses return, or alpha. This excess performance is statistically significant. The risk adjustment here means that no matter how well or how poorly the standard benchmark indexes are doing, the average fund in our ‘corner’ portfolio (high alpha/low R-squared portfolio) would outperform the indexes by 3.5% annually (after fees).
Out of all 25 portfolios, only the corner portfolio significantly produces the highest results. The neighboring portfolios generate positive alphas but the numbers are not statistically significant. Still, they perform better than funds whose past R-squared is high and their past alpha is low; such funds significantly underperform the benchmark indexes. In general, fund performance worsens as we move from the bottom left portfolio to the top right portfolio.
Using the Research to Improve Portfolio Performance
The following steps can help individual investors use our research results to improve their results.
1) If a fund has high R-squared, don’t bother buying it. Buy ETFs whose characteristics are similar to the style of the fund. For example, if the fund’s style is small cap, buy a Russell 2000 ETF instead of the supposedly active fund. If the active fund’s style is declared as small-cap growth, buy a Russell 2000 growth ETF. ETFs charge much less than active funds do.
2) If you decide to invest in a low-R-squared fund, do the following:
- Focus on funds with low R-squared. From among these funds, pick those that had particularly good past performance (alpha). [Editor’s Note: The online version of AAII’s 2015 Mutual Fund Guide includes R-squared data. The guide can be accessed at www.aaii.com/guides/mfguide. Our intention is to include the figure in the future versions of the guide as well.]
- Diversify among funds with the desirable characteristics: low R-squared and high alpha. For example, if you plan to invest $100,000 in funds, spread them among, say, 10 funds with such characteristics. Investing in a portfolio of funds increases your chance of benefiting from the advantage implied by the chosen characteristics and outperforming the benchmarks. There is too much “noise” and too much is left to luck if you invest in one or very few funds.
What are the threshold R-squared values that one can use to pick a fund in a given category? It depends on the benchmark model you are using. With our particular four-factor benchmark model, the mean R-squared of the funds in our analysis is 91% and the median is 93%. For our low-R-squared and high-alpha portfolio (“corner portfolio”), the average R-squared is 80% and the median is 83%. It means that about 80% of the funds’ volatility is explained by systematic factors or the benchmark indexes we are using. The other 20% is fund managers’ deviations from benchmarks, which allow them to continue outperforming the indexes. If you are using other benchmark models—for example, single index model; i.e., excess return on S&P 500—the threshold R-squared will be lower.
Conclusion
There are more mutual funds than stocks listed on NYSE/Amex and NASDAQ exchanges. An average mutual fund delivers negative after-management-fees risk-adjusted performance. Past good performance, on average, does not persist.
Only skilled managers who continue doing stock picking and employ unique strategies that distinguish their investment portfolios from those of the common benchmark indexes are able to outperform consistently. To identify such managers, one needs to look at a fund’s alpha as a measure of past performance and a fund’s R-squared estimated from a benchmark model as a measure of selectivity.
Funds with the lowest past R-squared and highest past alpha are more likely to outperform their peers on the risk-adjusted basis.
Related

Related

Mutual Funds
Beyond the Numbers: Getting to Know a Manager
Discussion
FREE REPORT

Get your free copy of our special
report analyzing the tech stocks
most likely to outperform the
market.
James Vanek from AZ posted over 11 years ago:
Jim Linnemann from MI posted over 11 years ago:
Dave Gilmer from WA posted over 11 years ago:
Donald Polsky from NE posted over 10 years ago:
You need to log in as a registered AAII user before commenting.
Log InCreate an account