

Related

Portfolio Strategies
The optimal equity allocation depends on market valuations, though a fixed 60% stock/40% Treasury bill allocation works well overall.

Retirees seeking to manage their own portfolios may find two areas of research when looking for guidance.
One is whether the optimal equity glide path (the change in allocation to stocks as an investor ages) should rise or fall throughout retirement (and at what pace those changes should occur). The other is whether retirement asset allocation should move up and down dynamically in response to stock market valuation extremes. These are key considerations since they not only impact lifetime wealth, but they also impact how much money can be withdrawn each year without a retiree running out of money.
Our current research combines glide paths and valuations in order to investigate which types of market valuation environments may justify different types of glide paths for retirees. Considering market valuations, are there times when a traditional glide path may be preferable to a rising equity glide path? Do rising glide paths perform better when retirement begins at a point of high market valuations? Are retirees justified to deviate from a set glide path when market valuations are at extreme levels? These questions are investigated using historical data from Robert Shiller’s website extending back to 1871.
With U.S. historical data, it is difficult to beat a strategy that maintains a consistently high allocation to stocks. When we consider retirements beginning in varying valuation environments [as defined by the level of Robert Shiller’s cyclically adjusted price-earnings (CAPE) ratio relative to its then-current historical median], we find the potential for different dynamic allocation strategies to help retirees sustain higher spending levels with lower average stock allocations in certain situations. When retirements begin in overvalued markets, an accelerated rising equity glide path has shown much potential to provide downside risk protection by minimizing equity exposure when an adverse market event would have the greatest impact. In other valuation environments, historical worst-case scenario sustainable withdrawal rates were highest with valuation-based asset allocation strategies, which maintain a midrange average stock allocation, but adjust higher or lower when markets are deemed undervalued or overvalued, respectively.
We use overlapping historical periods to simulate retirement outcomes for hypothetical retirees over rolling 30-year periods using different asset allocation strategies. The “withdrawal rate” is defined as a percentage of retirement assets in the initial year, with that fixed-dollar amount then adjusted for inflation in subsequent years regardless of asset returns.
The maximum sustainable withdrawal rate (MWR) is the highest (initial) withdrawal rate that would have been able to sustain a series of inflation-adjusted dollar withdrawals over the 30-year retirement duration. The SafeMax is the worst-case sustainable withdrawal rate based on historical outcomes for a given allocation strategy: It is the maximum amount a retiree can withdraw from his or her portfolio without running out of money before death given past market events.
This study uses the dataset provided on Robert Shiller’s website (www.econ.yale.edu/~shiller/data.htm). The CAPE measure is the stock price in January divided by the average real earnings on a monthly basis over the prior 10 years. For short-term fixed-income assets, Shiller stopped collecting data after 2009. We fill in data for the most recent years using the one-year constant-maturity Treasury rates from the Board of Governors of the Federal Reserve System.
Generally, depending on the underlying assumptions and outcome measures, the optimal starting equity exposures for a 4% withdrawal rate are around 20% to 40% and they finish at around 40% to 80%. (We made the case for gradually increasing equity exposure in retirement in the April 2014 AAII Journal: “Reduce Stock Exposure in Retirement, or Gradually Increase It?”)
In this study, we also analyze cases based around asset allocation strategies comparable to a rising equity glide path beginning at 30% stocks and ending at 60% stocks. We analyze fixed asset allocations, traditional declining equity glide paths, rising equity glide paths, accelerated traditional and rising glide paths, valuation-based allocations tethered around a fixed allocation, and glide paths with valuation-based overlays.
Fixed asset allocations include 45% stocks (the midpoint when shifting from 30% to 60%), and 60% stocks (the aggressive end of the baseline glide path). The traditional (declining) equity glide path will begin retirement at 60% stocks and reduce the stock allocation by 1% per year (such that equities are down to 50% after 10 years, 40% after 20 years, etc.) until the stock allocation reaches 30% in the 30th year of retirement. We also consider an accelerated traditional glide path that begins at 60% stocks and reduces the stock allocation by 2% per year such that the final 30% stock allocation is reached in the 15th year (and then static from there to the end of retirement). The rising equity glide path starts retirement at 30% stocks and increases the stock allocation by 1% per year, such that it takes 30 years to reach the final stock allocation of 60%. We also use an accelerated rising equity glide path that increases the stock allocation by 2% each year, such that it takes 15 years for the final 60% allocation to be reached.
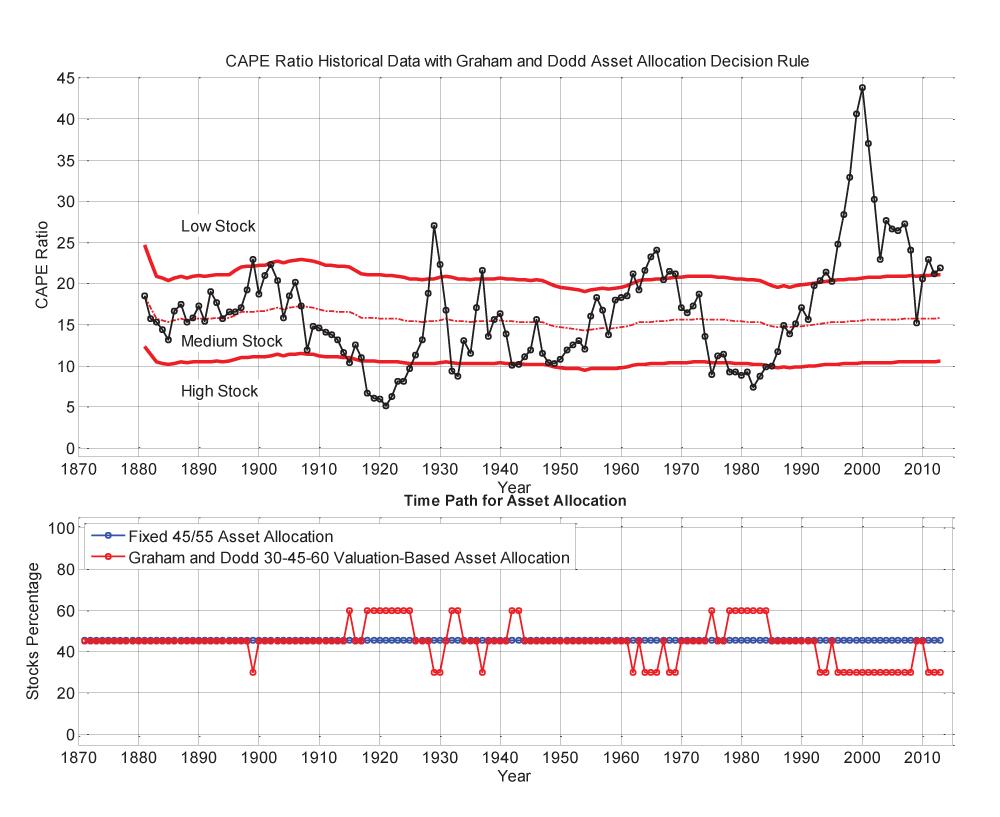
For the valuation-based asset allocation strategy, the neutral stock allocation is 45%, and the stock allocation will shift to 60% when the market is undervalued and to 30% when the market is overvalued. Though there are a multitude of ways to define an undervalued or overvalued market, we rely on the switching rules developed long ago by Graham and Dodd (“Security Analysis: The Classic 1940 Second Edition,” McGraw-Hill, 1940). They suggested maintaining the neutral asset allocation when valuations fall within a range between two-thirds and four-thirds of their historical average value.
Graham and Dodd increase the stock allocation when valuations are less than two-thirds of their average, and decrease the stock allocation when valuations are more than four-thirds of their average. These numerical bounds correspond to evolving CAPE values of approximately 10 and 21 over time. Given the volatility of the CAPE ratio, these bounds also roughly correspond with the bottom and top quintiles of the historical valuation distribution, which are CAPE values of 11.1 and 21.2 (see Figure 1). Though more frequent action is possible, we only consider investors who check whether a revision for their asset allocation is required at the beginning of each year.
Both Treasury bonds and bills (T-bills) were combined with stocks in the various allocation strategies. While bonds have historically provided a better yield than T-bills, the results reveal that when coupled with their increased volatility, the worst-case historical outcomes worsened with (longer-term) bonds compared to T-bills.
Table 1 shows the historical worst-case sustainable withdrawal rate (SafeMax) outcomes for the fixed portfolios (45% and 60% in equities), and for each of the two versions of the rising and declining glide paths. Results include both scenarios where fixed-income assets are held as T-bills and as bonds.
Table 1. Historical Safe Maximum Withdrawals (SafeMax) Over 30-Year Retirement Periods
|
|
Stocks/T-Bills Asset Allocations (%) |
Stocks/Bonds Asset Allocations (%) |
|
|
||
|
|
||
| Fixed 45% Stocks | 3.83 | 3.54 |
| Fixed 60% Stocks | 4.10 | 3.62 |
| Rising Equity Glide path | 3.86 | 3.53 |
| Traditional (Declining) Glide Path | 3.78 | 3.54 |
| Accelerated Rising Equity Glide Path | 4.21 | 3.59 |
| Accelerated Traditional (Declining) Glide Path | 3.44 | 3.47 |
Note: The rising equity glide path transitions from 30% stocks to 60% stocks over a 30-year period. The traditional equity glide path transitions from 60% stocks to 30% stocks over a 30-year period. The accelerated versions of the glide paths make the same allocation transitions over 15 years.
Notably, while in our April 2014 AAII Journal article we showed that rising equity glide paths over the entire 30-year time horizon can be more effective when modeled on a multiple scenario (“Monte Carlo”) basis, the results were not replicated when analyzed using historical data. Instead, with historical data that implicitly includes mean reversion (not included in the prior Monte Carlo models), the optimal portfolios were the (fixed) 60% equity exposure portfolio with both stocks/T-bills and stocks/bonds portfolios. Both the baseline rising equity glide path and the declining equity glide path results proved inferior to the more aggressive fixed allocation. [Editor’s note: Mean reversion is the tendency of a series data points to revert back to their average.]
With U.S. historical data, the equity risk premium (the extra return for holding stocks over bonds) looms large, making it difficult for conservative portfolios/glide paths to achieve better results than more aggressive (static) asset allocations. This issue is less pronounced when using Monte Carlo simulations based on historical data that do not incorporate mean reversion.
With the accelerated glide paths, using the historical data that reflects mean reversion, the results when using T-bills suggest that the accelerating rising glide path could even outperform the fixed aggressive allocation in the worst-case scenario. Notably, while the accelerated rising glide path does have greater average equity exposure throughout retirement compared to a 30-year rising glide path, it still has less average equity exposure than the 60% fixed portfolio (as the former only reaches 60% in equities for the second half of retirement, while the latter has 60% in equities for all of retirement) yet it achieves a superior withdrawal rate result. With bonds, the accelerated rising glide path was still not quite as good as the fixed aggressive allocation, though both were noticeably lower than their stocks/T-bills counterparts.
On the other hand, the accelerated declining glide path actually performs worse than the other portfolios, in the case of both stocks/T-bills and stocks/bonds. This is likely a combination of the fact that such portfolios have lower average equity allocations (and therefore less of an equities contribution to long-term growth) and that the accelerated declining glide path can further exacerbate sequence-of-return risk (by bearing most of the equity exposure and downside risk in the early years when a market decline most jeopardizes the retirement goal, but then decreasing the equity exposure and limiting any subsequent recovery as mean reversion takes hold).
Table 2 shows the SafeMax for the stocks/T-bills and stocks/bonds portfolios with the four primary strategies—fixed 45%, fixed 60%, accelerated rising glide path, and steady declining glide path—segmenting by the market valuation level at the start of retirement. The valuation thresholds are determined by whether retirement began in a favorable (undervalued), neutral (fairly valued), or unfavorable (overvalued) market environment.
Table 2. Historical SafeMax Over 30-Year Retirement Periods Segmented by CAPE Market Valuation Levels at the Retirement Date
|
|
Undervalued (%) |
Fairly Valued (%) |
Overvalued (%) |
|
|
|||
|
|
|||
| Using Stocks/T-Bills | |||
| Fixed 45% Stocks | 5.05 | 4.19 | 3.83 |
| Fixed 60% Stocks | 5.37 | 4.43 | 4.10 |
| Traditional (Declining) Glide Path | 5.22 | 4.27 | 3.78 |
| Accelerated Rising Equity Glide Path | 4.97 | 4.43 | 4.21 |
| Using Stocks/Bonds | |||
| Fixed 45% Stocks | 5.01 | 3.75 | 3.54 |
| Fixed 60% Stocks | 5.33 | 3.92 | 3.62 |
| Traditional (Declining) Glide Path | 5.22 | 3.83 | 3.54 |
| Accelerated Rising Equity Glide Path | 4.89 | 3.74 | 3.59 |
Note: The commentary in Table 1 explains the allocations for the various glide paths. The asset allocations in Figure 1 indicate which years are treated as undervalued (high stock allocation), fairly valued (neutral stock allocation), and overvalued (low stock allocation).
Before exploring glide path results, it’s notable that segmenting the results by market valuation also reveals an interesting distinction in the comparison of stocks/T-bills versus stocks/bonds themselves. The inclusion of bonds in the portfolio leads to inferior outcomes in neutral or unfavorable valuation scenarios, while the stocks/bonds outcomes are comparable (though still not superior) for retirements beginning at favorable valuation levels. These results further emphasize that when market valuations are high and stocks are exposed to an increased probability of low returns, the volatility of (longer-term) bonds can be a “liability” in mitigating sequence-of-return risk; however, in situations where stocks are already favorably valued, and the downside risk to equities is more limited, the volatility of bonds is less problematic.
With respect to the glide path outcomes, the accelerated rising equity glide path is most effective in the overvalued environments (where the worst of the bad outcomes are concentrated). In situations where retirement begins with valuations in the middle zone, the accelerated rising glide path is comparable (with stocks/T-bills), but not superior to the fixed 60% equity portfolio (though notably, achieves the same SafeMax with less cumulative equity exposure and volatility throughout retirement). In the undervalued scenarios, where stocks are actually “cheap” at the beginning of retirement, the accelerated rising glide path shifts to being the least favorable result while the steady declining glide path performs better, and the fixed 60% equity portfolio yields the most favorable SafeMax results. This is not surprising, given that the 60% stock portfolio has the highest average equity exposure in the situation where stocks have the highest expected returns due to favorable valuations.
These results indicate that the optimal equity glide path (as well as the decision about whether to use T-bills or bonds) is in fact quite sensitive to the market valuation at the start of retirement (and indirectly, to expected market returns). While the accelerated rising equity glide path worked best in some scenarios, the fixed 60% equity portfolio did better in most. The rising equity glide path should only be considered in unfavorable valuation environments. Notably, though, the “traditional” steady declining equity glide path is still inferior to some other strategy in all valuation environments. Based on historical data, more aggressive portfolios are rewarded in favorable (undervalued) and neutral environments, and rising equity glide paths performed better in unfavorable market environments, which were the situations that generated the overall historical SafeMax.
Given the apparent sensitivity of optimal asset allocation glide paths to market valuation at the beginning of retirement, we next test the consequences of using a more dynamic asset allocation strategy that shifts equity exposure throughout retirement, decreasing equity exposure to 30% in years when CAPE was more than 133% of its historical median to that point, and increasing equity exposure to 60% in years when CAPE fell to less than 67% of its historical median up to that point, and otherwise holding the equity exposure at 45% in the neutral valuation environments. Table 3 shows the SafeMax results with these valuation-based strategies added to the mix.
Table 3. Historical SafeMax Over 30-Year Retirement Periods Segmented by CAPE Market Valuation Levels at the Retirement Date With Valuation-Based Strategies
|
|
Undervalued (%) |
Fairly Valued (%) |
Overvalued (%) |
|
|
|||
|
|
|||
| Using Stocks/T-Bills | |||
| Fixed 45% Stocks | 5.05 | 4.19 | 3.83 |
| Fixed 60% Stocks | 5.37 | 4.43 | 4.10 |
| Traditional (Declining) Glide Path | 5.22 | 4.27 | 3.78 |
| Accelerated Rising Equity Glide Path | 4.97 | 4.43 | 4.21 |
| Valuation-Based Allocation: 30-45-60 | 5.62 | 4.50 | 4.20 |
| Using Stocks/Bonds | |||
| Fixed 45% Stocks | 5.01 | 3.75 | 3.54 |
| Fixed 60% Stocks | 5.33 | 3.92 | 3.62 |
| Traditional (Declining) Glide Path | 5.22 | 3.83 | 3.54 |
| Accelerated Rising Equity Glide Path | 4.89 | 3.74 | 3.59 |
| Valuation-Based Allocation: 30-45-60 | 5.56 | 3.94 | 3.75 |
In the case of unfavorable valuation environments, the valuation-based results using stocks/T-bills are comparable to the results of the accelerated rising equity glide path, and in neutral valuation environments, valuation-based allocations are slightly superior. In the most favorable (i.e., “cheap”) valuation environments, though, the valuation-based SafeMax was significantly higher than for the accelerated rising glide path. Notably, the valuation-based SafeMax was also consistently slightly higher than the static 60% stocks portfolio, even in the most favorable starting valuation environment.
These results suggest that the valuation-based approach is generally superior to the rising equity glide path approach and the fixed equity allocation portfolios, as the valuation-based scenarios produce comparable-to-slightly-better results across the board. For those who are willing to be even more flexible, there appear to be additional benefits to potentially widening the valuation-based adjustments further (expanding or eliminating the bounding thresholds), though such an approach would have to be managed against a person’s risk tolerance and willingness to deviate so significantly from an underlying allocation benchmark. And in all but the most favorable valuation environments, retirees should consider more defensive bond allocations—i.e., T-bills as opposed to longer-term bonds—as even with valuation-based adjustments, stock/bond portfolios underperformed stock/T-bills portfolios from unfavorable and neutral starting valuations.
Portfolio Strategies

Stock Strategies
Portfolio Strategies

Daniel Christiansen from PA posted over 11 years ago:
Alan Hofeldt from MO posted over 11 years ago:
Peter Mumford from MN posted over 11 years ago:
Pete K from MO posted over 11 years ago:
Charles Rotblut from IL posted over 11 years ago:
Harry Rich from OH posted over 11 years ago:
P Chiaravalli from MI posted over 11 years ago:
Rob A from NC posted over 11 years ago:
Michael Engel MD from MI posted over 11 years ago:
Jean Henrich from IL posted over 11 years ago:
James Mallett from Florida posted over 10 years ago:
Andrea Matthews from MA posted over 8 years ago:
Andrea Matthews from MA posted over 8 years ago:
You need to log in as a registered AAII user before commenting.
Log InCreate an account