


IVIEWMarkets is a new website designed to provide investors with information to make investment decisions. It focuses on fundamental and technical analysis investment tools for both the novice and professional investor.
When arriving at the website, you see nine different tabs across the top: Overview, Charts, Market Internals, Sectors, ETFs, Portfolio, Scan, News and Backtest (Figure 1).

Overview Tab
On the Overview page are five subtabs: indices, sectors, asset classes, notable moves and broad markets. Along the left-hand side of the indices tab are the previous month’s performance figures for several widely tracked indexes and benchmarks including the S&P 500 index, the Nasdaq Composite, the CBOE VIX, the Russell 2000 index, the 10-year Treasury bond and gold. The main part of the page reports on the past week’s best- and worst-performing asset class, global market and sector.
Below this is a chart displaying the two-day percentage price change for the S&P 500, Dow Jones U.S. Index and the Nasdaq Composite. Clicking the menu button (three horizontal lines) in the top right-hand corner of the chart brings up the option to download the chart in PNG, JPEG, PDF or SVG vector image format (you’ll find this same menu button with printing options used throughout the website).
Boxes on the right-hand side of the page display notable moves and alerts based on technical indicators for S&P 500 companies, stock sectors and asset classes (represented by benchmark mutual funds and exchange-traded funds). Technical indicators include full gap down/up, crossed below/above 200 simple moving average (SMA), crossed above/below 50 SMA, oversold/overbought, negative volume and positive key reversal.
Charts Tab
Clicking the Charts tab at the top of the page brings you to a part of the website that includes several charting options (Figure 2). The Chart pages’ subtabs include: chart, big chart, trader view, full view chart, multi charts and watch list. Here viewers can overlay more than 100 indicators on a stock’s price data over a user-selected period of time.
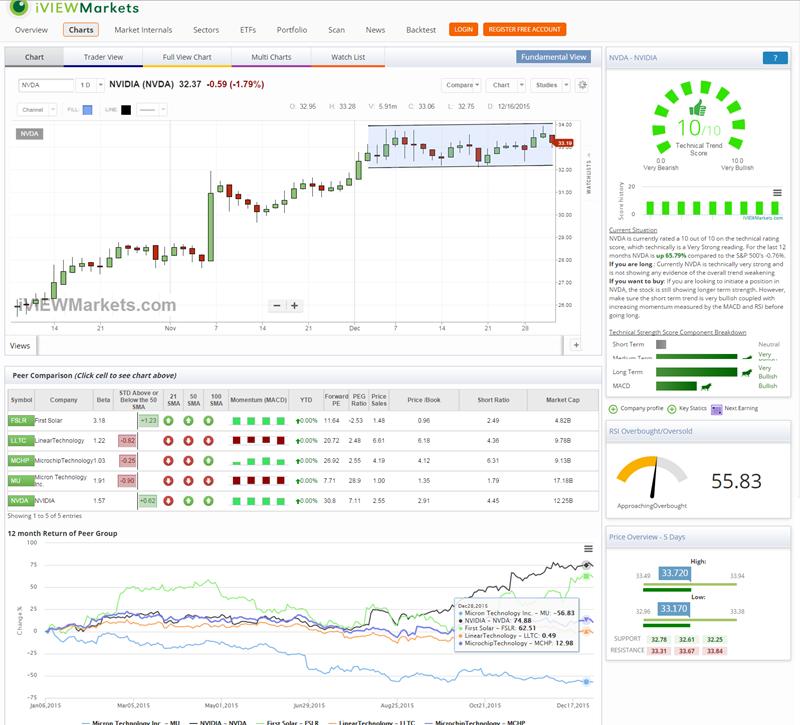
Below the main chart is a peer comparison table. This table identifies companies comparable to the one you are researching and gives fundamental and technical figures such as beta, standard deviation above or below the 50-day SMA, moving average convergence divergence (MACD), year-to-date return, forward price-earnings ratio, price-earnings-to-earnings-growth (PEG) ratio, price-to-sales ratio, price-to-book ratio, short ratio and market capitalization. Below the peer comparison table is a chart showing the price change of the peer group’s stock prices over the last 12 months.
Along the right-hand side of the page is a relative strength trend score based on a scale of 1 to 10, 10 being the strongest relative strength (very bullish). Below the trend score, you see the stock ranked very bearish, bearish, neutral, bullish or very bullish in terms of the short-term, medium-term, and long-term trend and MACD. The trend score is based on the time period trends, with the long-term trends weighted the most. IVIEWMarkets looks at the percentage above moving averages for each time frame along with rate of change and then assigns a percentile rank to bucket the scoring.
Toward the bottom right-hand side of the page there is a barometer signaling whether the security is overbought or oversold based on its relative strength index as well as a price overview chart showing the stock’s support and resistance prices over the last five days.
Sector Tab
Clicking the Sector tab at the top of the website brings you to a page dedicated to analyzing eight different sectors: consumer goods, financial, healthcare, industrial goods, services, technology, utilities and materials. Sector performance is tracked using SPDR exchange-traded funds (ETFs). The Sector page contains four different subtabs: sectors, sector relative strength, sector momentum and stacked chart view.
On the sector subtab, viewers see a trend score for each sector and industry. More in-depth explanation of the trend score is available along the right-hand side of the page when you click on a sector or industry box. This trend score is the same as described on the chart page: a relative strength score ranking from 1 to 10, with 10 being very bullish. The overall score is dependent on short-, medium- and long-term technical analysis components.
An interesting feature is the “current situation” write-up below the trend score, which discusses the sector’s performance as well what to watch for if you currently own the ETF or if you want to buy. For example, if you are considering buying into a particular sector, iViewMarkets tells you what types of technical indicators to look for in the ETF before purchasing. Below the trend score you see the top 10 holdings of the ETF that represents that sector/industry.
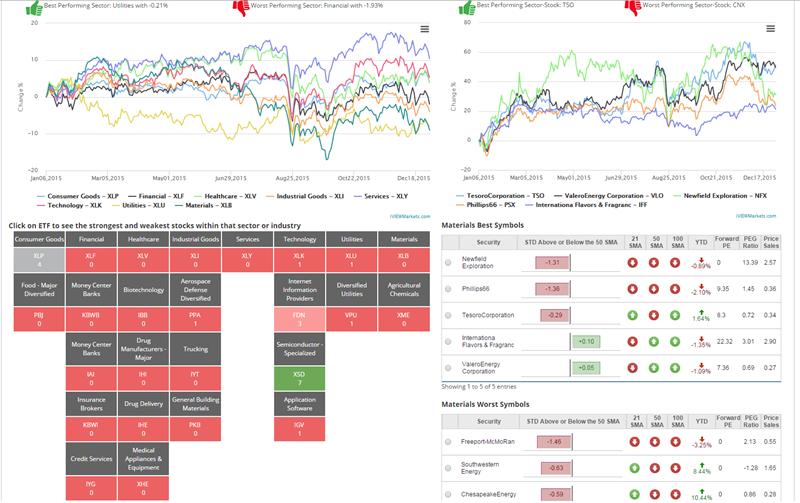
The “sector relative strength” subtab displays the best- and worst-performing sectors over the last year. A chart displays each sector ETF’s price performance over the last year. When you click on a sector or industry ETF box on this page, it brings up the strongest and weakest stocks within that group (Figure 3).
The “sector momentum” subtab displays each sector’s ETF with a momentum MACD bar chart and a relative strength index barometer. Below the barometer, each sector is classified as overbought, approaching overbought, neutral, approaching oversold or oversold.
Portfolio Tab
The Portfolio tab allows you to create your own portfolio to track within the iViewMarkets website. To create a portfolio, click the “create portfolio” button in blue toward the upper right-hand side of the page. A box will appear asking you to name the portfolio. Once you have named your portfolio, it can be viewed on the “all portfolio” subtab. To edit or add tickers to your portfolio, click on its name on the “all portfolio” subtab. Another page appears where you can input your holdings’ ticker symbols, number of shares purchased and purchase price. Once you click “add symbol” the symbol will be added to your portfolio.
After a portfolio is created, it has its own subtab on the Portfolio page (Figure 4). Each portfolio tab includes a chart comparing the price performance your holdings over the last year to the S&P 500 (but it does not give the performance of your actual portfolio over the last year). Along the right-hand side is a section for “technical alerts.” If a particular holding in your portfolio triggers a technical alert, such as “MACD above signal,” it is listed here. Below that is a section for portfolio news items, which is helpful but seemed a little light on news items included.
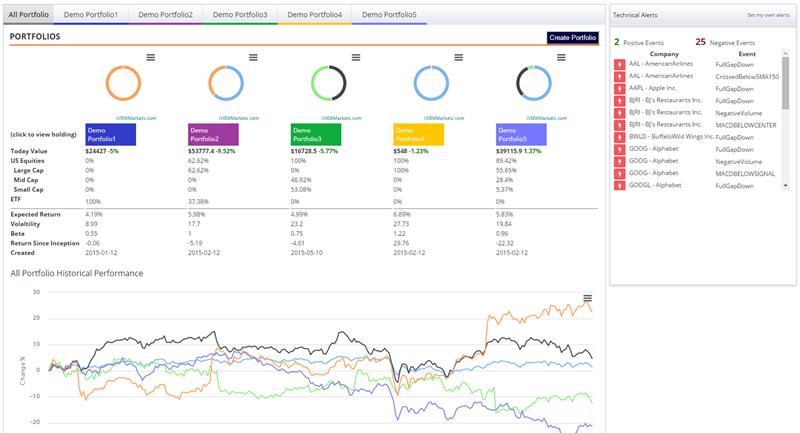
Below the chart is a table containing information on each holding in the portfolio including notable news, earnings, latest price, today’s price change, year-to-date return, standard deviation above or below the stock’s 50-day SMA, relative strength index, MACD, forward price-earnings ratio, dividend yield, 52-week trading range and current trend analysis score. Clicking on the purple calendar icon opens a pop-up box with the date of the next earnings release as well as a list of recent analyst ratings on the stock.
A “sector detailed analysis” button within a portfolio’s subtab shows the sector allocation in a bar chart along with a price chart displaying each SPDR sector ETF’s performance over the last year.
You are emailed any time there is a technical alert issued on one of the stocks or ETFs in any of your portfolios.
Scan Tab
The Scan tab allows viewers to filter for stocks and ETFs on technical factors such as performance, simple moving averages, relative strength index, 52-week high or low, volatility, rating and beta. Although there are not a lot of options, it is a simple way to perform a basic technical screen.
The greatest momentum subtab in the Scan area displays stocks or ETFs with the greatest momentum over the last day, week or month. The table displays the price, one-month chart, simple moving average figures, MACD and RSI. Again, it is a simple but efficient way for investors looking to quickly see momentum-oriented stocks and ETFs.
Conclusion
Overall, iVIEWMarkets is a visually appealing, easy-to-understand website. As of now, it provides only end-of-day data, but I expect that intraday data will be available soon. According to the company, iVIEWMarkets.com will be seeking user feedback, which will ultimately drive the development of new functionality. New features are expected to be rolled out over the next two quarters, so I recommend checking the site out, especially over time.
We also welcome feedback here, so please let us know what you think.
Discussion
FREE REPORT

Jonathan Bates from NY posted over 10 years ago:
G Mueden from RI posted over 10 years ago:
Jerry Mills from MN posted over 10 years ago:
You need to log in as a registered AAII user before commenting.
Log InCreate an account