Dividend-paying stocks are usually classified as “conservative” stocks, at least compared to highly volatile growth stocks. Dividend income provides a steady source of return, and no longer suffers from a tax rate disadvantage.
Also, investing in companies with dividend reinvestment plans (DRPs) offers a conservative low-cost approach, since dividend payments are put to work immediately with little or no transaction costs involved. [For more on the basics of DRPs, see our annual guide.]
However, selecting stocks from a universe that consists only of conservative stocks—firms offering dividend reinvestment plans—is not a “conservative” approach, and can quickly land you into trouble.
That’s because companies that offer dividend reinvestment plans tend to concentrate in certain industries. Limiting your selection to these firms will lead to a stock portfolio that is undiversified—a big risk for which you are not compensated by higher returns.
Stocks with DRPs can, however, provide a beneficial diversification component to investors with aggressive, high-growth stock portfolios.
A High-Yield Screen
What if you want to diversify an aggressive stock portfolio by investing in more conservative dividend-paying stocks that offer dividend reinvestment plans?
Stock Investor Pro—AAII’s fundamental stock screening program and research database—includes a built-in screen that seeks companies with high dividend yields relative to their historical norm, coupled with earnings and dividend growth exceeding industry norms, and that offer dividend reinvestment plans.
For comparison purposes, the same screening criteria were also applied to the non-DRP universe.
Figure 1.
High-Yield
Dividend Screen
Performance:
DRPs & Non-DRPs
|
|
CLICK ON IMAGE TO
SEE FULL SIZE.
|
|
Performance
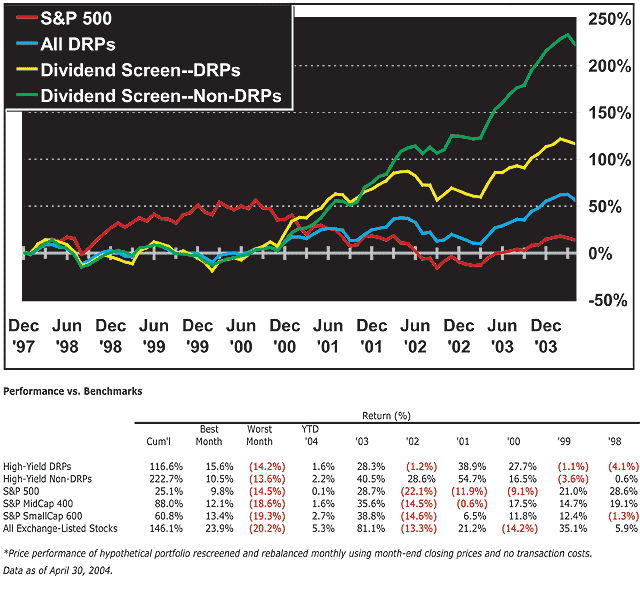
The companies passing the high-yield dividend screen—both in the DRP and non-DRP universes—have been reported and tracked on the AAII Web site for over seven years with results that far exceed the broad market indexes.
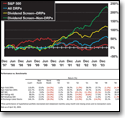
Figure 1 shows that, for both the DRP and non-DRP universes, the stocks passing the high-yield screen have surpassed the performance of the S&P 500 index since December of 1997, as well as the MidCap 400 and SmallCap 600 indexes.
Overall, the high-yield DRP screen has generated a cumulative return of 116.6% over the period from December 1997 to April 2004, while the high-yield non-DRPs screen has retuned 222.7% over the same period. Note that this performance does not include dividend payments or dividend reinvestment. Utilities make up a large portion of DRP stocks, which may help to explain why the high-yielding non-DRP stocks outperformed the DRP stocks over this time period.
|
TABLE 1. High-Yield Screen Portfolio Characteristics
|
| Portfolio Characteristics |
High-Yield |
Exchange-
Listed
Stocks |
| DRPs |
Non-DRPs |
| Price-earnings ratio |
15 |
13.9 |
19.8 |
| Price-to-book-value ratio |
2.4 |
2.1 |
2 |
| Dividend yield |
2.90% |
2.90% |
0.00% |
| Dividend growth rate (hist 5yr) |
10.40% |
17.10% |
0.00% |
| EPS growth rate (hist 5yr) |
13.40% |
17.70% |
7.30% |
| EPS growth rate (est 3-5yr) |
10.40% |
11.40% |
14.30% |
| Market cap (million) |
$13,112.90 |
$835.70 |
$342.30 |
| Relative strength vs. S&P; 500 |
-2.5% |
-9.5% |
13.00% |
| Monthly Observations |
| Average no. of passing stocks |
30 |
30 |
|
| Highest no. of passing stocks |
31 |
31 |
|
| Lowest no. of passing stocks |
19 |
27 |
|
| Monthly turnover |
74% |
71% |
|
| Data as of May 7, 2004. |
Portfolio Characteristics
The characteristics of the stocks from the DRP and non-DRP universes passing the high-yield screen are presented in Table 1.
Any screening methodology looking for high-yield stocks tends to be value-oriented, since high-yield stocks are often those of more mature companies that have fallen on hard times with regard to their stock price. This is reflected in the median price-earnings ratios (share price divided by earnings per share) for those companies currently passing the high-yield dividend screen from both the DRP and non-DRP universes. The price-earnings ratio for the DRP universe is 15.0, versus 13.9 for the non-DRP universe. Compare this to the price-earnings ratio for all exchange-listed stocks—19.8.
Companies that pay dividends tend to be more mature; their growth opportunities have diminished, so there is not the same need to plow money back into the firm. Instead, they pass the money on to shareholders. More mature companies also tend to be larger, as represented by market capitalization.
The median market capitalizations of both companies offering DRPs ($13,112.9 million) and dividend-paying companies without DRPs ($835.7 million) surpass that of exchange-listed companies ($342.3 million).
The median dividend yield for both the DRP and non-DRP universes is 2.9%, compared to 0% for all exchange-listed stocks.
When screening for value stocks, it is important to look for elements of financial strength that may change the market’s opinion of the company. Among these indicators for the high-yield dividend screen is the historical growth rate in earnings per share. Here we see that the passing companies from the DRP universe have a median five-year growth rate in earnings of 13.4%, compared to 17.7% for the non-DRP companies. The median value for all exchange-listed stocks is 7.3%.
While over the long-term, the companies passing the high-yield screen have been able to generate returns above the market, Table 1 shows that the current crop of passing companies has had lackluster price performance relative to the market. Looking at the relative strength versus the S&P 500, the DRP companies passing the high-yield screen have underperformed the S&P 500 by 2.5% and the stocks in the non-DRP universe have lagged the S&P by 9.5%. Meanwhile, exchange-traded stocks have outperformed the index by 13.0%.
Passing Companies
Table 2 lists the 10 companies for both the DRP and non-DRP universes with the highest dividend yields that passed the high-yield dividend screen as of May 7, 2004.
For both groups, the companies are listed in descending order by current dividend yield.
Historically, 30 companies from both the DRP and non-DRP universes have passed the high-yield screen. Each month when the screen is run for posting at the AAII Web site, the dividend yield value is adjusted in the screen until only 30 companies pass the screen for both the DRP and non-DRP universes. Specific criteria for the high-yield screen are listed in the What It Takes box below.
A key element of the high-yield screen is the requirement that the current dividend yield (dividend per share divided by stock price) be greater than the average yield over the last five years. For those companies offering DRPs, Jefferson-Pilot Corporation has the highest dividend yield at 6.3%. Among the non-DRP firms, Flagstar Bancorp ranks highest with a 5.1% yield.
In terms of dividend growth, the top-yielding non-DRP firms have been increasing their dividends at a much higher rate than the DRP firms. The median growth rate in dividends per share for the top-yielding non-DRP firms is 30.5%, while the dividend growth rate for the top-yielding companies offering DRPs is 10.7%. All of the top-yielding companies in the non-DRP universe have five-year dividend growth rates greater than 10%, with Redwood Empire Bancorp leading the way with a dividend growth rate of 68.0%.
|
TABLE 2. Firms with the Highest Dividend Yields: DRPs vs. Non-DRPs
|
| Company (Exch: Ticker) |
Dividend
Yield |
Annual
Growth Rates |
Payout
Ratio
(%) |
52-Wk
Rel
Strgth
(%) |
Price
Chg
(52 Wk)
(%) |
Description |
Current
(%) |
5-Yr
Avg
(%) |
Div/
Shr
(%) |
EPS
(%) |
Est
EPS
(%) |
| Firms With DRPs |
Jefferson-Pilot Corp.
(N: JP) |
630.00% |
240.00% |
1090.00% |
5.7 |
9.1 |
36.7 |
0 |
18 |
insurance holding co |
Washington Mutual
(N: WM) |
450.00% |
300.00% |
2050.00% |
19.8 |
10.9 |
35.1 |
-19 |
-5 |
financial services co |
Nat’l Fuel Gas Co.
(N: NFG) |
440.00% |
420.00% |
360.00% |
49.1 |
3 |
47.2 |
-11 |
4 |
diversified energy co |
Bank of Amer Corp.
(N: BAC) |
$4.10 |
$3.80 |
$12.60 |
19.6 |
9.9 |
40.5 |
-10 |
6 |
financial servs & prods |
BellSouth Corp.
(N: BLS) |
4 |
2.3 |
470.00% |
3.3 |
3.9 |
41.2 |
-18 |
-4 |
communic’ns servs co |
FPL Group, Inc.
(N: FPL) |
4 |
3.9 |
3.7 |
5.4 |
4.9 |
47.9 |
-12 |
3 |
utility holding co |
Equitable Res, Inc.
(N: EQT) |
3.3 |
2.5 |
10.5 |
45.7 |
9.5 |
35.3 |
4 |
22 |
integrated energy co |
Wells Fargo & Co.
(N: WFC) |
3.3 |
2.3 |
16.5 |
23.6 |
11.3 |
43 |
-1 |
16 |
financial services co |
GreenPoint Fin’l
(N: GPT) |
3.2 |
2.9 |
15.9 |
25.9 |
9.3 |
26 |
-2 |
16 |
bank holding co |
Sara Lee Corp.
(N: SLE) |
3.2 |
2.7 |
6.6 |
36.4 |
7.2 |
47.1 |
11 |
31 |
consumer prods |
| Median for Top 10 Yielders |
400% |
280% |
10.7 |
21.7 |
9.2 |
40.9 |
-6 |
11 |
|
| Median for All DRP Firms |
2.3 |
2.7 |
3 |
4.9 |
10 |
38 |
2 |
20 |
|
| Firms Without DRPs |
Flagstar Bancorp
(N: FBC) |
5.1 |
1.9 |
49.6 |
44.7 |
19.5 |
15.6 |
-9 |
7 |
thrift holding co |
NY Com’ty Banc’p
(N: NYB) |
4.1 |
2.9 |
31.2 |
37.2 |
12.1 |
38.8 |
3 |
22 |
holding co for bank |
POSCO (ADR)
(N: PKX) |
3.7 |
2 |
29.7 |
26.9 |
12.1 |
27.1 |
12 |
32 |
mfr Korean steel |
First Horizon Nat’l
(N: FHN) |
3.6 |
3 |
13.5 |
16.1 |
9.4 |
37.4 |
-16 |
-1 |
bank holding co |
OceanFirst Fin’l
(M: OCFC) |
3.6 |
3.4 |
20.3 |
20 |
7.7 |
48.4 |
-17 |
-3 |
S&L; holding co |
KT Corp. (ADR)
(N: KTC) |
3.5 |
1.3 |
44.5 |
22.8 |
21.5 |
39.6 |
-23 |
-10 |
Korean telecomm |
Citigroup Inc.
(N: C) |
3.4 |
1.6 |
31.5 |
20.9 |
11.4 |
34.9 |
2 |
20 |
global fin’l servs |
Redwood Emp Banc’p
(M: REBC) |
3.4 |
2.3 |
68 |
16.8 |
na |
44.4 |
8 |
27 |
bank holding co |
Warwick Valley Tele
(M: WWVY) |
3.4 |
3.1 |
13.6 |
14.4 |
na |
47.9 |
-31 |
-19 |
phone provider |
Cato Corp.
(N: CTR) |
3.3 |
3 |
27.1 |
9.3 |
7.5 |
48.8 |
-16 |
-1 |
women’s fashion stores |
| Median for Top 10 Yielders |
3.6 |
2.6 |
30.5 |
20.5 |
11.8 |
39.2 |
-13 |
3 |
|
| Median for All Non-DRP Firms |
0 |
2.6 |
0 |
7.8 |
15 |
0 |
14 |
34 |
|
|
For an expanded list of stocks passing these screens, go to the Stock Screens area of AAII.com.
Statistics are based upon figures as of May 7, 2004.
Source: AAII’s Stock Investor Pro / Reuters and I/B/E/S.
Exchange Key: N = New York Stock Exchange, M = Nasdaq National Market
|
In all, seven of the 10 non-DRP firms listed in Table 2 have higher dividend growth rates than the 20.5% for Washington Mutual, which has the highest dividend growth rate among the top-yielding companies offering DRPs.
However, it is important to consider the base number when examining growth rates. For example, Redwood Empire Bancorp has increased its dividend from $0.05 per share to $0.67, while Washington Mutual’s dividend has risen from $0.55 per share to $1.40.
The price performance for the top-yielding DRP and non-DRP firms over the last year has lagged that of the S&P 500, as measured by relative strength. Only two of the DRP firms in Table 2 have managed to outperform the S&P 500 over the last 52 weeks.
Sara Lee Corp. is the leader, outperforming the S&P by 11% over the last 52 weeks, and with a stock price increase of 31% over the same period. However, the top-yielding DRP firms as a whole have underperformed the S&P by 6%.
Four of the 10 non-DRP companies listed in Table 2 outperformed the S&P 500. POSCO (a Korean steel producer) outperformed the market by 12%, with a stock price rise of 32%. However, the 10 non-DRP firms listed in Table 2 as a group have underperformed the market by 13% over the last 52 weeks.
Conclusion
Firms with dividend reinvestment plans offer investors the advantage of keeping transaction costs low. But keep your focus on the investment merits of the company, and then take advantage of any plan; don’t pick a company merely because it offers a DRP plan.
| What It Takes: High-Yield Screen Criteria |
The following criteria are applied separately to those groups of companies offering DRPs and those that do not offer DRPs:
- The dividend for the last four quarters (trailing 12 months) is greater than or equal to the dividend for the last fiscal year;
- The annual dividend has increased over each of the last five years;
- The company has been paying a dividend for at least six years;
- The annualized growth rate in dividends over the last five years is greater than the median annualized growth rate in dividends for the industry over the same time period;
- The current dividend yield is greater than the average yield over the last five years;
- The payout ratio (dividends per share divided by earnings per share) for the last four quarters (trailing 12 months) is less than or equal to 50%;
- The annualized growth rate in basic earnings over the last five years is greater than or equal to the median annualized growth rate in basic earnings for the industry over the same time period; and
- The 30 companies with the highest dividend yields from both the DRP and Non-DRP universes are included in the final results.
|




No comments have been added yet. Add your thoughts to the discussion!
You need to log in as a registered AAII user before commenting.
Log InCreate an account