


It’s good for a company to have reported strong historical growth, but a change in earnings guidance will likely have a significant and lasting impact on stock price.
The market is forward-looking. Stock prices are established through expectations and adjust as these expectations change or are proven wrong. Earnings per share (EPS) estimates involve the interaction of many company, industry, and economic forces. They embody an analyst’s opinion of factors such as sales growth, product demand, competitive industry environment, profit margins and cost controls. Earnings are a key variable used to value stocks, and slight changes in expectations for future earnings or the earnings growth rate can strongly impact the stock price.
Services such as I/B/E/S, First Call, Multex, and Zacks provide consensus earnings estimates by tracking the estimates of thousands of investment analysts. Tracking these expectations and their changes is an important and rewarding strategy for stock investors.
A series of separate screens that look for companies with recent revisions is built into Stock Investor Pro, AAII’s fundamental stock screening program and research database. The screens are basic and simply focus on revisions to current and next fiscal-year estimates without any further fundamental or technical considerations. The criteria for the upward revision screen are:
The companies passing the upward and downward revision screens have been reported and tracked on AAII.com for nearly six years with interesting results.
As indicated in the performance chart (Figure 1), stocks with upward earnings revisions have clearly outperformed stocks with downward revisions. Changes in stock price resulting from an earnings revision can be felt immediately, but studies also indicate that the impact of surprises and revisions can persist for as long as a year. Even though the greatest impact on stock price was felt in the month of the revision, the strategy still worked when comparing the current consensus estimate to the previous month’s estimate, which is what the screens look for.
| FIGURE 1. Screen Performance | |||||||||
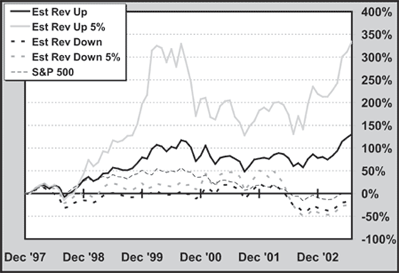
Performance vs. Benchmarks |
|||||||||
| Return (%) | |||||||||
| Cum'l | Best Month |
Worst Month |
YTD '03 |
'02 | '01 | '00 | '99 | '98 | |
| Est Rev Up* | 140.3 | 12.2 | -18.6 | 34.8 | 0.8 | -3.5 | 2.2 | 38.2 | 29.9 |
| Est Rev Up 5%* | 366.1 | 30.8 | -21.7 | 46.2 | 12.9 | -8.1 | 3.6 | 107.1 | 43.3 |
| Est Rev Down* | -10.2 | 17.6 | -23.3 | 30.9 | -43.8 | 26.7 | -7.1 | 21.9 | -15.0 |
| Est Rev Down 5%* | -15.8 | 23.6 | -23.2 | 44.9 | -61.5 | 28.3 | -4.2 | 27.8 | -3.9 |
| S&P 500 | 11.4 | 9.8 | -14.5 | 14.7 | -22.1 | -11.9 | -9.1 | 21.0 | 28.6 |
| S&P MidCap 400 | 63.5 | 12.1 | -18.6 | 19.8 | -14.5 | -0.6 | 17.5 | 14.7 | 19.1 |
| S&P SmallCap 600 | 36.4 | 13.4 | -19.3 | 20.9 | -14.6 | 6.5 | 11.8 | 12.4 | -1.3 |
| All Exchange-Listed Stocks | 99.8 | 23.9 | -20.2 | 54.8 | -13.3 | 21.2 | -14.2 | 35.1 | 5.9 |
| *Price performance of hypothethical portfolio rescreened and rebalanced monthly using month-end closing price and no transaction costs. | |||||||||
Data as of September 30, 2003.
The performance chart and table also highlight that while stocks with 5% or higher upward revisions benefited from their significant revisions, stocks with 5% or greater downward revisions did not necessarily experience greater losses than all stocks with downward revisions. In 2001 and for the first nine months of 2003, the stocks with downward revisions outperformed most market indexes. Perhaps this points to stocks bouncing back from an initial overreaction to downward revisions or industry concentrations that still performed strongly despite downward revisions.
The characteristics of the stocks passing the screens are presented in Table 1, while Table 2 lists the current group of companies passing the estimate revision screens with the highest and lowest revisions over the last month. Stocks with 5% or higher upward revisions exhibit valuation multiples above the typical exchange-listed stock, but most of the valuation ratios are not dramatically different from the norm. The stocks with 5% or higher upward revisions also exhibit the lowest historical earnings rate and lowest expected future growth rate, but the highest relative price strength over the last 52 weeks. Perhaps this screen points out stocks that have suffered financially in the past, but are now showing signs of a turnaround that the market has already recognized through price appreciation. Our screens buy stocks with upward revisions after the revision and resulting price pop, and buy stocks with downward revisions after they have underperformed the market.
| TABLE 1. Current Portfolio Characteristics | |||||
| Est. Rev. Up |
Est. Rev. Up 5% |
Est. Rev. Down |
Est. Rev. Down 5% |
Exchange- Listed Stocks |
|
| Price-earnings ratio | 21.8 | 32.5 | 19 | 19.3 | 19.3 |
| Price-to-book ratio | 2.65 | 2.1 | 1.78 | 1.44 | 1.95 |
| EPS growth rate (hist 5yr) | 7.50% | -11.2% | 1.50% | -10.7% | 1.90% |
| EPS growth rate (est 3- 5yr) | 13.00% | 11.50% | 12.90% | 15.70% | 14.00% |
| Market cap (million) | $3,056.80 | $1,848.30 | $1,048.00 | $624.10 | $290.40 |
| Relative strength vs. S&P; | 26.50% | 110.00% | -7.0% | -8.0% | 16.00% |
| Monthly Observations | |||||
| Average no. of passing stocks | 153 | 38 | 207 | 73 | |
| Highest no. of passing stocks | 408 | 111 | 538 | 170 | |
| Lowest no. of passing stocks | 44 | 4 | 100 | 28 | |
| Monthly turnover | 82% | 93% | 78% | 89% | |
The earnings estimate revision screens produce among the highest level of turnover of all the screens tracked by AAII. Over the last five plus years, between 78% and 93% of the stocks passing one month fail to pass the revision screen the next month.
A number of industries are represented with the stocks showing the greatest upward estimate revisions. Three of the stocks (Knight Trading Group, A.G. Edwards, and Lehman Brothers) have ties to the securities markets, which are benefiting from the greater-than-anticipated market activity this year. Airline stocks have shown recent better-than-expected strength so it is not surprising that America West Holdings made the upward revision list. Analysts are still expecting America West to lose $1.60 per share this year, but this represents a 27.3% improvement over the last month. Eight analysts are providing estimates for the current year, which range from a loss of $1.90 to a loss of $1.30. There have been four upward revisions in the past month and no downward revisions. Analysts are currently expecting America West to produce a profit of $0.66 next year, a 78.4% increase from a month ago.
While the earnings revisions screens are not complete screens that examine fundamental or technical factors, they highlight the importance of changes in expectations and their impact on stock prices and the potential benefit of adding an earnings revision consideration to a set of filters. Further information on earnings estimates can be found within the help system of Stock Investor Pro and the Stock Screens area of AAII.com under the title “Analyzing the Analysts.”
John Bajkowski is AAII’s financial analysis vice president and editor of Computerized Investing.
Discussion
FREE REPORT

No comments have been added yet. Add your thoughts to the discussion!
You need to log in as a registered AAII user before commenting.
Log InCreate an account