




Equities Lab at a Glance:
- Fundamental and technical research platform backed by a large point-in-time database
- Screen and backtest ideas
- Analyze the market from different perspectives
- Detailed strategy analysis
- Strategy-driven watchlists driven by both technical and fundamental factors
Henry Crutcher, founder of Equities Lab LLC, gives an overview of the Equities Lab tool and how it helps investing.
Equities Lab teaches investors the market and helps them put their knowledge to use. The goal of Equities Lab is to help investors have more fun investing and ultimately accumulate skill and the knowledge for investing.
Finding an Edge With Equities Lab
Buying stocks that are undervalued can lead to superior returns, and research using decades of stock market data shows that undervalued stocks outperform (see the work of Eugene Fama and Kenneth French). This is the cornerstone of the Benjamin Graham/Warren Buffett philosophy, and it is be the cornerstone of the approach illustrated here. To make things more realistic, this article takes the position of an investor that only invests in large-capitalization stocks (greater than $10 billion). This large-cap constraint makes outperforming the market harder. After all, small-cap stocks have outperformed large ones over the long term from 1927 to the present. There have been periods of large-cap outperformance, but these are the exception rather than the rule.
This article lays out a seven-step cycle that helps with systematic investing. Equities Lab is used here, but any tool with the same features would work. Each step is couched in generic terms, with explanations of what Equities Lab brings to the table within that step.
1. Have an idea
Here the idea used here is to “outperform the S&P 500 with a large-cap value screen.” It could be any one:
a) Use declining wedges in the past, with a current breakout to the upside—a volatile mess;
b) Momentum with reasonable fundamentals—tracks the market with occasional brilliance;
c) Low standard deviation of monthly return for enhanced portfolio safety—good, smooth and outperforms;
d) Low insider ownership relative to its peers, but rising—just tracks the market; or
e) Something else—there are many ways to blend fundamental and technical analysis.
2. Create the screen
Create a simple formula. There’s a tension here; the simplest formulas (e.g., P/E < 10) tend to be both popular and fragile. People employ them because their tools don’t allow for more robust formulas. This leads people into trouble as companies can game a single metric fairly easily. Furthermore, trades can get crowded, reducing returns.
3. See what matches
Equities Lab can help analyze portfolios with heat maps, results breakdown and the results grid. This article doesn’t describe every feature in Equities Lab, but instead only focuses on the ones that develop, verify and put an idea in practice.
4. Test the performance
Buying value only makes sense if it performs well. This article shows how to test performance in the sections on backtesting, using the performance chart, statistics, positions breakdown and results tilt. This testing is important: Many strategies sound good but fail in practice.
5. Try to improve the screen
True to life, not every idea is an improvement. In this article, a momentum component fails to make the cut, despite a performance boost.
6. Put it into practice
Equities Lab helps investors to stay on track and evaluate companies to see if they are good trades.
7. Learn about investing
Investors can use big data and analytics to become smarter and learn about investing along the way. Equities Lab teaches market wisdom almost by osmosis.
8. Stock screening
Equities Lab is designed to answer the question, “Which stocks should I buy?” This can start simply, such as, “earnings yield greater than 10%.” Equities Lab will help users find the fields as they are typed or by search:
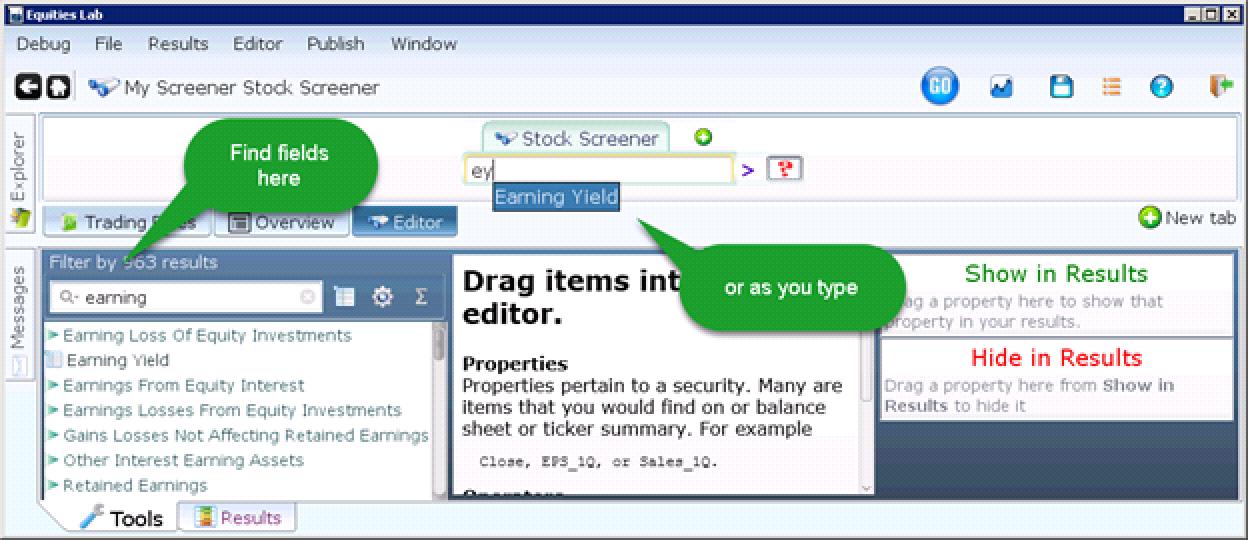
The returned results are either for the present day or, if desired, some date in the past. Using past dates, users can do “what-if” studies to see the returns of following a given strategy.
Why are Equations Better?
Equations are more flexible than table-based screeners, enabling better strategies. Going beyond selecting values for given fields, Equities Lab users can track ranks, rates of change, relationships between fields and more. With full fundamental and pricing data for U.S. equities for the last 20 years (provided by Morningstar), a wide range of quantitative investment strategies can be explored. For instance, take the following:
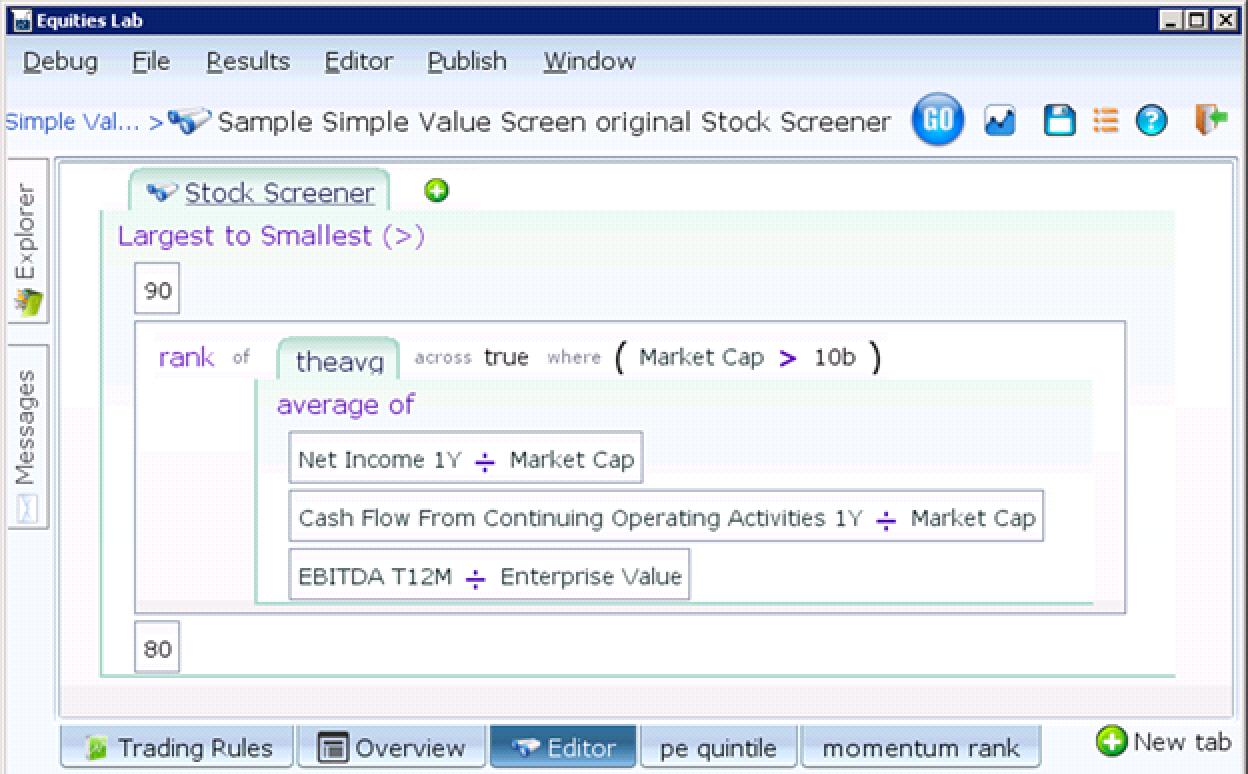
Consider the valuation term depicted in the picture above. Averaging several metrics protects the investor against bad (or manipulated) metrics, making the screen more robust. That is why expert investors look at several factors. The screenshot above ranks all the large-cap stocks and takes a slice (or decile) of all these stocks that are cheap relative to their peers while excluding the cheapest decile. This example also excludes companies that are below $10 billion in market capitalization. None of these choices are built in; change anything by clicking on it and entering a new value, field (see the list here) or formula (including Piotroski score, Beneish score or Quality Minus Junk, among others). Within Equities Lab, this equation editing panel can be used to screen stocks, test strategies, plot variables and tweak the built-in formulas. If you think that the Piotroski F-Score would be better at identifying future bankruptcies if it had one more test, you can experiment and find out.
The example screen above returns a set of stocks that are undervalued based on three popular value metrics:
- Earnings Yield: This very popular metric computes how much profit is generated for each dollar invested. Long term, stock prices almost always are correlated with earnings growth over time.
- Cash Flow Yield: Earnings are subject to manipulation. There’s a lot less scope for creative accounting when it comes to cash flow. This makes many prefer cash flow yield.
- EBITDA Over Enterprise Value: Sophisticated investors like this metric because it helps even out the effects of capital structure. EBITDA stands for earnings before interest, taxes, depreciation and amortization. In other words, “earnings before bad stuff.” Imagine a company that earns $1 billion with a market cap of $10 billion—it has an earnings yield of 10%. Compare this to another company that earns $1 billion, but has a market cap of only $1 billion and $9 billion of debt. This company has an earnings yield of 100%, but its EBITDA over enterprise value will be about 10%.
The averaging of metrics, each of which has its individual issues, results in a more robust screen. Having created the term, the next task is to understand the results. Equities Lab provides a number of different ways to slice and dice results.
The Heat Map
Heat maps present, sort, group and process hundreds of elements without having to use a scroll bar or the dreaded “Next” button. The holistic view they provide instantly answers questions such as “Are all the picks in one industry?” or “Are they all small caps?” The zooming, grouping and sizing present the results as a random dartboard for easy visual analysis.
The Results Breakdown
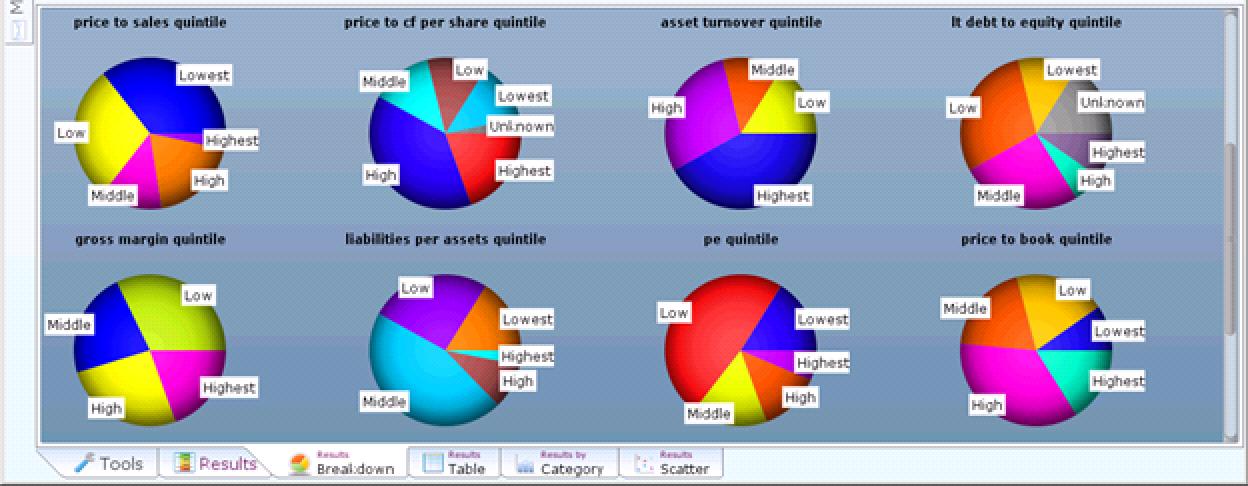
The results breakdown panel presents an instant overview of all the holdings, whether there are five of them or 500. A series of pie charts on the chosen tear sheet (a customizable display of information) shows how the results are divided on those criteria. The screen shot below shows how the selected stocks rank on a variety of key ratios.
The Results Grid
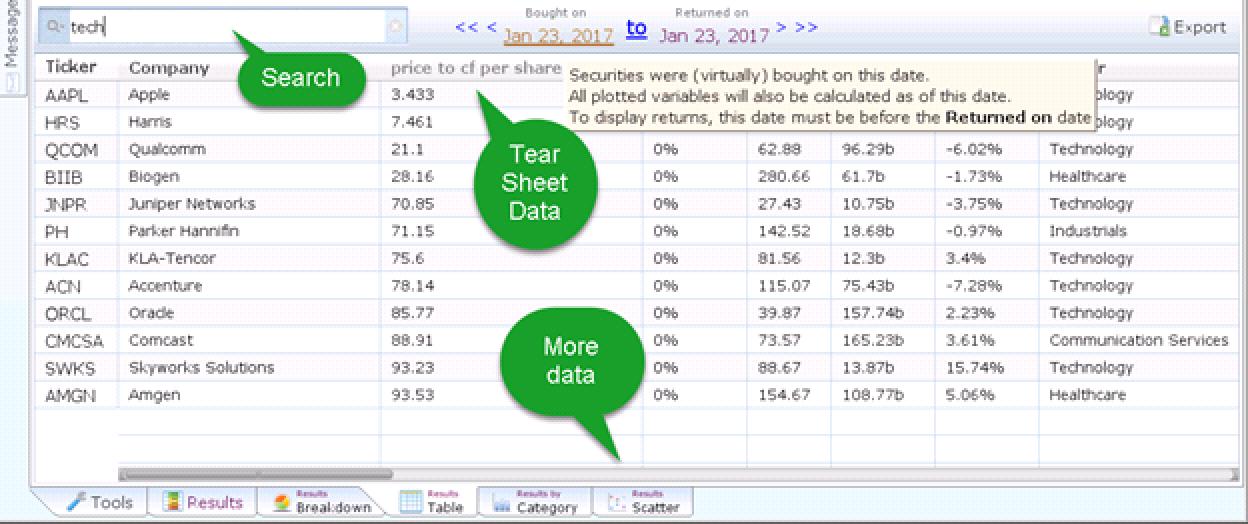
The results grid presents all the results in a table, together with any of the information in the tear sheet, as well as any of the variables chosen to be plotted. The tear sheet provides a user-configurable panel of HTML together with a collection of fields or formulas to be plotted. For instance, a tear sheet might consist of selected balance sheet elements, as well as industry averages. The search and sort enable easy understanding of the results (even if there are a hundred columns), and Excel export supports more advanced analysis.
Backtesting
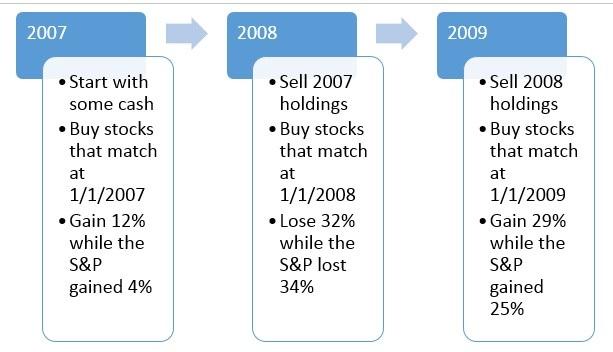
A backtest is a simulation of the results of an investment strategy. Starting at the beginning date, the backtest calculates which stocks would have been bought each period, and computes what the returns would have been, refreshing after each period to simulate the portfolio over time. The picture below depicts a yearly rebalance of the composite value strategy above for the years 2007–2010.
Edit the Backtest Parameters
Simulation is the art of emulating some factors and ignoring others. Backtests typically start simple: Equally weighed purchases of stocks at the beginning of each year (as in the infographic above). Equal weighing prevents one position from dominating the whole portfolio, and gets good results (as compared to other weighting methodologies, like price-weighting), on average. Equities Lab lets users change the following:
- When holdings are rebalanced,
- Stop losses and stop gains,
- Minimum and maximum holding periods,
- Picking the top N holdings from the matches,
- Forcibly selling if conditions are met,
- Changing the portfolio weights,
- Trading costs,
- Lagging the strategy to model investor sloth,
- Which stocks are considered in rankings,
- And more.
The Backtest Results
A strategy needs to satisfy a variety of criteria in order to be investable:
- Does it get good overall performance and beat its chosen benchmark? It’s important to choose the right benchmark, which could be either the S&P 500, a particular stock, another screen, a bit of Quandl data or a custom formula.
- Does it get consistent performance? Strategies that perform well one year and lag the rest tend not to work well going forward, as the single year is usually a fluke.
- Does it buy the right sorts of stocks for the strategies? A value strategy that somehow bought Tesla would need to be examined carefully.
The Performance Chart
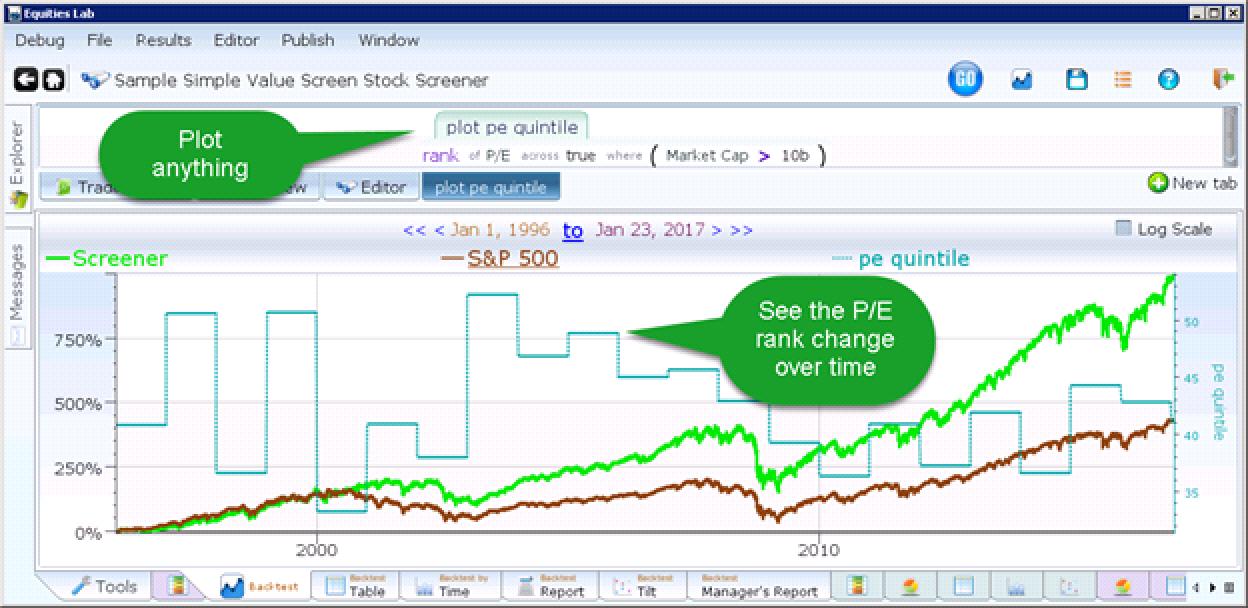
Does the strategy perform? Yes, it does (notice the green line in the chart below is above the brown line). Does it always buy low P/E stocks? No, not always (notice the blue stair-step line, which says P/E values are middling).
The Statistics Panel
Numbers tell a story. Looking at the screen shot below (notice the 0.206 Sharpe ratio, 56% outperformance and similar standard deviation), the numbers say that this value composite screen outperforms the S&P 500 index 56% of the time, enjoying a higher risk-adjusted return and similar volatility.
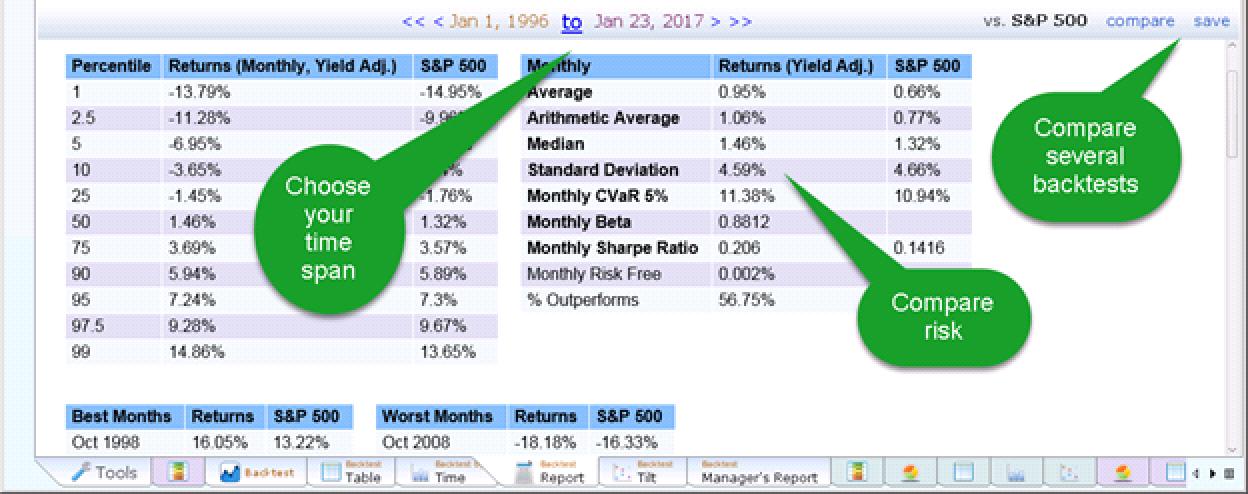
A percentile breakdown of the positions, the maximum drawdown, average holding period, average portfolio size and other statistics are all below the visible page in this screen shot.
The Backtest Tilt
Imagine a chart that showed the strategy’s performance versus the benchmark (here chosen to be the S&P 500) each week in the simulation. This chart put a dot on the chart for each week, putting all weeks where the benchmark did well on the right and all weeks where the strategy did well at the top (both axes are labeled by percentage gain). A week where the S&P 500 outperformed would go in the lower right, while a week that saw the strategy outperform would go in the upper left. This chart shows how the strategy did in good times and bad. It might look something like this:
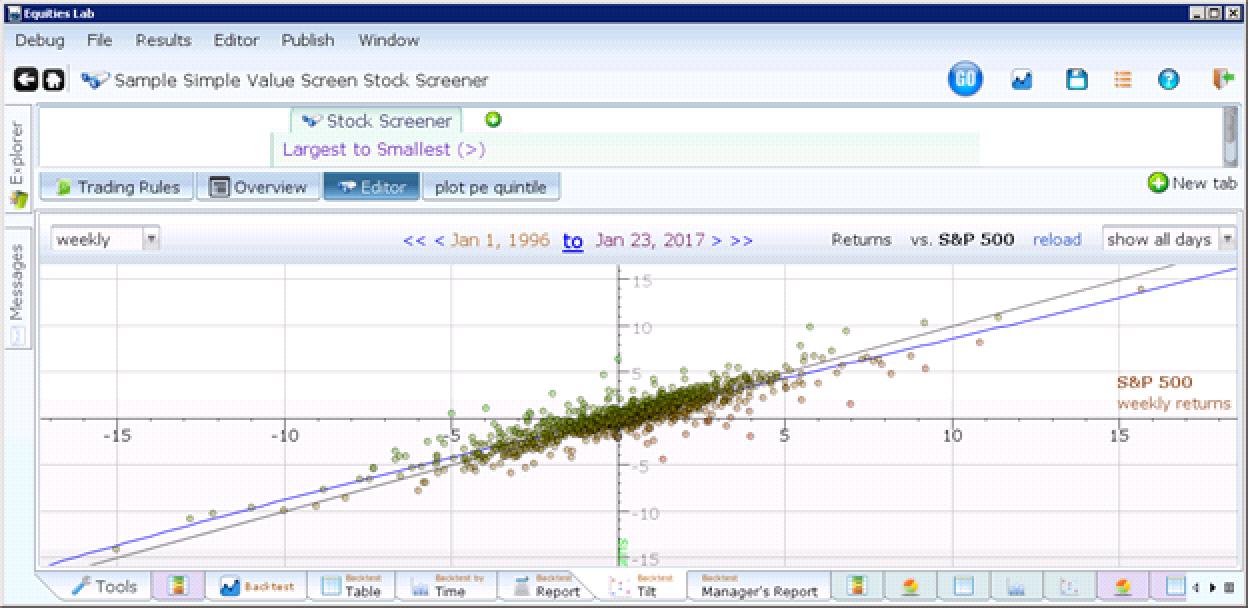
The blue line is the slope of the dots. That the blue line is lower than the gray line on the right but above on the left indicates that this screen outperforms in bad times and lags in good times.
The Positions Table
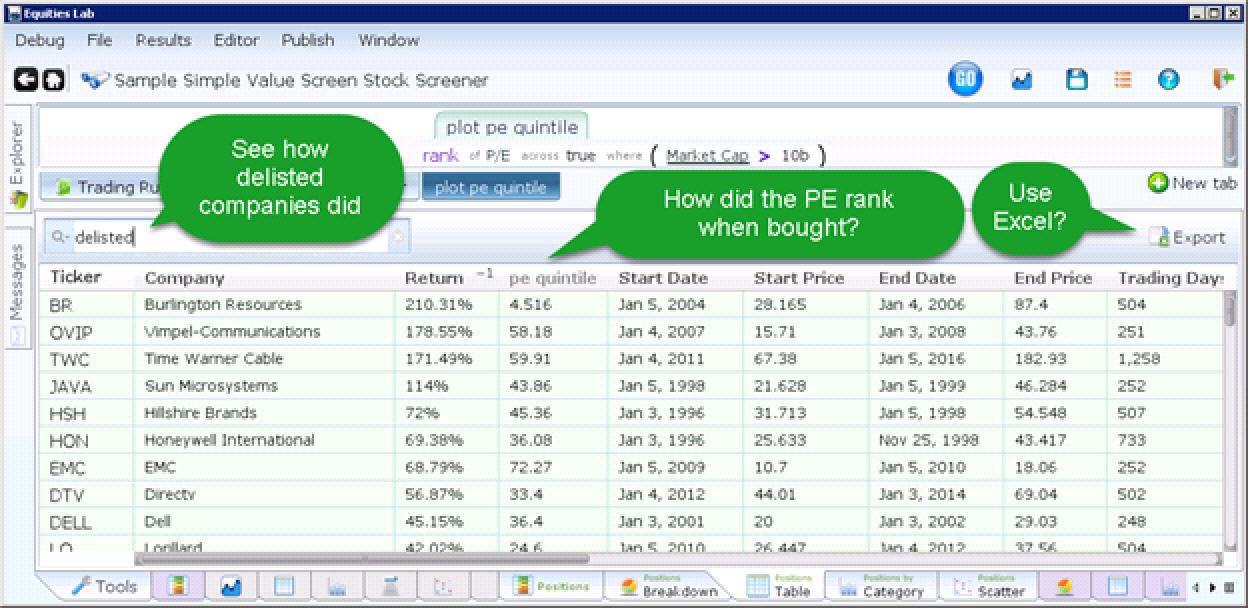
It’s time to search through, sort and examine the trades that the strategy would have made. Notice that there are companies here (Sun Microsystems) that are nothing but memories. Investment software that fails to account for the results of dead companies has a problem known as “survivorship bias.” This problem (seen in the results presented by successful mutual funds) skews results because dead companies are fundamentally different from live ones: the dead companies are dead. Equities Lab includes both live and dead companies and thereby avoids this bias.
The Positions Breakdown
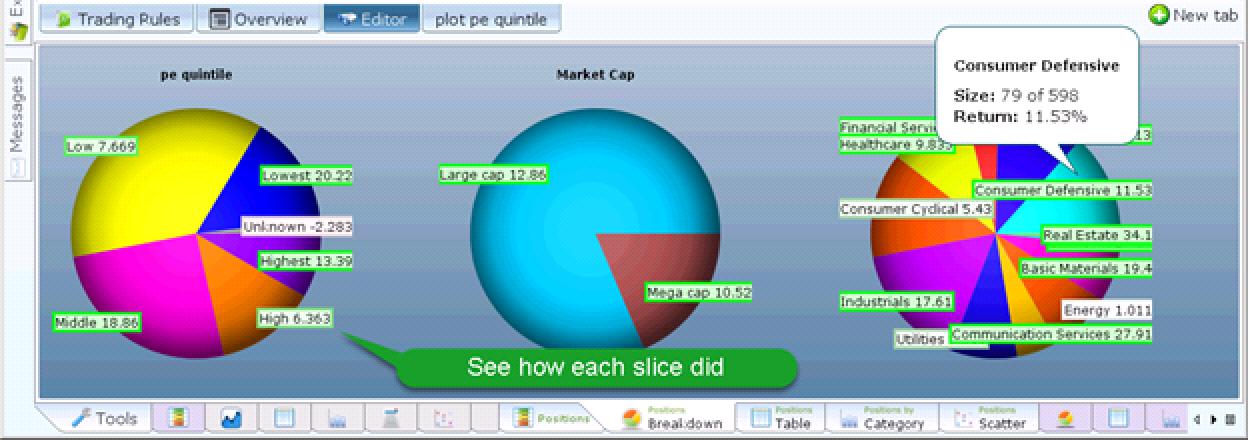
The screen shot below shows that the screen covers all sectors, focuses on mostly large-cap stocks and that the P/E (price-earnings) ranks cover the range, while focusing on the low end. The simulation put on almost 600 positions over the 21-year span, and most of them ended up with a positive return (notice almost all the wedges are labeled with positive numbers). This simulation did not include trading costs (though it is an easy option to set). If each trade has a slippage of 0.2%, as one might find at a low-cost brokerage, the results will be about 0.4% less annually than before.
Each wedge is decorated with the average return of all positions that ended up in that wedge.
Does Momentum Make this Strategy Go Further?
This screen outperforms but may be able to do better. Does momentum help? Below is amomentum factor called the stochastic oscillator in one line:
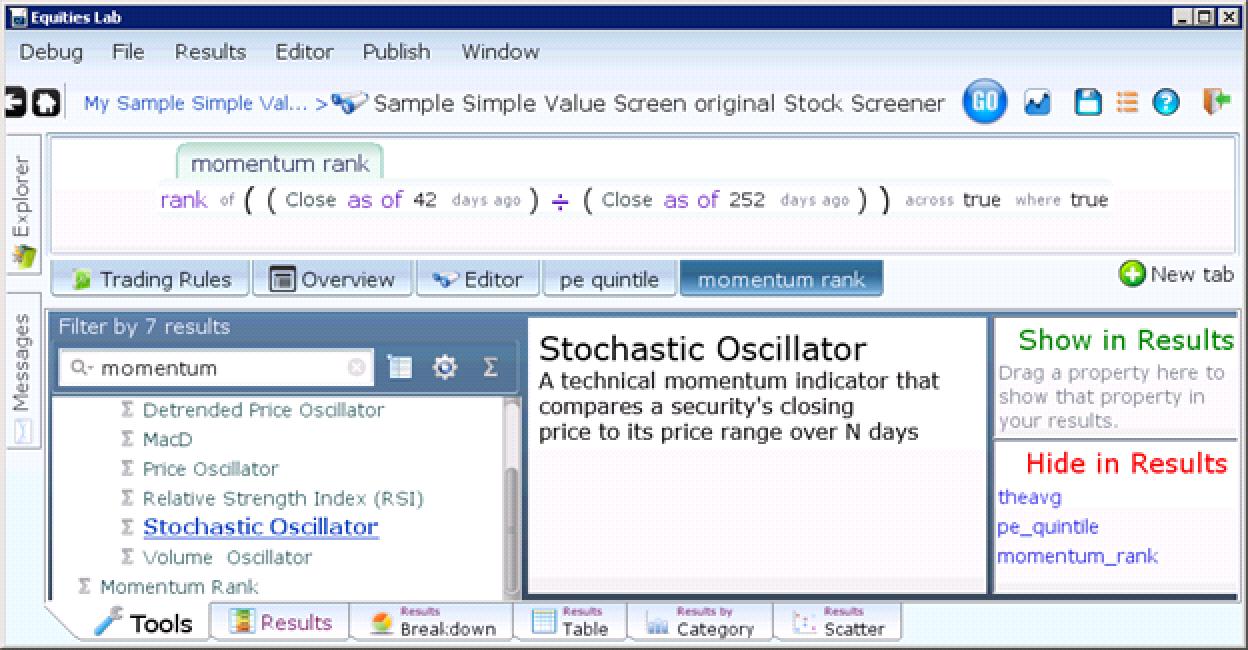
Half the financial world uses momentum in their algorithms. This one excludes the last two months of performance because of short-term mean reversion effects.
Plotting this momentum rank (by dragging it into the “Show in Results” area) and running the backtest again returns results where the momentum rank of each stock is recorded as it was (hypothetically) bought. A scatter chart shows how each trade worked out, based on its momentum rank:
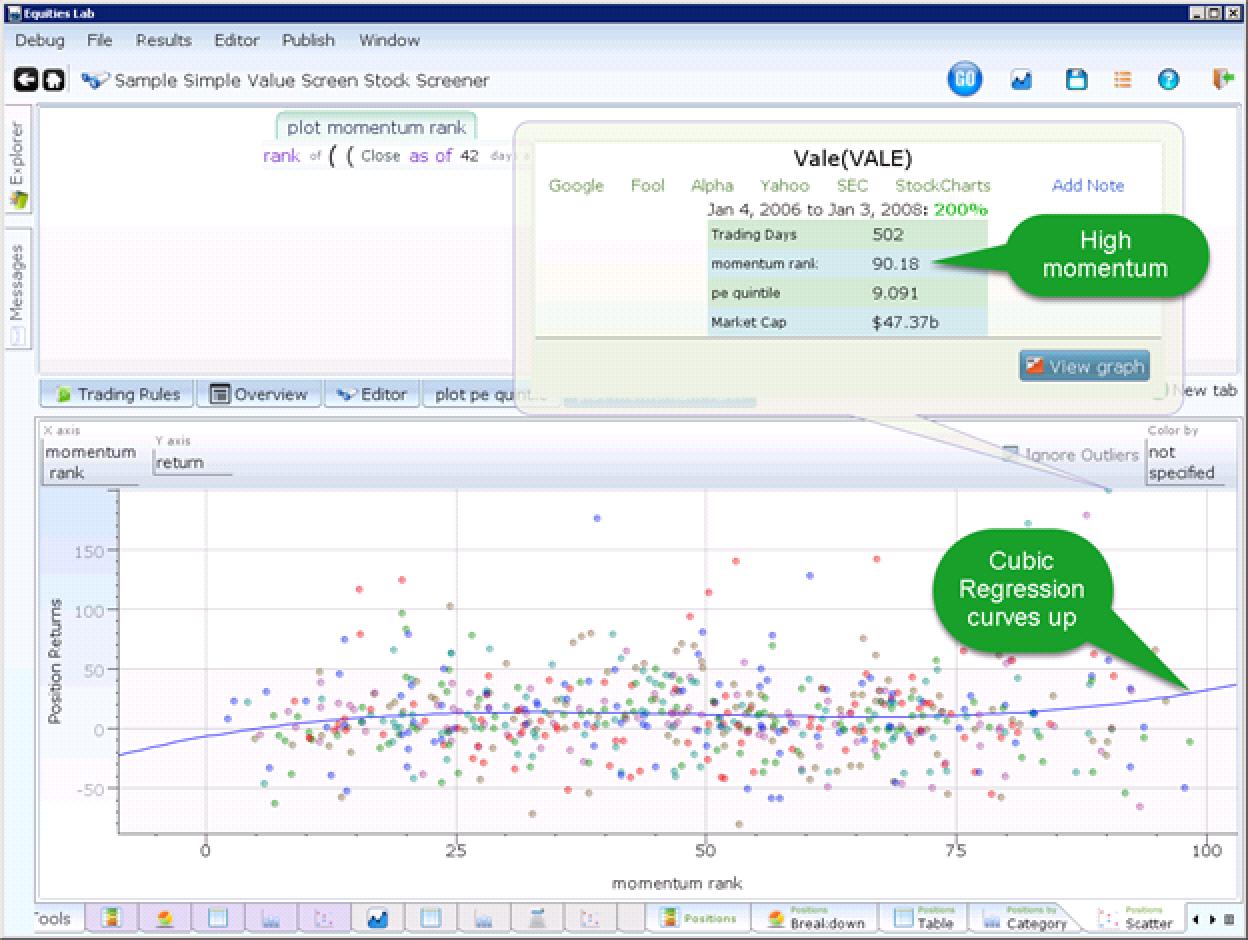
The correlation (look at the blue line) is small but there, meaning users should avoid low momentum ranking. The blue line sums up the results of the scatter chart by trying to draw a simplified line that is as close to as many dots as possible. Adding momentum results in the dual ranked screen below:
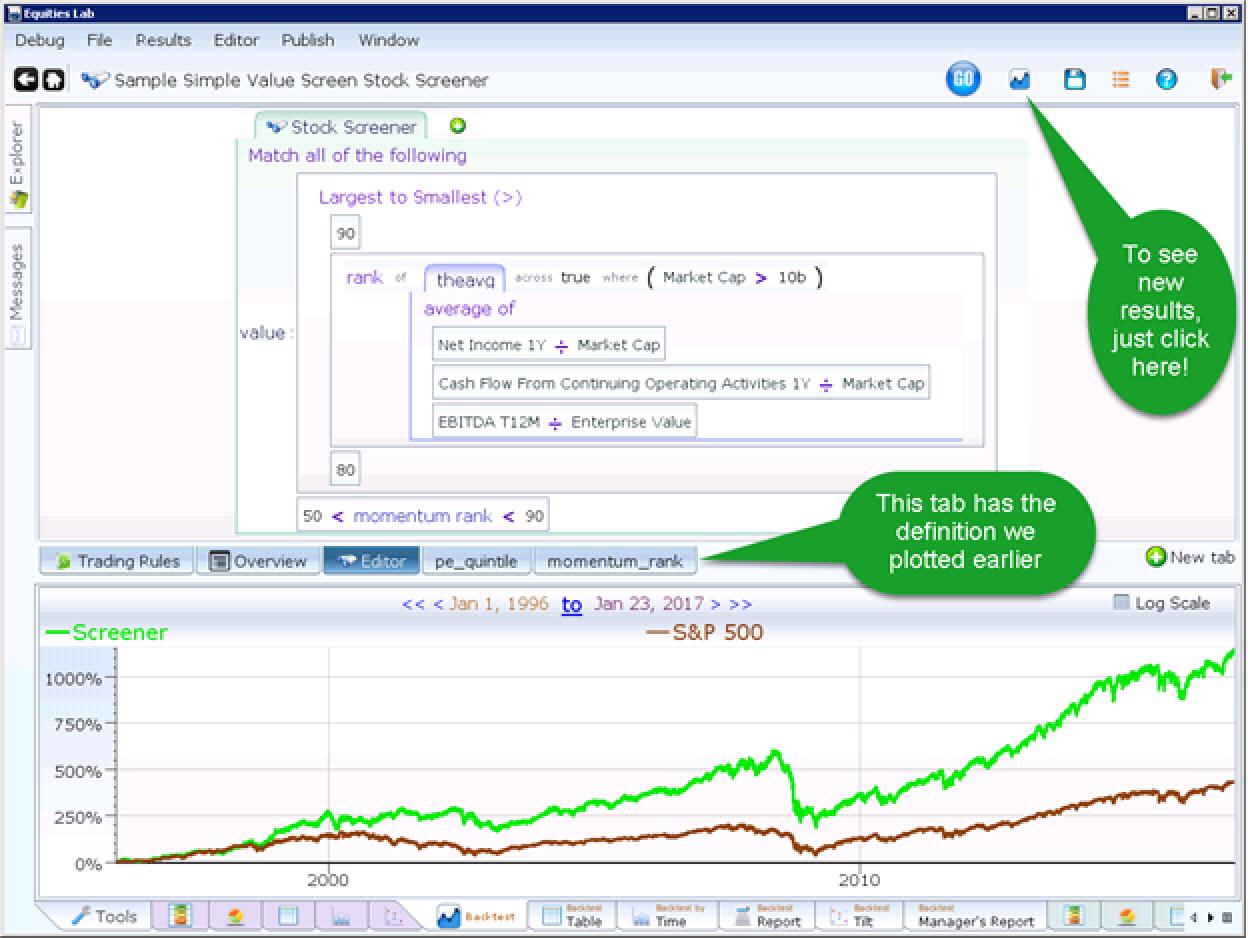
This is a complicated screen. It ranks the stocks in the U.S. market on two factors: momentum and composite value. Only stocks in the sweet spot for both factors are retained.
Does This Outperform?
This does outperform the older screen that we created before adding momentum. That said, the performance is not much better. Worse, when we check the backtest by time tab, we see that the outperformance is concentrated before 2008. This implies that momentum (applied to this strategy) worked better in the past than the present
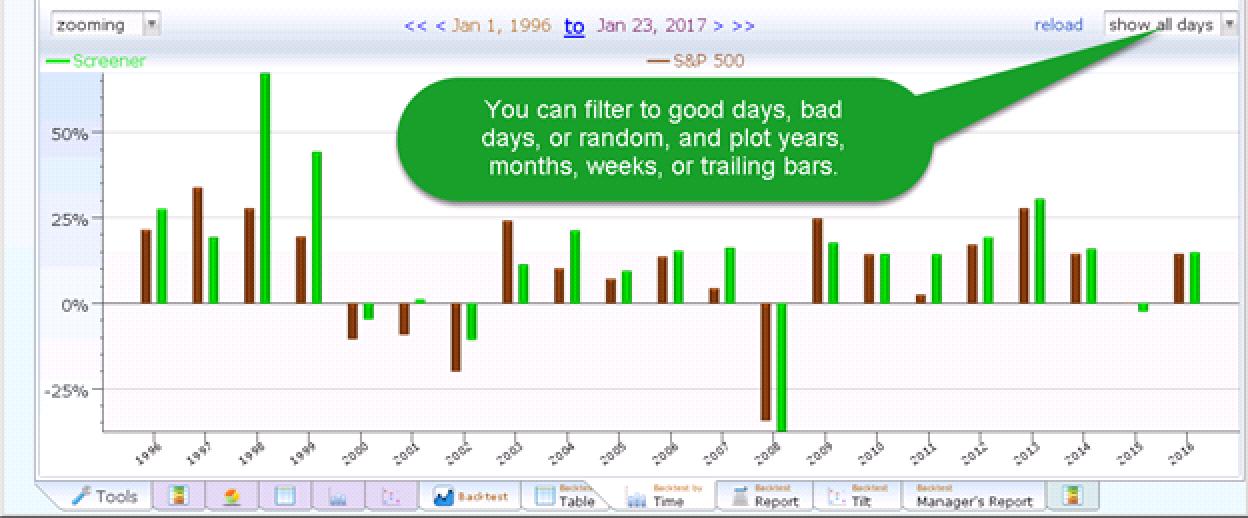
That’s not true for the original screen, and the Sharpe ratio (which is return minus the risk-free rate divided by volatility) of the newer screen is lower, meaning that this screen clearly does not measure up (higher Sharpe ratios are better).
Analyzing Stocks
Equities Lab also analyzes and charts individual stocks. Typing either CMCSA or Comcast into the “Research a stock” screen results in the screen below.
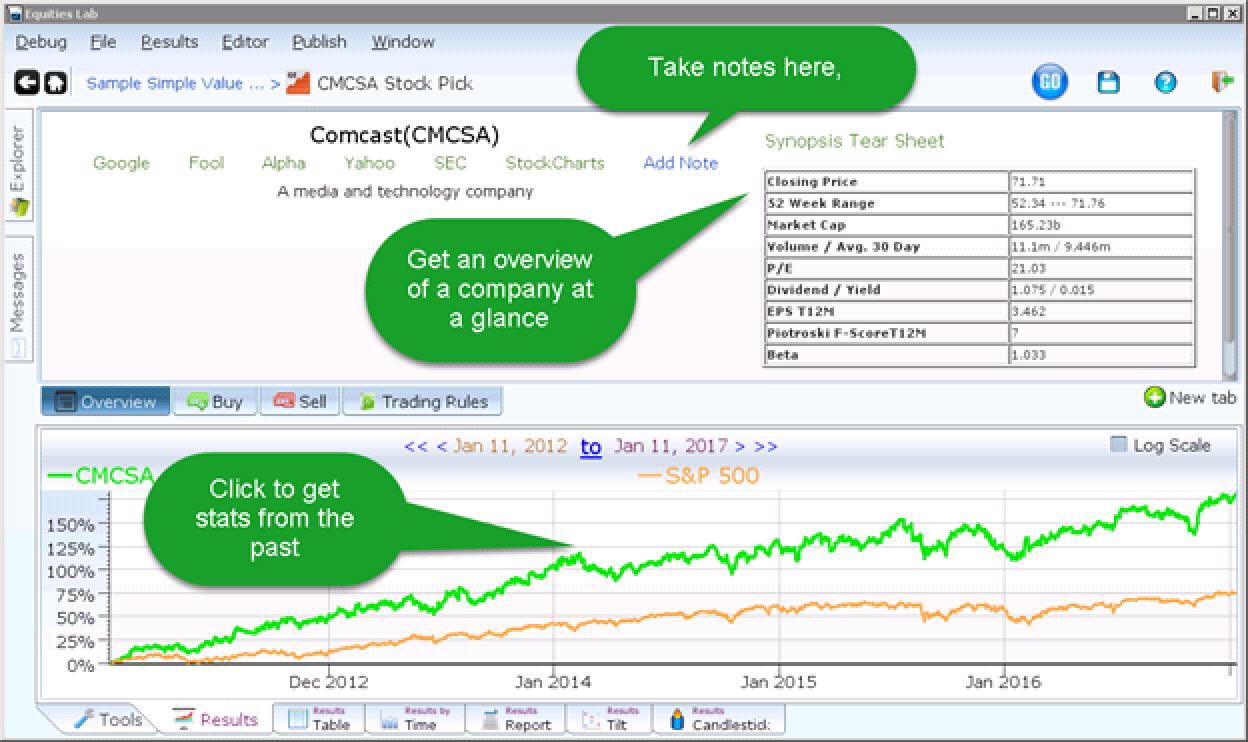
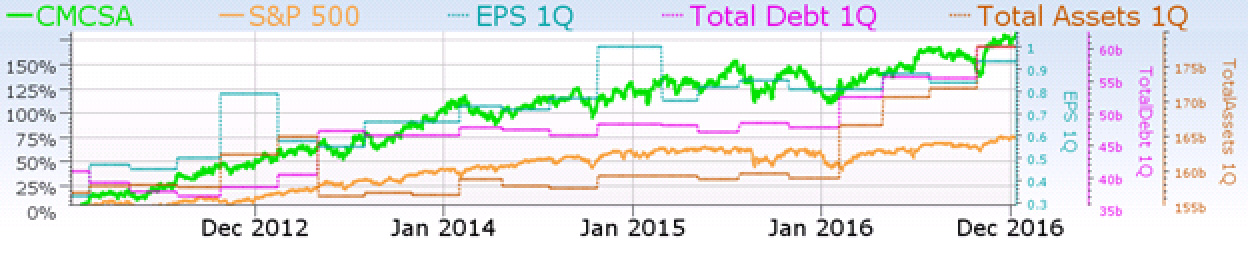
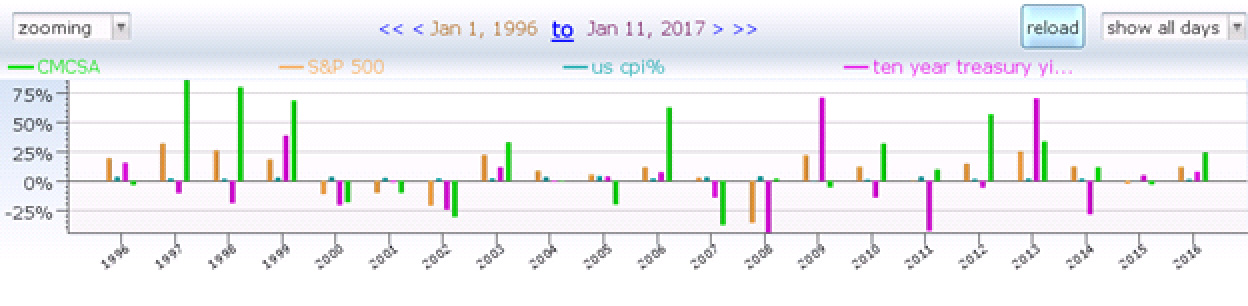
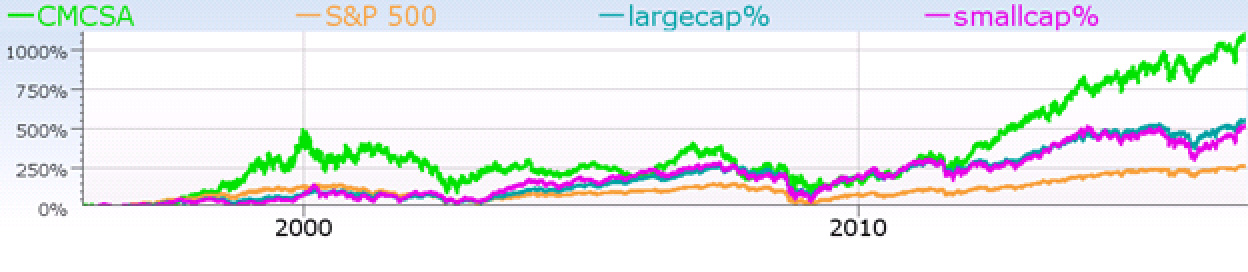
Graphs show price history. In Equities Lab, they can also show other data changing over time:
Add other stocks—see how they compare;
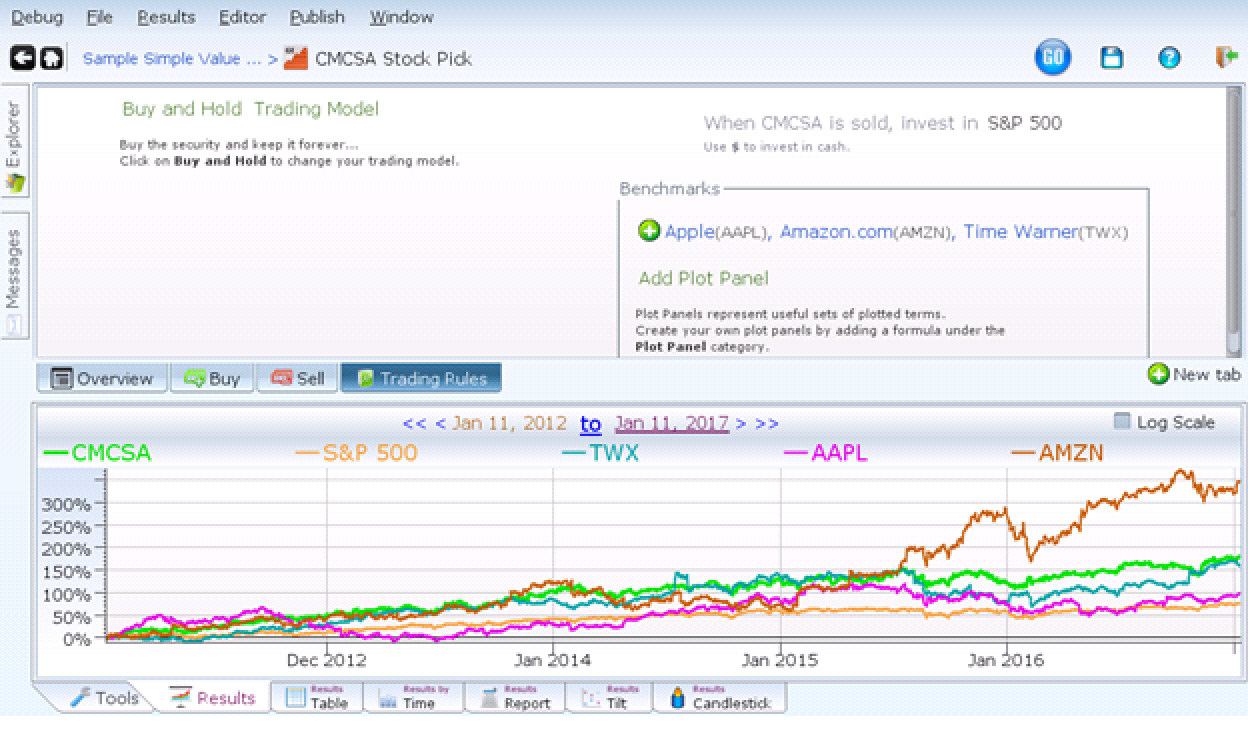
Add financial data—see if the earnings explain the future stock price;
Add macroeconomic data—see if the stock beats inflation, or responds to the 10-year Treasury yield,
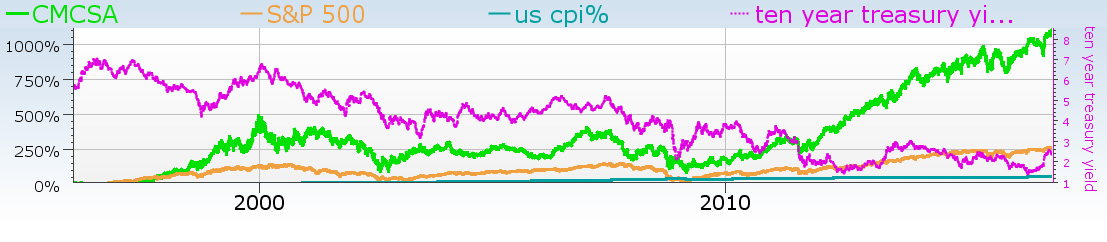
Or, seen another way;
Add other strategies—watch Comcast crush both the large- and small-cap stocks, getting similar performance to the screen covered above.
Making it Real
A winning strategy is worthwhile only if it is put into practice and still succeeds. It can be easier to trade a strategy that ranks the matches and keeps the top 10 (or however many are desired). If the choices are ranked by market cap (to reduce slippage), the performance stays about the same, but trading it is much easier.
Putting a screen into practice is as easy as clicking on the “create watchlist” button from within the screener.

Name it, and it the watchlist can keep track of any buys and sells made to follow the strategy. When it’s time to update the holdings (every January, as defined in the Trading Rules tab for this particular strategy), the screen will look something like this:
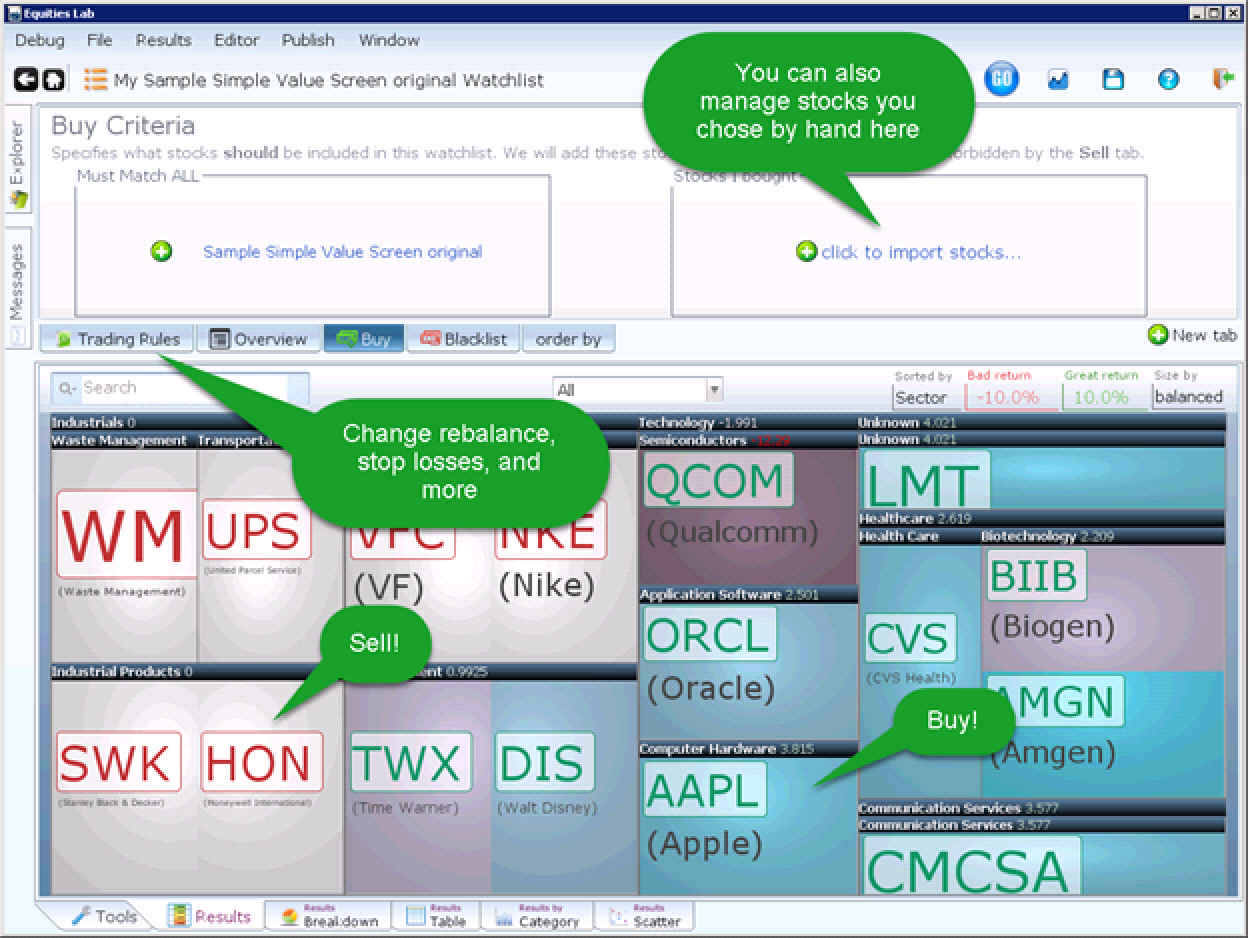
The watchlist directs the user to sell stocks with red text, and buy stocks with green text. In this example, the user should buy for Disney (DIS), Apple (AAPL) and others, while selling UPS (UPS), Nike (NKE), Waste Management (WM) and others. Unless users specify otherwise, boxes start equal-sized, and then, after they are bought, grow or shrink as a proportion of the total portfolio.
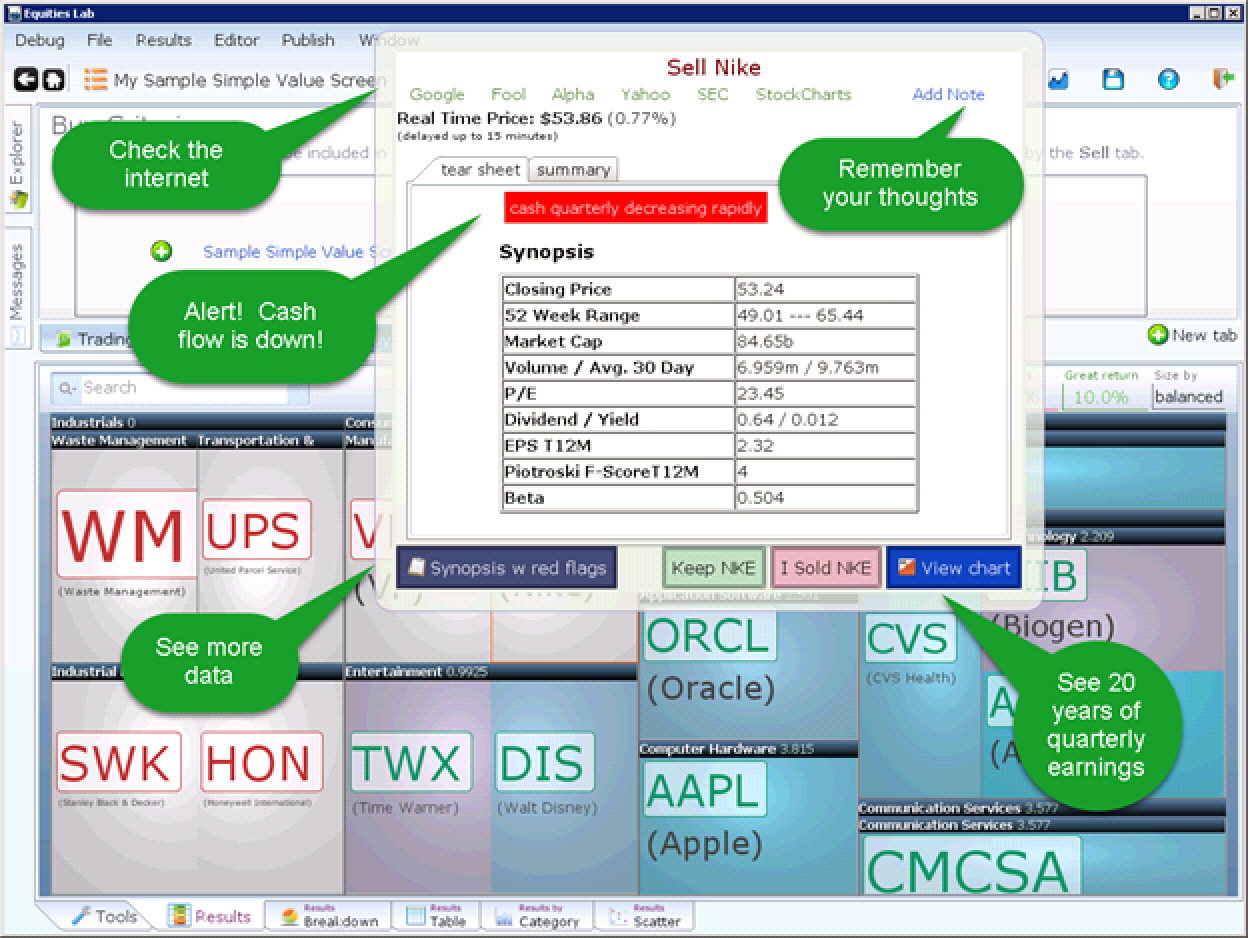
Once a decision about Nike is made—either to keep it (green button) or sell it (red button) —it no longer needs attention. The exact same process helps users buy (or reject) the stocks shaded in purple and blue.
Conclusion
Equities Lab provides a complete fundamental and technical toolbox: everything needed to create, modify and use trading systems. It also provides everything needed to do a deep dive into a stock, or to power a hybrid strategy that is part discretionary trading and part screen. Using Equities Lab will build market wisdom as it becomes more apparent what works, what doesn’t and when.
Equities Lab is currently available for $50 a month, with a limited tier and a premium tier available. It also can be used in the classroom, for $25 per student per semester, complete with the ability to assign homework that is answered with a trading strategy. Equities Lab gives students feedback on whether their strategy meets the criteria, and a chance to try again before submitting their answer. Check out www.equitieslab.com for more information.
Discussion
FREE REPORT

No comments have been added yet. Add your thoughts to the discussion!
You need to log in as a registered AAII user before commenting.
Log InCreate an account