


Assume, with certainty, the S&P 500 index will increase 5% over the next year under average volatility conditions.
You have the option of buying the index or one of three leveraged exchange-traded funds (LETFs) that will magnify the index return on a daily basis by two times, three times or four times. Which fund should you purchase?
Even if you know that these fund’s leverage multiples tend to fall over time, with a guaranteed 5% increase the apparent answer is the four times fund. However, not only will this be the worst-performing fund of the group, it will also lose money. The two, three and four times funds will have average returns of 5.66%, 3.94%, and –1.05% respectively. Instead of making 20% with the four times fund, you will lose 1%.
The Basics
Leveraged ETFs are designed to return a daily multiple ranging from positive three times to negative three times on an underlying index, although there are a few that return a monthly multiple. The underlying indexes are primarily the most popular: the S&P 500, Arca Gold Miners Index, and the Nasdaq 100. With more than 270 LETFs totaling in excess of $40 billion, the ability to find a leveraged fund on a particular index is usually not difficult.
Although there have been leveraged mutual funds since 1993, the first leveraged ETF was not introduced until 2006. Since that time, they have become increasingly popular—more than 160 additional LETFs with assets of more than $23 billion have been created since 2014, according to Kate Stalter on Forbes.com (January 2017). Stalter added that these funds’ cumulative assets exceed $23 billion. In May 2017, the Securities and Exchange Commission (SEC) approved new four times and inverse four times leveraged ETFs, though the decision is being reconsidered as of early June 2017.
One of the idiosyncrasies of leveraged ETFs is the constant daily leverage that generally causes realized leverage to decay over time. As an example, assume an underlying index increases 10% then falls 5% for a two-period return of 4.5%. A three times LETF would gain 30% (10%  (SSO) 3) and then fall 15% (5% (SSO) 3) for a two-period return of 10.5%. The fund’s realized two-period leverage ratio would be 2.33 (10.5% ÷ 4.5%) instead of 3.0. Thus, even though an investor takes on three times the risk, only 2.33 times the return is realized. This leverage decay over time is a function of the initial leverage, return trend and volatility, with the last usually being the overwhelming factor. However, as I showed in The Journal of Index Investing (Volume 1, Number 4, 2011), the trend should not be ignored since with enough return trend, the effective leverage can be much greater than the daily leverage ratio might imply.
Figure 1 is a great example of what these funds can do to both create and destroy wealth. Using the Center for Research in Security Prices (CRSP) S&P 500 value-weighted index, the chart shows the value of investing $1 in the index as well as in a hypothetical two, three and four times leveraged ETF from January 2005 to December 2016. A 1.0% expense ratio for the LETFs is assumed as they have higher expenses than the typical ETF.
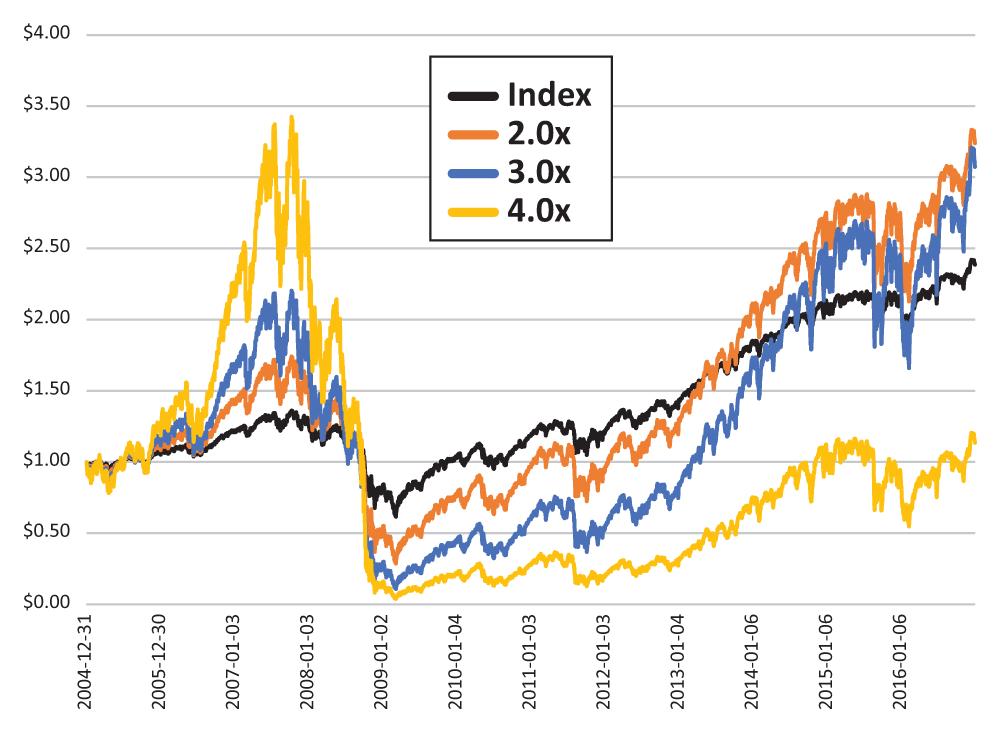
From January 3, 2005, to October 9, 2007, while the index increased 36%, the two, three and four times LETFs increased 77%, 126%, and 254% with effective leverage ratios of 2.14, 3.48, and 7.00 respectively. This is where leveraged ETFs really shine: A high return trend (in the right direction of course) with low volatility. However, these funds can destroy wealth as quickly as they create it. By March 6, 2009, the market had fallen 55% while the two, three and four times LETFs declined by 84%, 95%, and 99% respectively. Even with a steady increase in the S&P 500 value-weighted index since that time, the four times LETF still has not recovered. The two and three times LETFs are now well ahead of the index once again, however.
This is not just theory. ProShares UltraPro S&P500 (UPRO), a three times leveraged ETF on the S&P 500 introduced in June of 2009, had a cumulative total return of 1,045% by the end of 2016 relative to the 183% gain in the S&P 500. ProShares Ultra S&P500 (SSO)—a two times leveraged ETF that had a more inauspicious start by being introduced in June of 2006 before the financial crisis—is still up 149% compared to the 121% gain in the S&P 500 over the same period. However, since June of 2009, similar to UltraPro, Ultra S&P500 did very well with a cumulative return of 504%.
The Details
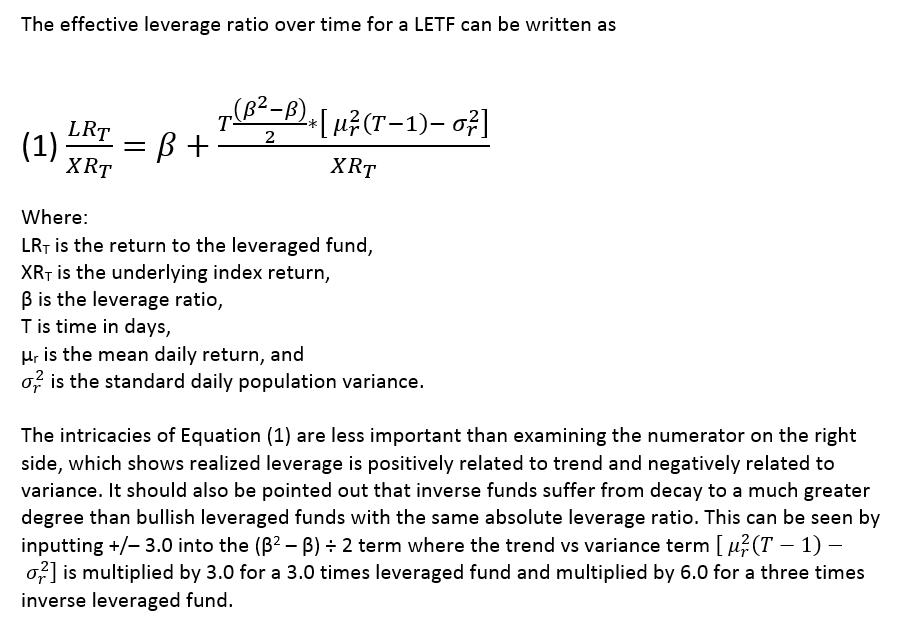
An addendum to this article explains mathematically how the effective leverage ratio over time for an LETF can be written as a formula. Those of you without a background in math can take comfort in the fact that the intricacies of the equation are less important than understanding that realized leverage is positively related to the trend of returns and negatively related to variance in returns.
It should also be pointed out that inverse funds suffer from decay to a much greater degree than bullish leveraged funds with the same absolute leverage ratio.
Figure 2 shows how devastating volatility can be on inverse funds. The chart shows returns for the period of January 2, 2008, to December 31, 2009. Over this period, the market fell 19%. At its low point, the S&P 500 fell 51% from January 2, 2008, to March 6, 2009. By March 6, 2009, inverse funds performed well with the inverse one, two, three and four times LETFs up 66%, 130%, 161%, and 152%, respectively. The outperformance of the inverse three times fund relative to the inverse four times fund suggests that volatility decay more than offsets a negative trend beyond going inverse three times leverage.
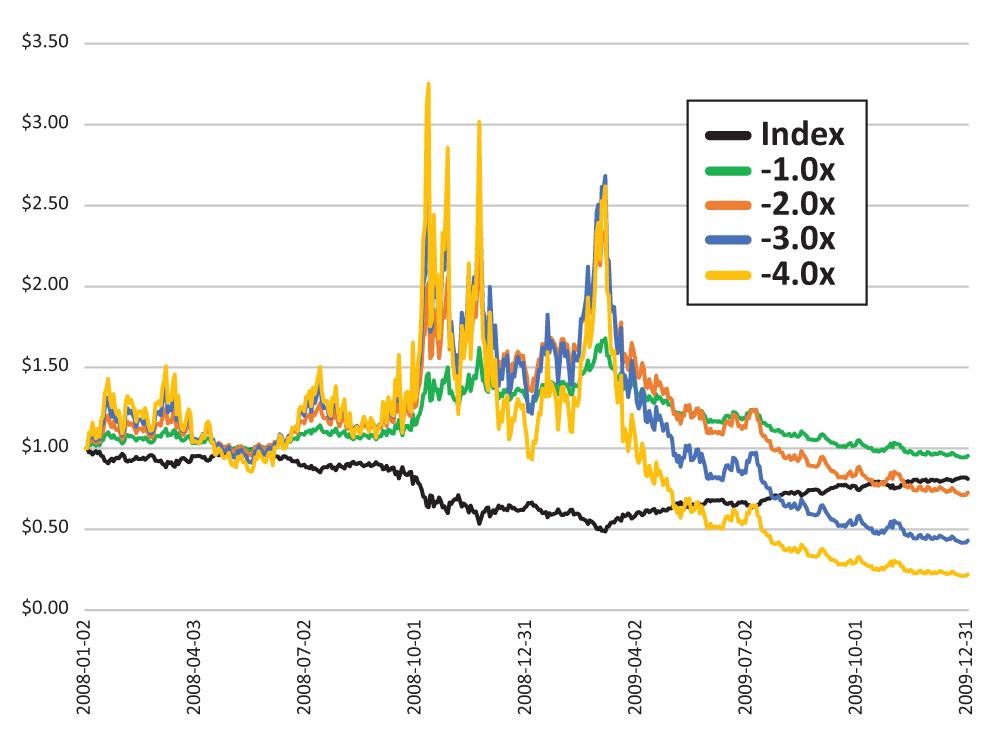
The market timing aspect of inverse leveraged funds needs to be fairly precise. The market was down 19% by the end of 2009 relative to January 2, 2008. The inverse one, two, three and four times LETFs were also all down: –5%, –27%, –57%, and –78%, respectively. Only the inverse one time LETF outperformed the market, though it was still down. Thus, despite making a correct market call and buying inverse funds, an investor still would have lost money over this two-year period.
Trend Versus Volatility
To attain a better idea of what an investor can expect to earn with LETFs, Table 1 shows the expected return volatility trade-off for two times leveraged ETFs to inverse four times LETFs for 12 months. With low volatility and medium or high trend, increasing leverage is associated with increasing returns, as can be seen when volatility is only 12%.
Table 1. Expected One–Year Returns
| The one–year returns a leveraged ETF can be expected to realize given a specific multiple of leverage, level of volatility and return for the underlying index. | |||||||
| Index Return | One-Year LETF Return (%) | ||||||
|---|---|---|---|---|---|---|---|
| 2x | 3x | 4x | –1x | –2x | –3x | –4x | |
| 12% Volatility | |||||||
| –20% | -37.5 | -51.5 | -62.8 | 22.0 | 48.0 | 77.1 | 108.9 |
| –10% | -21.0 | -30.9 | -40.5 | 8.4 | 17.0 | 24.4 | 30.3 |
| 0% | -2.4 | -5.2 | -9.3 | -2.4 | -5.2 | -9.3 | -14.4 |
| 10% | 18.1 | 26.1 | 32.8 | -11.3 | -21.7 | -31.9 | -41.6 |
| 20% | 40.5 | 63.7 | 88.1 | -18.7 | -34.2 | -47.6 | -58.8 |
| 18% Volatility | |||||||
| –20% | -38.7 | -54.1 | -66.7 | 19.8 | 40.3 | 59.0 | 74.5 |
| –10% | -22.4 | -34.6 | -46.7 | 6.5 | 10.9 | 11.7 | 9.0 |
| 0% | -4.2 | -10.2 | -18.6 | -4.2 | -10.2 | -18.6 | -28.6 |
| 10% | 16.0 | 19.5 | 19.2 | -12.9 | -25.8 | -38.9 | -51.3 |
| 20% | 38.0 | 55.1 | 68.8 | -20.2 | -37.7 | -53.0 | -65.7 |
| 24% Volatility | |||||||
| –20% | -40.2 | -57.5 | -71.5 | 16.8 | 30.0 | 36.6 | 35.5 |
| –10% | -24.3 | -39.4 | -54.2 | 3.8 | 2.8 | -3.9 | -15.3 |
| 0% | -6.6 | -16.9 | -30.2 | -6.6 | -16.8 | -30.1 | -44.7 |
| 10% | 13.1 | 10.8 | 2.4 | -15.1 | -31.2 | -47.5 | -62.2 |
| 20% | 34.5 | 43.8 | 44.9 | -22.2 | -42.3 | -59.6 | -73.4 |
Using the historical volatility average of 1.14% daily (18% on an annualized basis) tells a different story. With the index up or down by 10%, increasing returns stop at positive three times and negative three times leverage, respectively, given a correct market call. With high volatility (24% volatility), which is usually associated with declining markets, the –1.0x leveraged ETF is the highest returning fund when the index experiences a 10% decline. Even when the decline worsens to 20%, the inverse four times LETF still lags the return of the inverse three times LETF. With market increases of 10% and high volatility, only a two times LETF could be justified. In essence, even with high trend, high volatility counteracts the effect beyond +/– three times, and sometimes one times or two times, for one-year holding periods.
Table 1 demonstrates the significance of decay for long-run leveraged ETF returns. However, the providers of LETFs generally state that their funds should be used for short-term trading goals. Table 2 shows the returns (not annualized) for three months given average market volatility. The results show that LETFs do well for large market moves over a short time period. For example, a three times leveraged ETF returns approximately three times the index for a 10% increase. For a 20% return, a three times fund returns 68%, giving a realized leverage ratio of 3.4. Conversely, for incorrect market calls, leveraged ETFs can be equally painful.
Table 2. Three–Month Expected Returns for Average Volatility
| The three–month returns a leveraged ETF can be expected to realize given a specific multiple of leverage, level of volatility and return for the underlying index. | |||||||
| Index Return | One-Year LETF Return (%) | ||||||
|---|---|---|---|---|---|---|---|
| 2x | 3x | 4x | –1x | –2x | –3x | –4x | |
| 18% Volatility | |||||||
| –20% | -36.7 | -50.3 | -61.3 | 23.6 | 51.8 | 84.9 | 123.3 |
| –10% | -19.9 | -29.1 | -37.8 | 9.9 | 20.2 | 30.3 | 40.1 |
| 0.0 | -1.0 | -2.6 | -5.0 | -1.0 | -2.6 | -4.9 | -8.0 |
| 0.1 | 19.7 | 29.6 | 39.1 | -10.1 | -19.6 | -28.7 | -37.3 |
| 0.2 | 42.4 | 68.1 | 96.7 | -17.6 | -32.5 | -45.2 | -55.9 |
An Index Substitute
As the results in this study show, LETFs are very risky assets as a buy-and-hold asset. However, their option-type qualities could be used as an index substitute. For example, a 60%/40% stock-bond portfolio could be replicated with a much smaller position in either or both positions, as there are bond LETFs as well. Consider a three times LETF on the S&P 500. Since it has three times leverage, only a 20% investment is required to attain 60% exposure. The remainder could be invested in a bond position creating a 20/80 position that still attains 60% equity exposure, while allowing twice the amount in a relatively safe bond fund. In addition, when the market does very well, the realized leverage from using the LETFs and the greater percentage of wealth in the bond position may make up for the leverage decay and possibly boost returns over time.
To maintain the correct exposure, the LETF position needs to be periodically rebalanced as an increasing market quickly creates too much exposure, and a decreasing market too little. Although this occurs in a standard 60/40 portfolio, it occurs to a much greater degree when using leveraged ETFs. To account for this, monthly rebalancing is assumed so that the 60/40 exposure remains relatively constant for all the portfolios.
Figure 3 compares an investment of $1 in a 60% stock/40% bond portfolio, a 30%/70% using a two times leveraged ETF, a 20%/80% using a three times LETF, and a 15%/85% using a four times LETF over the last 20 years. Vanguard’s Total Bond Fund (VBMFX) is used as the proxy for the bond position.
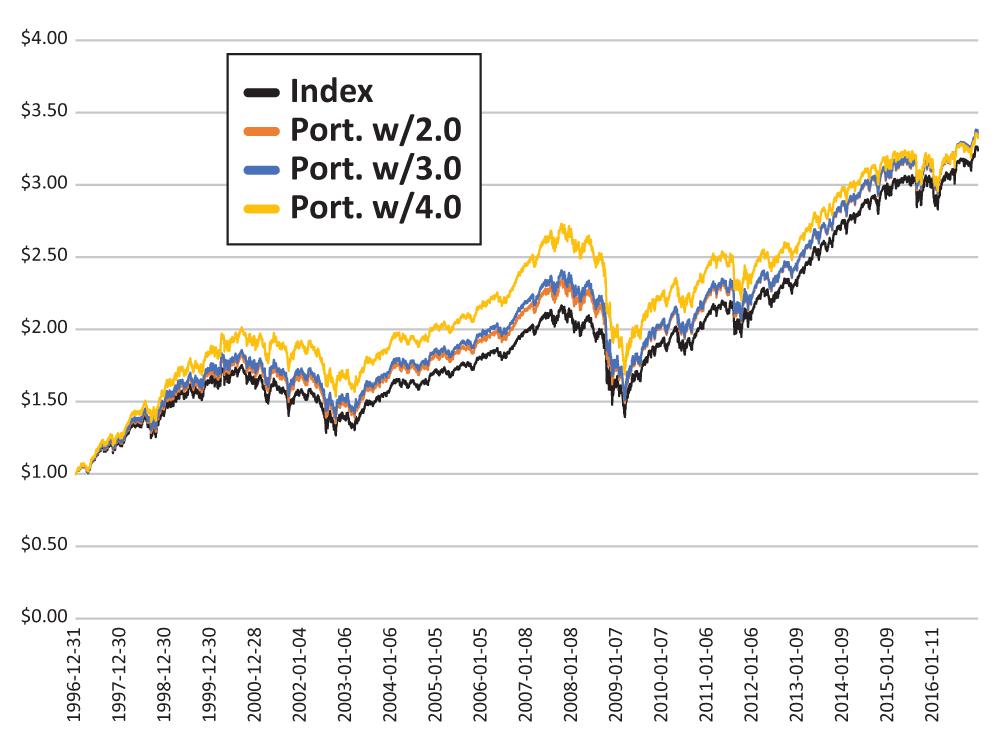
The portfolios are 60% stock /40% bond, 30% LETF/70% bond using a two times leveraged ETF, a 20% LETF/80% bond using a three times LETF, and a 15% LETF/85% bond using a four times LETF from 1997 to 2016. Vanguard’s Total Bond Fund (VBMFX) is used as the proxy for the bond position. Portfolios are rebalanced monthly.
(VBMFX) is used as the proxy for the bond position. Portfolios are rebalanced monthly.
All three leveraged ETFs have a higher ending value, although the two times portfolio does just as well as the three times one and both do just slightly better than the four times portfolio. This time frame includes two significant market declines, so the rebalancing allows the investor to take advantage of the leverage for market rebounds while keeping risk to a manageable level as the market increases.
However, if one examines just the last 10 years, all three LETF/bond portfolios underperform a simple 60/40 portfolio. The leveraged ETF losses in 2008 and early 2009 coupled with the low interest rate policies from the Federal Reserve have not given LETF portfolios the ability to counteract the leverage decay and higher expense ratios.
For robustness, the last 90 years of daily return data is re-sampled 10,000 times for the S&P 500 and one-year Treasuries. Table 3 gives the results for one-year holding periods along with the returns for 100% in the S&P 500 and one-year Treasuries for comparative purposes. A 1.0% expense ratio is assumed for the leveraged portfolios, which are created as outlined earlier.
Table 3. One–Year Leveraged ETF Portfolio Returns
|
|
60/40 Portfolio | Leveraged Portfolio | S&P 500 | One-Year Treasuries | ||
|---|---|---|---|---|---|---|
| 2X | 3X | 4X | ||||
| Average (%) | 8.0 | 8.9 | 9.4 | 9.4 | 11.1 | 3.6 |
| Median (%) | 7.2 | 8.0 | 8.4 | 8.2 | 9.1 | 3.6 |
| Std. Dev (%) | 11.9 | 12.1 | 12.3 | 12.4 | 20.4 | 0.2 |
| Sharpe | 0.4 | 0.4 | 0.5 | 0.5 | 0.4 | na |
| Min (%) | -29.4 | -28.6 | -27.9 | -27.5 | -46.0 | 2.8 |
| Max (%) | 64.3 | 67.6 | 70.7 | 72.9 | 120.4 | 4.6 |
| The returns are based on one–year holding periods along with the returns for 100% in the S&P 500 and one–year Treasuries for comparative purposes. For robustness, the last 90 years of daily return data is re-sampled 10,000 times for the S&P 500 and one–year Treasuries. The leveraged portfolios are 30% two times LETF/70% bond, a 20% three times LETF/80% bond, and a 15% four times LETF/85% bond. A 1.0% expense ratio is assumed for the leveraged portfolios, which are created as outlined earlier. | ||||||
Table 3 shows that, with virtually no change in risk, using leveraged ETFs within a portfolio setting can improve returns if LETFs are rebalanced to keep exposure relatively constant. Since bullish LETFs tend to have skewed returns when the market significantly increases, over time these returns, along with the greater percentage in bonds, appear to make up for the general decay and higher expense ratios of these funds. In fact, the LETFs have better minimum and maximum returns. Thus, LETFs may be able to provide a higher return/risk trade-off as shown by their higher Sharpe ratios (a measure of risk-adjusted returns) and more importantly, their greater average returns.
Properly managed, it appears that LETFs may have more to offer than being limited to short-term trading goals only. The option component of the LETFs allow a greater percentage of a portfolio to be invested in a relatively safe bond portfolio, making up for the leverage decay. Although not shown, the qualitative results above also held if using a one-, two-, five-, seven-, and 10-year Treasury ladder with an even greater differential between a standard 60/40 and the LETF portfolios, as the larger percentage in bonds realize better returns and create a widening differential.
Conclusion
It is generally advised that leveraged ETFs be limited to short-term trading goals, as various studies have shown. However, I (Journal of Index Investing, 2011) and James DiLellio et al. (Financial Services Review, 2014) have both published papers suggesting that LETFs can be held for extended holding periods under the right circumstances.
As an individual investment, leveraged ETFs will generally provide less than their daily multiple over time while increasing the risk by exactly the daily multiple. However, for those willing to make a market call, if the return is high enough and the volatility low enough, LETFs can magnify returns significantly and have a realized leverage greater than what might be expected.
Under average volatility conditions, unless an investor expects a market increase of more than 10% in a year, investing beyond a two times LETF cannot be justified from an additional return/risk framework. A four times LETF in fact will have a lesser return than a three times LETF. The same holds true for inverse funds, with the trade-off being worse.
However, leveraged ETFs provide investors option-like payoffs without expiration dates. For any given position in an underlying index, an LETF allows an investor to reduce that position by the division of the leverage ratio. A 60% equity position could be replaced by a 20% equity position in a three times LETF. Assuming the investor rebalances the LETF position so that the portfolio percentages remain relatively constant, this study shows that the use of LETFs can possibly improve returns while holding risk relatively constant. This may require nerves of steel, as a day like October 19, 1987, would see a three times leveraged ETF lose 60% of its value. The loss would need to be rebalanced, which could be followed by yet another large loss. Those who suffer from mental accounting (each account is separate) may have trouble with this arrangement.
Leveraged ETFs are an innovative asset. The fact that they now have assets of more than $40 billion attests to their popularity. However, investors need to realize that LETFs should not be considered as a passive investment. For those investors making short-term market trades, LETFs are very good at what they do. For other investors with longer-term investment strategies, LETFs can be judiciously used, with the understanding that as an individual asset they are very risky and within a portfolio context they need to be managed.
Finally, one needs to be aware of both the return trend and volatility characteristics of the leveraged ETF’s underlying index. The greater the volatility of the underlying index, the less likely LETFs will perform well over time.

Related

Portfolio Strategies
An Investor’s Guide to Smart Beta Strategies
Related

Offbeat Offerings
Inverse and Leveraged ETFs
Discussion
FREE REPORT

Get your free copy of our special
report analyzing the tech stocks
most likely to outperform the
market.
Alan Robertson from GA posted over 9 years ago:
Alan Robertson from GA posted over 9 years ago:
Nick Di Virgilio from NY posted over 8 years ago:
ROBERT A from NC posted over 2 years ago:
You need to log in as a registered AAII user before commenting.
Log InCreate an account