


Beiley Software’s owner describes how to keep track of your investments with his Fund Manager program.
Fund Manager is portfolio management software from Beiley Software that runs on Windows XP, Vista, 7, 8 and 10. It allows you to keep track of your investments through a wide variety of graphs and reports. There are three versions of the software: Personal for the individual investor, Professional for the professional trader and Advisor for investment advisers. This review focuses on the Personal version, which sells for a one-time fee of $99.
All your data is stored on your PC, unlike Web-based platforms where your data is stored online. The program can automatically retrieve all your transaction and position information from your broker or mutual fund company, just like Quicken. A list of supported brokers is available here. Fund Manager also supports retrieving prices from a wide variety of free quote services on the Internet, such as Yahoo, Google and Bloomberg. A list of supported quote services is available here. Your investment’s asset type and sector information are also retrieved in order to provide you with a holistic view of your asset allocation and portfolio holdings.
In addition to funds, the software supports stocks, bonds, exchange-traded funds (ETFs) and options. Users can track investments in multiple currencies, choosing from 25 currencies. See the multiple currencies tutorial for more information.
There are three main views: the portfolio editor, reports and graphs.
Portfolio Editor
The portfolio editor is used to manage and organize your portfolios and investments. It gives a “Windows Explorer”-like view of your portfolios and investments. The left part of the window is a view of all your portfolios. The right-hand side lists all the portfolios and investments in the portfolio that are selected on the left.
Portfolios can be hierarchical, with multiple nested layers. You can have any number/depth of portfolios. Hierarchical portfolios allow any desired grouping of accounts to be viewed together for graphing or reporting on any level of the portfolio hierarchy. For example, you can organize your accounts into regular and retirement portfolios and analyze each group of accounts separately. This example is shown in Figure 1. You can see how well all your retirement accounts are performing, how well all your regular accounts are performing, and look at all accounts combined by reporting at the portfolio level that contains both of these (Master Portfolio in Figure 1). You could also use hierarchy to organize accounts by family member if you’re tracking accounts for multiple family members.
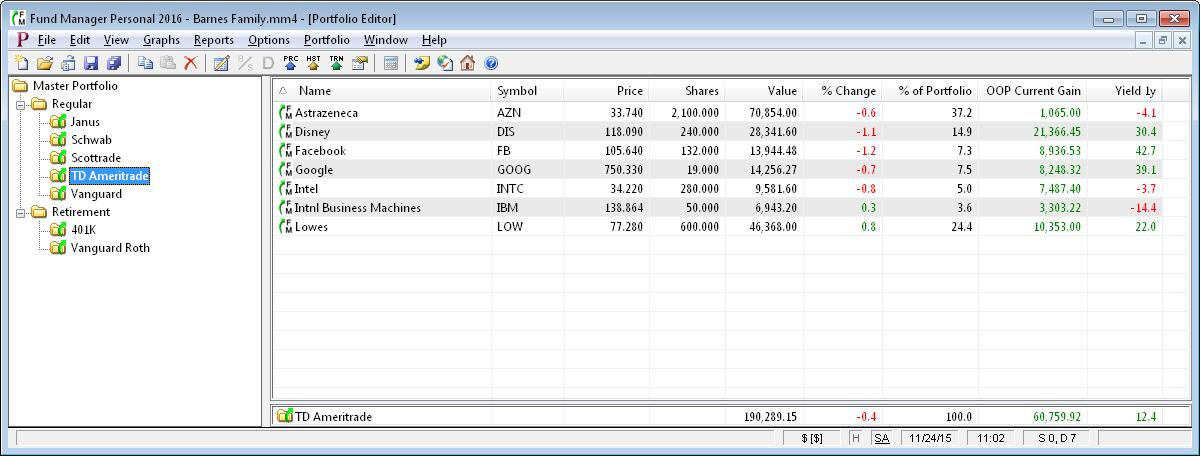
The data fields displayed in the list view on the right side of the portfolio editor can be customized from a wide variety of available fields. You can add fields that show performance, such as yields and percentage gain, or you can add fields that show properties of the investments, like the investment type. Use the menu command “View / List Columns...” to choose which fields to display.
All the data displayed in the portfolio editor is for the current date. This provides a quick snapshot of your portfolio statistics. In order to view information for another time period, you must use the reports or graphs views, where you can get data for any desired time period.
Reports
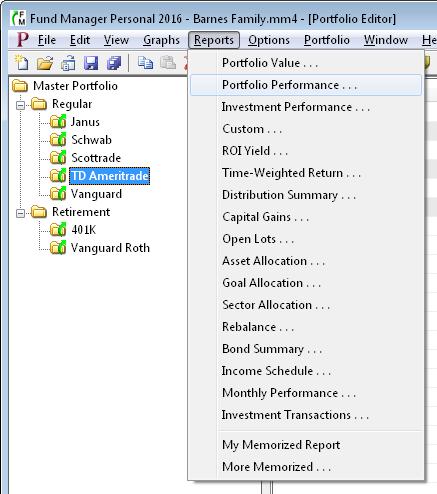
Fund Manager has 21 different report types, accessed through the Reports menu (Figure 2). Reporting is extremely flexible and powerful. Samples of each report type are available here. Reports include:
- portfolio value
- portfolio performance
- investment performance
- custom
- ROI yield
- time-weighted return
- distribution summary
- capital gains
- open lots
- asset allocation
- goal allocation
- sector allocation
- rebalance
- bond summary
- income schedule
- monthly performance
- investment transactions
With the Custom report, users can choose columns from a wide variety of available fields including performance metrics, gains, basis and properties. Use the “Edit / Custom Settings...” menu command to select the fields to display. The Fund Manager website has documentation on all the available fields in order for users to learn about what each entails.
Reports can be run for any date range and for any portfolio.
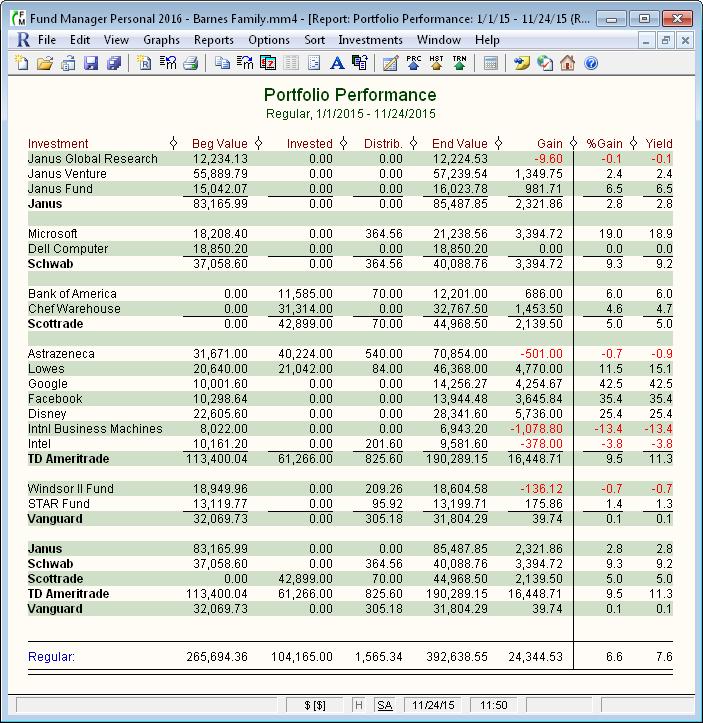
Figure 3 shows a sample portfolio performance report.
This report selected the Regular portfolio hierarchy level from Figure 1. It is sub-totaled by portfolio and lists by investment. For example, the Janus portfolio sub-totals are shown and the Janus portfolio is broken down by investment, listing each of the three investments in the Janus portfolio.
Reports can be subtotaled by portfolio, investment type, symbol, asset type, investment goal, sector or currency. Reports can also be filtered by these same attributes, so users can show or hide certain items, making it easier to analyze specific portfolio statistics. You can also choose to list your holdings by investment, symbol, investment type, asset type, investment goal, sector or currency.
A useful report feature is “memorize,” so that reports can be easily recreated. Once you create a report with the desired options, use the menu command “Edit / Memorize...” to assign a name to this report for easy recall. Memorized reports will be listed at the bottom of the Reports menu. This is very useful when using the custom report to set up your own preferred report formats. Users can create an unlimited number of memorized reports.
All report data can be saved to a comma-delimited (CSV) file using the “File / Export to CSV...” menu command.
Graphs
Extensive graphing choices allow you to view your investments and portfolios in a variety of ways over a time period of your choice. Charts are accessed through the Graphs menu (Figure 4). Users can compare performance and gain insight into positions by choosing from 48 customizablegraph types. There are both portfolio-based graphs as well as investment-based graphs. The portfolio-based graphs can be displayed for any portfolios in your hierarchy.
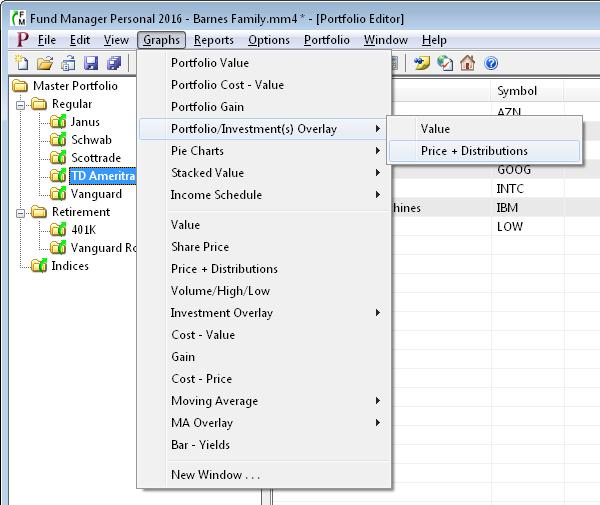
Figure 5 charts the performance of the Master Portfolio from Figure 1 compared to that of the Dow Jones industrial average and the S&P 500 index. The Master Portfolio in this example is at the top of the portfolio hierarchy, which includes all the accounts so you can see how well the combination of all your accounts performed relative to each index.
To compare against an index, you must first create an investment in Fund Manager to track the desired index. You can place all your indexes in their own separate portfolios. Prices for all the most common indexes can be retrieved with prices for your owned investments. Prices are retrieved by symbol, so you’ll need to find the symbol for your desired index. To find the symbols used by Yahoo (the default quote server used by Fund Manager) for many of the most common indices, see their list of indices.
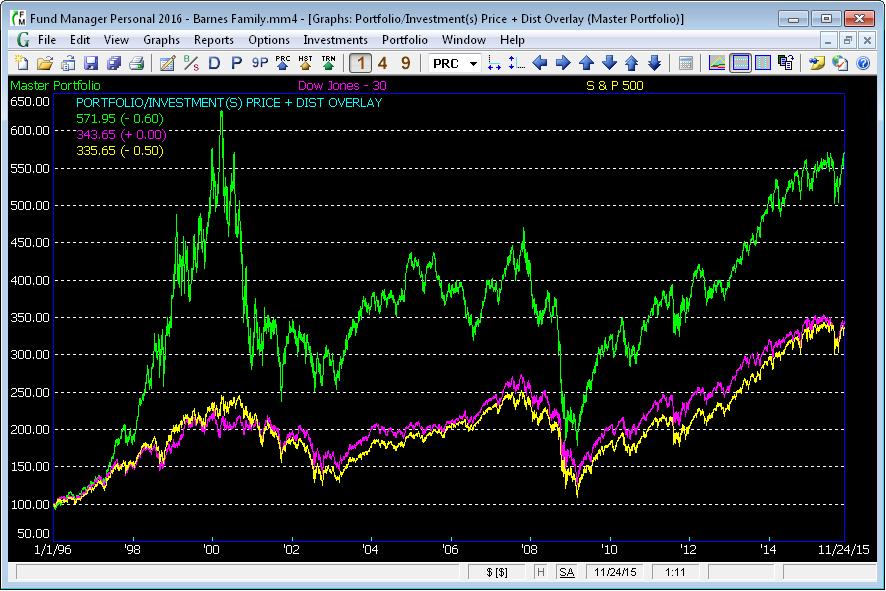
Figure 6 is an investment-based graph showing the cost/price relationship of the portfolio over time. The number of displays is set to four, so you see four investments graphed in the window at a time. You can change this to one or nine with the toolbar buttons (notice that four is selected now). The legend displayed in the upper/left corner of each graph shows the graph type, the ending share price, and cost per share. True time- and money-weighted ROI yields for various time frames are being displayed in yellow text above each graph. You can choose to display time-weighted returns (TWR), return on investment (ROI) yields, or nothing, above the graphs. The share price for this graph type is drawn in light blue, while the out-of-pocket cost per share (your breakeven point) is drawn in green. When the price line is above your cost line you have a gain, and when the price line is below the cost line you have a loss. This lets you quickly see whether you are ahead or behind in each investment over time.
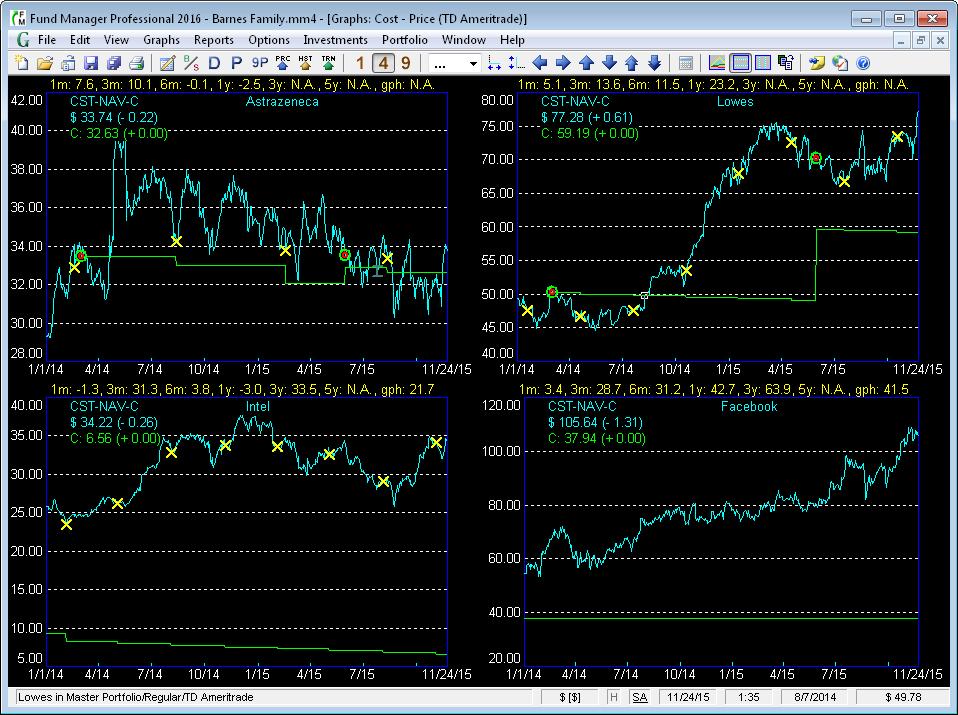
Fund Manager can display “markers” on your graphs. Markers can be shown for buys, sells, distributions, splits, unspecified lots, alerts, trendlines and notes. As you move your cursor over a marker, information on that marker is displayed. You can right-click on any marker to perform operations on it, such as opening the associated transaction, to see or edit details for any transaction.
Each graph window has an assigned “active” portfolio, which can be set to any portfolio under the Portfolio menu. The active portfolio controls which investments are available in investment-based graphs, or which portfolio is plotted in portfolio-based graphs. Use the Investments menu to order the displayed investments, or specify which investments to display. All investments within the active portfolio can be scrolled through with the arrow or page up/down keys on the keyboard or using the toolbar buttons.
Other Notable Features
Multiple yield calculations: Yields reported include both true time-weighted and money-weighted return on investment and time-weighted only yields. Yields can be calculated for any object and for any time period desired.
Price alerts: You can receive notifications when the price of an investment crosses a certain value. These price alerts can notify you with a popup window, sound, or by email.
Bond calculations: Tracking of bonds includes accrued interest, yield to maturity, current yield, annual income, next payment date and amount.
User-defined categories: There are three sets of independent categories—asset type, investment goals and sectors. The category names can be set by the user so that they can be used for any desired purpose. Each investment can be assigned percentages of various asset types, investment goals and sectors. As mentioned, asset type and sector assignments can be automatically retrieved from the Internet. Graphs and reports are available for analyzing your allocation among, and performance in, these categories.
Customization: Fonts, colors, precision of number display, etc., are customizable for the portfolio editor, graph, and report windows. In the portfolio editor window, you can choose which columns are displayed in the list and their order. You can sort the list by any displayed column. A wide variety of fields are available. You can use the Custom report to build a report with the fields and display order you want.
Mobile device viewing: You can choose to make your data viewable through the Web or a mobile device. If you enable this feature, you can view your holdings using any Web browser by using the Client Portal. A free Android app is available in the Play Store for viewing your holdings on a mobile device.
Professional Version
For more advanced capabilities, there is a Professional version that costs $295. A technical analysis graph allows you to display a wide variety of indicators for your investments. The price alert feature supports both trailing stop-loss and moving average price alerts. The Professional version also supports wash sales. You can get real-time quotes from both Yahoo and Google quote services. Advanced statistic fields added to the Custom report include alpha, beta, correlation, R-squared, standard deviation, and Sharpe ratio. Additionally, you can create your own report fields by writing equations that can use any custom report field and have a variety of built-in functions. A set of Risk/Reward scatter plots analyze performance versus risk. A correlation matrix report views the relationships within each asset type, investment goal, sector, investment type or currency.
Advanced users can also make use of “link” portfolios, where a mirror image of a portfolio can be placed elsewhere in the portfolio hierarchy. Link portfolios allow you to create multiple separate hierarchies without duplicating data. For example, if you wanted to organize your accounts both by family member and by brokerage, you could place the account portfolio in the appropriate broker portfolio and a link copy of that account in the separate family member portfolio.
Pricing and Availability
You can download and try out any version of Fund Manager for free by visiting our website. The trial is fully functional, but you are limited to starting the program 60 times. Any data you enter into the trial will still be available in the licensed version should you decide to purchase. All minor updates to the program are free.
All features and functions of the Personal version are included in the one-time $99 fee, with no additional costs for data. Technical support is also included for free via phone, email or an online forum.
A new major update of the software is released approximately every two years, in which new features and improvements are introduced. You can choose whether or not to upgrade to this new major version. The current upgrade fee is $39 for the Personal version.
Conclusion
Fund Manager is an attractive offering for keeping track of all your investment portfolios. The program focuses solely on portfolios, and doesn’t track things like spending or budgets as Quicken does. The flexibility of Fund Manager is quite powerful: Users have full control over what is displayed and can not only create custom reports and charts, but also customize the way the software looks. Hierarchal portfolios and categories make it easy to analyze your holdings in a variety of different ways, over any time period desired. And there is plenty of available power for more advanced users in the Professional version.
Fund Manager is a long-established product, first released in 1993. Our company has a long track record of offering improvements to the program, as shown in the detailed revision history on our website. Several tutorials are available for those who need some help getting started. Browsing the online forum shows timely and helpful responses to user’s questions.
Discussion
FREE REPORT

Ken S from NC posted over 10 years ago:
Ivan Hipschman from CA posted over 10 years ago:
Satish Amin from CA posted over 10 years ago:
Satish Amin from CA posted over 10 years ago:
Jackie McClellan from IL posted over 10 years ago:
Peter Bye from NJ posted over 10 years ago:
Dave Gilmer from WA posted over 10 years ago:
Mark Beiley from AZ posted over 10 years ago:
Mark Beiley from AZ posted over 10 years ago:
Ken Smith from AB posted over 10 years ago:
Mark Beiley from AZ posted over 10 years ago:
Scott Wood from MD posted over 9 years ago:
You need to log in as a registered AAII user before commenting.
Log InCreate an account