


Intelligently planning for cash flow in retirement is critical, as poor planning may result in running out of money long before running out of life.
The three elements that most significantly affect planning are the need for real, not nominal, cash flow (i.e., an income stream that increases with inflation); the risk of having to sell assets to provide income at the wrong time (i.e., during a bear market); and the likelihood of future decades of historically low market returns.
Real Versus Nominal
Although with a little thought it may seem obvious, inflation is all too often ignored in retirement planning. In reality, inflation can insidiously erode the value of a fixed-income stream.
For example, at 3% inflation, someone retiring with a fixed annual payment of $100,000 would face a 25% reduction in their standard of living by year 10 and an almost 50% reduction by year 20.
This is not what most investors have in mind. Planning for inflation is critical.
Sequence of Returns
It’s no longer a surprise to most investors that withdrawal of funds from an investment account at the wrong time can negatively affect their financial future. Unfortunately, the impact can be far more serious than most investors realize. Table 1, from our book “Retirement Income Redesigned” (Bloomberg Press, 2006), gives a simple example.
The example looks at three 65-year-old investors, each with a $1 million investment nest egg. They all receive the same average annual return of 7.56% over 30 years. They want to withdraw $62,000 each year (inflating at 3%) from now until age 95. Their question is, will the money last? Well, it depends on what professionals refer to as “return sequence.”
The poor first investor (A) had an unfortunate first year with a loss of 10%, but he earned 7.56% like clockwork for the next 28 years and made up the year 1 loss in year 30 with a 29% return. Unfortunately he didn’t get to enjoy that 30th year return, as he’d run out of money after 22 years!
Investor B received exactly 7.56% every year for 30 years and his portfolio just made it, but it can’t handle anything beyond year 30.
Investor C lucked out with a great year 1 return of 29%, although she gave it back in year 30 with a 10% loss, resulting in the same 30-year return of 7.56% return as investors A and B.
The amazing reality is that a difference in return just one year out of 30 made a huge difference in each investor’s outcome. Investor A ran out of funds after 22 years, investor B barely made it to 30 years, while investor C comfortably made 30 years and still had a portfolio of just over $1.5 million. Timing is critical.
Low Market Returns
There is obviously no way of knowing what returns will be over the next two or three decades; however, there is a broad consensus that returns will be significantly less than investors have been used to for the last 20 or 30 years. Our firm’s current long-term planning assumptions are:
- Inflation: 2.5%
- Bonds: 3.5% nominal; 1% real
- Stock: 7.5% nominal; 5% real
Consider what this might mean for an investor using a 60% stock/40% bond portfolio net (after expenses), net (after taxes), net (after inflation) return.
Bonds = 40% x 3.5% = 1.4%
Stocks = 60% x 7.5% = 4.5%
Gross return = 5.9%
Subtract expenses: 1.0%
Net return: 4.9%
Subtract taxes (@20%): 1.0%
Net, net return: 3.9%
Subtract inflation: 2.5%
Net, net, net return: 1.4%(!)
This is a pretty sobering conclusion. You may not agree with the assumptions we’ve provided, so we would encourage you to do a similar analysis using assumptions that you consider reasonable. We believe that if your expectations are in line with the majority of professional investors, you will end up with results reasonably similar to ours (if not significantly more pessimistic). What is the important lesson in this simple calculation? Expenses and taxes matter! In the past, management of expenses and taxes was important; in the future it will be critical. The good news is that while investors have no influence over market returns, they do have influence over expenses and taxes. For example, simply reducing expenses by 50 basis points would increase your net, net, net return (return less incurred, expenses, taxes and inflation) by over 25%.
What’s an Investor to Do?
Given the headwinds of inflation, return sequence, and a low return environment, what’s an investor to do?
The traditional income portfolio (i.e., one that provides annual cash flow from dividends and interest) will not work for a number of reasons. First, the current level of interest rates and dividend yields has no relationship to what would be an appropriate retirement portfolio allocation. For example, the current yield on a 20-year A-rated corporate bond is about 3.9% and the yield on the S&P 500 index is 1.8%. For a client looking to achieve a 4% cash flow, that means his portfolio allocation would have to be 100% bonds. Of course, this would be a short-lived solution, as over time the purchasing power of the nominal return from bonds would be eroded annually by inflation. Plus, the investor’s income is variable as interest rates change. Not to mention that how the investor feels and the economic reality of the value of his or her portfolio move in opposite directions, exacerbating the situation. When rates are down, portfolio income decreases and the investor feels poor, even though the portfolio value would actually be increasing. When interest rates rise, portfolio income goes up and the investor feels richer, even though the reality is his or her bond portfolio value is dropping.
A viable solution must provide consistent real cash flow in a volatile, long-term low return market environment. It was with this in mind that we created the Evensky & Katz two-bucket approach back in the early 1980s. Here’s how it works.
An investor’s nest egg is bifurcated into separate portfolios: the Cash Flow Reserve (CFR) portfolio and the Investment Portfolio (IP). When originally designed, the CFR was funded with two years of cash flow needs; subsequent research at Texas Tech University determined that a one-year reserve was optimal. Figure 1 visually describes the strategy.

Consider a total investment portfolio of $1 million and a need for $40,000 annual “real” income. The investor would open two accounts:
- A CFR account funded with $40,000; and
- An IP funded with $960,000.
The CFR portfolio would be invested in a money market fund. The IP would be invested based on a total return investment policy designed to provide a real return that meets the client’s goals and risk tolerance.
The CFR would be set to send the investor a monthly check in the amount of $3,333 (or $40,000 for the year), just like the paycheck he or she used to receive during their working life.
The IP would be managed as a total return, long-term investment portfolio. Dividends and interest are reinvested, managers are replaced if and when needed, and the portfolio is rebalanced.
Rebalancing the IP would be an opportunity to refill the CFR.
For example, let’s assume a $1 million portfolio allocated with $40,000 (one-year of cash flow) in the CFR and $960,000 in the IP. The Investment Portfolio has a 60% stock allocation ($576,000) and a 40% bond allocation ($384,000). Six months later, the CFR has been depleted to $23,000, while a pullback in stock prices has both lowered the IP’s value to $850,000 and altered its allocation to 53% stocks ($450,000) and 47% bonds ($400,000).
| Assumptions: $1 Million Portfolio; 3% Inflation | |||
| Scenario A | Scenario B | Scenario C | |
| Withdrawal Amount | $62,000 | $62,000 | $62,000 |
| Return Year 1 | -10.00% | 7.56% | 29.00% |
| Return Years 2-29 | 7.56% | 7.56% | 7.56% |
| Return Year 30 | 29.00% | 7.56% | -10.00% |
| Average Return for 30 years | 7.56% | 7.56% | 7.56% |
| Results: How Long Money Lasted | 22 Years | 30 Years | 30 Years |
| Results: Value at End | $0 | $98,000 | $1,512,000 |
Maintaining the risk profile and allocation established by the investment policy would require selling bonds and buying stock to bring the portfolio back to the 60%/40% allocation. However, in rebalancing, the investor takes this opportunity to refill the CFR. The CFR is replenished to $40,000 and the IP’s allocation is adjusted to 40% bonds (now $333,200) and 60% stocks ($499,800).
The result is that the investor has been able to refill the CFR portfolio without having to sell equities at reduced prices and at the same time has repositioned the IP allocation to match the criteria established by the Investment Policy.
Does it work? Absolutely! In addition to the actual mitigating of sequence risk by ensuring that investments do not have to be sold at the wrong time, it is efficient in regard to transactions and taxes, as the timing of sales is in the control of the investor, not the market. However, the greatest value of the strategy is behavioral. We’ve been using the E&K Cash Flow Reserve since the early 1980s and it carried our clients through Black Monday (October 1987), the tech bust and the Great Recession. While no one was happy, no one panicked, as everyone knew where their grocery money was coming from: It was sitting in cash! Therefore, we had no one, even our most conservative clients, panicking and moving to cash. As a result, they not only reaped the benefits of subsequent market recovery, but most portfolios recovered faster than the market averages due to regular rebalancing.
What Else?
Unfortunately, market returns give no consideration to an investor’s needs. It’s fruitless to say, “I need X% return.” The markets don’t care.
Attempting to meet your retirement cash flow needs by finding investments that provide better risk-adjusted returns than available in traditional investments is a guaranteed prescription for long-term disaster. At worst, you may find yourself mired in a Madoff-like Ponzi scheme, and at best you will have chased unrealistic and unachievable returns in an expensive and subpar investment.
There are, however, a few additional strategies that you might consider.
Core and Satellite
This is an institutional strategy that will assist in minimizing taxes and transaction costs.
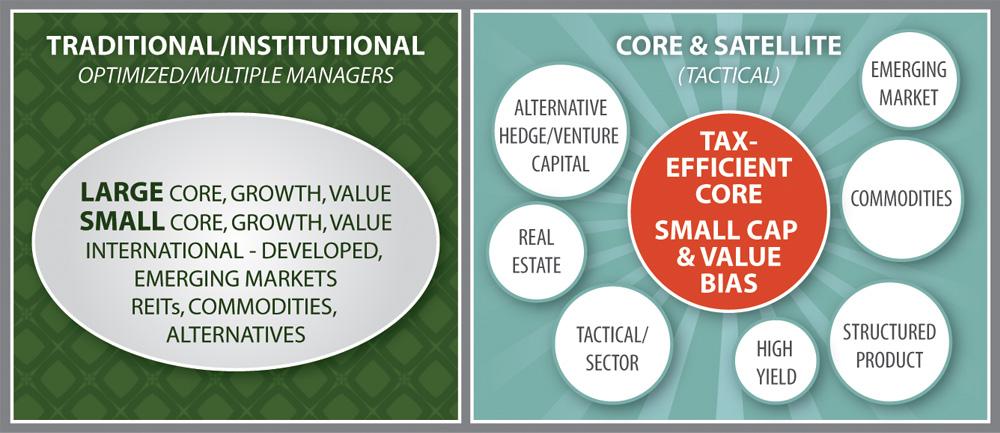
Traditional portfolios generally have allocations to numerous different managers, each one in the belief that the manager can provide alpha [risk-adjusted excess return over the index]. The problem with this approach is that it is very costly and tax-inefficient. The more managers in a portfolio, the more frequent the trading and the rebalancing, resulting in significant taxes and transaction costs.
In a core and satellite design, the core investments are designed to capture market returns and be as tax- and cost-efficient as possible (e.g., index funds and exchange-traded funds). The risk budget normally spread across the equity portfolio can be concentrated in the satellite allocation.
Figure 2 gives an example of the transition from multiple managers to a core and satellite approach as implemented in our practice.
Immediate Annuities
We recognize that most investors are not fans of immediate annuities (i.e., an insurance investment that provides a fixed monthly payment for the life of the investor), as this investment requires the irrevocable transfer of assets to an insurance company for the promise of those monthly payments. We are sympathetic to this reluctance; in fact, many years ago one of us was quoted in a major financial publication is saying, “I’ll wash my mouth out with soap before I talk about immediate annuities.” We’ve subsequently changed our opinion, as today there are products available from highly rated insurance companies that do not take all the gravy off of the table for their own profit center.
What makes a fairly priced immediate annuity attractive is that it is the only investment that provides a fourth potential return. Stocks, bonds and all other investments provide a return from a combination of interest, dividends and capital gains. An immediate annuity offers the potential of a mortality return.
| What must you earn, above the pricing rate, to justify NOT annuitizing. | |
| Age of Annuitant |
Spread Above Pricing Interest Rate * |
| 55 | 35 |
| 60 | 52 |
| 65 | 83 |
| 70 | 138 |
| 75 | 237 |
| 80 | 414 |
| 85 | 725 |
| 90 | 1,256 |
| 95 | 2,004 |
| 100 | 2,978 |
|
*In basis points = 0.01%.
|
|
Imagine 1,000 65-year-old females each investing $100,000. This would provide the annuity company with $100 million to invest. Factoring in reasonable expenses and fees and conservative returns, the insurance company would consult an actuarial table to determine how much could be paid out monthly. Assume that the actuarial life expectancy of the cohort was 25 years (i.e., age 90). The insurance company would make monthly payments so that theoretically all of the funds would have been dispersed in 25 years. Obviously, not all 1,000 of these investors would die in exactly 25 years; some would die earlier and some later. Those who die younger than age 90 would not reap the full benefits of the annuity payments; however, as they were no longer alive, they really wouldn’t care. It is those who live longer who would reap the benefits. It’s that potential return that is referred to as “mortality return.” Table 2 provides some idea of the magnitude of the potential return.
Two caveats: As you can see from the table, the real benefit does not kick in until an investor is over age 70, so it’s not a vehicle for younger investors. Also, as annuity payments are very dependent on the current interest rate environment, which is at a historic low, you might want to consider waiting for this investment until rates have returned to a more historical norm.
Still, numerous academic studies support the conclusion that some allocation to immediate annuities can significantly increase the probability of the long-term survival of a cash flow policy, so it’s an area investors should begin to educate themselves about.
Reverse Mortgage
This is about the only strategy less favored than immediate annuities, hence we’ve saved it for last. In professional circles, reverse mortgages have a terrible reputation due to high fees and the use of leverage at older ages. What has changed and attracted our attention is the introduction a few years ago of a new low-cost form of reverse mortgage known as the HECM Saver. [HECM stands for “home equity conversion mortgage.”] This is a more flexible version of a reverse mortgage that allows an investor to borrow when a need arises and pay back when that need no longer exists. Basically, it is very similar in concept to a home equity loan. The difference is that once in place, the HECM cannot be withdrawn by the mortgage company, unlike many home equity loans that were terminated by banks during the Great Recession just when investors needed to tap into those resources.
Working with a number of associates at Texas Tech University, we posed the question, “Can we borrow from a reverse mortgage line of credit during times when the portfolio is ‘off,’ in order not to sell into a bear market and better stay on path for a successful retirement?” Our research concluded that, indeed, for many investors who own a home free and clear, implementing a HECM Saver as a risk-management tool (i.e., the risk of market volatility), as opposed to a borrowing strategy, could be a valuable complement to the two-bucket strategy.
Conclusion
You’ve spent a lifetime investing and planning for your retirement. Utilizing intelligent cash flow strategies during your retirement will help you enjoy it.
Discussion
FREE REPORT

Vaidy Bala from AB posted over 12 years ago:
Vaidy Bala from AB posted over 12 years ago:
John from FL posted over 12 years ago:
Prabhu from CT posted over 12 years ago:
Mike G from Michigan posted over 12 years ago:
Mike G from Michigan posted over 12 years ago:
David P from IL posted over 12 years ago:
J C Norris from TN posted over 12 years ago:
Richard P from CA posted over 12 years ago:
Bob Bergstrom from IL posted over 12 years ago:
Fred Demarco from MD posted over 12 years ago:
Fred Demarco from MD posted over 12 years ago:
Steve Laube from GA posted over 12 years ago:
Dave Gilmer from WA posted over 11 years ago:
Joseph Gal from CA posted over 11 years ago:
Arobindo Dutt from Arizona posted over 11 years ago:
Robert Gariepy from WI posted over 11 years ago:
Michele Burier from FL posted over 11 years ago:
Dennis Goodwin from SC posted over 10 years ago:
Donald Myers from AZ posted over 9 years ago:
Victor from NC posted over 9 years ago:
You need to log in as a registered AAII user before commenting.
Log InCreate an account