



It’s a rather poor year for the stock market, and the worst of it has come in the last three months.
The Model Fund Portfolio and the S&P 500 index [as measured by the Vanguard 500 Index fund (VFINX)] were both up about 1% year-to-date on June 30. Through September 30, the S&P 500 is down 5.4% and the Fund Portfolio is down even more, at –8.5%.
The bull market that usually appears in the year before a presidential election is nowhere to be seen, although there are three months left in 2015. The theory has been that the politicians spend the time just before an election to influence votes and that boosts the economy—or appears to. Nothing in Washington, either from the Congress or the Federal Reserve, seems to be helping the economy, but the fact that nothing is happening may be a long-term blessing.
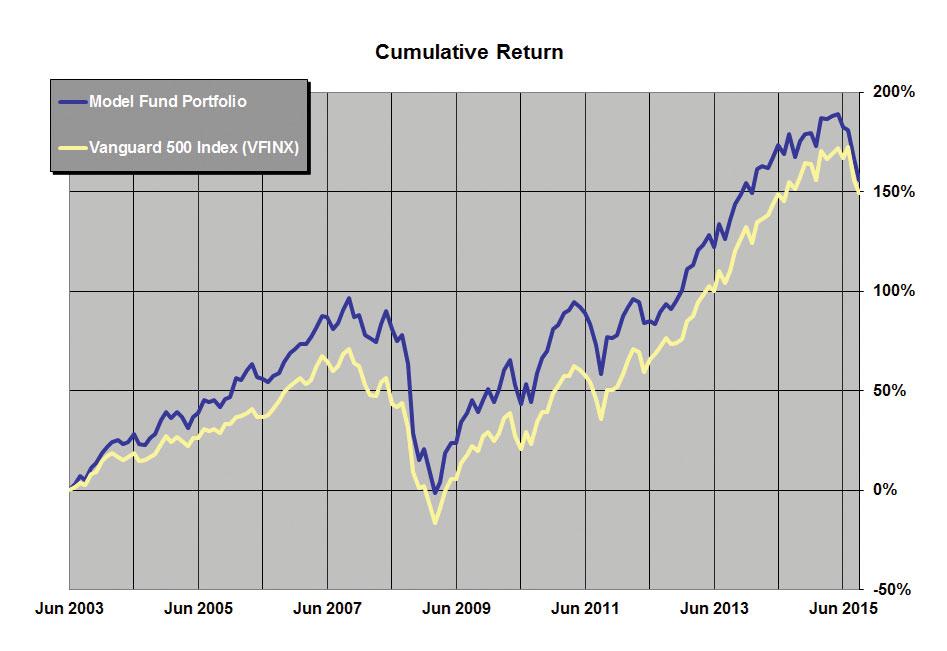
The performance of the individual funds and exchange-traded funds (ETFs) can be seen in Tables 1 and 3. Long-term performance is shown in Table 2. Aston/Fairpointe Mid Cap fund (CHTTX) continues the slide that began with its closing to new investors, and it is now the weakest performer this year. iShares MSCI Frontier 100 ETF (FM) also got hit significantly, due to the drop in oil prices. Even Fidelity Capital & Income (FAGIX), which tends to be less volatile, is down slightly for the year to date.
There are no changes in the Model Fund Portfolio or the All-ETF Portfolio. There are also no changes in the portfolio rules.
ETF Problems
While there has always been a difference between the net asset value and the market value of ETFs, it has been trivial for the popular index ETFs and modest for most others.
However, the market versus asset values separated dramatically in an extremely fast down market on August 24, 2015. I saw differences of 20% in even the most popular ETFs, such as the price of SDPR S&P 500 ETF (SPY) compared to the S&P 500 index real value. That means that some buyers made 20% in a few minutes and some sellers received 20% less than they theoretically should have.
How could this happen? The two forces that keep the market price of an ETF close to its true value (based on the value of the securities it represents) could not respond fast enough to keep up with “at the market” sell orders. Trading units in ETFs are created by buying equivalent underlying assets and this keeps the price and the asset value close. In addition, in any market such as this, there are arbitragers who will buy and sell mispriced assets for a small profit, thereby keeping disparities small. Neither of these processes was able to react fast enough to keep up with “at the market” sell orders.
|
|
|
|
|
|
|
|
|
|
|
Std | Worst |
|
|
|
|
|
|
|
|
|
|
|
Dev | 3-Yr |
|
|
|
Market | YTD | Annual Return (%) | Fund | Exp | (36 Mo. | Cal | |||
|
|
|
Cap | Return | 1- | 5- | 10- | Since | Assets | Ratio | Ann’l) | Period |
| Type | Fund (Ticker) | Size | (%) | Yr | Yr | Yr | 6/30/2003 | ($ Mil) | (%) | (%) | (%) |
| MF |
Aston/Fairpointe Mid Cap N  (CHTTX)* (CHTTX)* |
Large-Cap | -14.7 | -10.9 | 10.7 | 9.0 | 10.3 | 1,756.7 | 1.11 | 13.5 | -7.9 |
| MF |
Fidelity Capital & Income (FAGIX) |
**** | -1.0 | -0.5 | 7 | 8.0 | 8.6 | 10,482.2 | 0.72 | 5.3 | -7.2 |
| MF | Fidelity OTC (FOCPX) | Large-Cap | -2.1 | 3.6 | 16.0 | 10.9 | 11.6 | 8,610.9 | 0.83 | 13.5 | -8.3 |
| ETF | First Trust US IPO (FPX) | Large-Cap | -2.8 | 2.0 | 19.1 | nmf | nmf | 752.5 | 0.60 | 13.1 | -13.7 |
| ETF | Guggenheim S&P 500 Equal Weight (RSP) | Large-Cap | -7.2 | -1.6 | 13.3 | 7.7 | 9.7 | 9,023.1 | 0.40 | 10.1 | -11.4 |
| ETF | Guggenheim S&P MidCap 400 Pure Value (RFV) | Mid-Cap | -10.7 | -4.8 | 11.4 | nmf | nmf | 98.2 | 0.37 | 13.1 | -4.3 |
| ETF | Guggenheim S&P SmCap 600 Pure Value (RZV) | Small-Cap | -14.6 | -7.3 | 11.4 | nmf | nmf | 145.0 | 0.36 | 16.3 | -7.9 |
| ETF | iShares MSCI Frontier 100 (FM) | Large-Cap | -14.3 | -24.6 | nmf | nmf | nmf | 485.8 | 0.79 | 12.8 | nmf |
| ETF | Vanguard REIT Index (VNQ)*** | Large-Cap | -4.3 | 9.3 | 11.9 | 6.9 | 10.3 | 24,529.5 | 0.12 | 14.3 | -11.9 |
| Avg of Funds in Actual Model Fund Portfolio† |
|
-8.0 | -3.9 | 12.6 | 8.5 | 10.1 | 6,209.3 | 0.59 | 9.7 | -9.1 | |
| Actual Fund Portfolio Performance†† |
|
-8.5 | -4.3 | 10.0 | 5.8 | 7.9 | — | — | 9.7 | -6.4 | |
| Optional Investment: | |||||||||||
| ETF | iShares Barclays 1-3 Year Treasury Bond (SHY) | Bonds | 0.9 | 1.1 | 0.6 | 2.4 | 2.8 | 13,111.1 | 0.15 | 0.5 | 1.3 |
| Comparison: | |||||||||||
| MF |
Vanguard 500 Index (VFINX) |
Giant-Cap | -5.4 | -0.8 | 13.2 | 6.7 | 7.8 | 24,972.5 | 0.17 | 9.7 | -8.4 |
|
*CHTTX is closed to new investors. Current shareholders can continue to invest in the fund. Other investors should simply use the other eight funds to form their portfolio. ** Distressed securities - stock and bond. ***VGSIX returns used before October 2004. †A simple average of the funds in the current Model Fund Portfolio. ††Performance of actual portfolio since inception (June 2003) including reinvested dividends. nmf = no meaningful figure. Source: Morningstar, Inc. Data as of 9/30/2015. |
|||||||||||
Table 2. Model Fund Portfolio Annual Performance
|
|
Average Annual Return (%) |
Cumulative Growth of $10,000 ($) | ||
|
|
||||
|
|
Model Fund Portfolio |
Vanguard 500 Index (VFINX) |
Model Fund Portfolio |
Vanguard 500 Index (VFINX) |
|
|
||||
|
|
||||
| 2003* | 18.6 | 15.0 | 11,858 | 11,503 |
| 2004 | 17.7 | 10.8 | 13,955 | 12,742 |
| 2005 | 5.4 | 4.8 | 14,711 | 13,350 |
| 2006 | 16.1 | 15.6 | 17,086 | 15,436 |
| 2007 | 10.2 | 5.4 | 18,820 | 16,267 |
| 2008 | -35.9 | -37.0 | 12,071 | 10,245 |
| 2009 | 24.9 | 26.5 | 15,080 | 12,959 |
| 2010 | 20.3 | 14.9 | 18,136 | 14,892 |
| 2011 | -1.7 | 2.0 | 17,827 | 15,186 |
| 2012 | 12.6 | 15.8 | 20,075 | 17,589 |
| 2013 | 26.7 | 32.2 | 25,436 | 23,250 |
| 2014 | 9.9 | 13.5 | 27,962 | 26,388 |
| 2015 YTD** | -8.5 | -5.4 | $25,590 | $24,967 |
| Since Incep** | 7.9 | 7.8 | $25,590 | $24,967 |
| *June 30 to December 31, 2003. **Through September 30, 2015. Portfolio was started on June 30, 2003. | ||||
Table 3. Alternative All-ETF Portfolio
|
|
Weight* |
YTD Return (%) |
Annual Return (%) | |
|
|
1- Yr |
Since 12/31/2012 |
||
| Fund (Ticker) | ||||
| First Trust US IPO ETF (FPX) | 20% | -2.8 | 2.0 | 18.9 |
| Guggenheim S&P 500 Equal Weight (RSP) | 20% | -7.2 | -1.6 | 14.0 |
| Guggenheim S&P MidCap 400 Pure Value (RFV) | 20% | -10.7 | -4.8 | 11.2 |
| Guggenheim S&P SmCap 600 Pure Value (RZV) | 20% | -14.6 | -7.3 | 9.1 |
| iShares MSCI Frontier 100 (FM) | 10% | -14.3 | -24.6 | 4.2 |
| Vanguard REIT Index (VNQ) | 10% | -4.3 | 9.3 | 9.3 |
| Weighted Avg of ETF Funds in Portfolio† |
|
-8.9 | -3.9 | 12.0 |
| Actual ETF Portfolio†† |
|
-8.9 | -4.1 | 11.4 |
|
Comparison: Spider S&P 500 (SPY) |
-5.3 | -0.7 | 13.6 | |
|
* Weights were adjusted at the close of 9/30/2014. ** A weighted average of the ETFs in the current All-ETF Portfolio. *** Performance of actual All-ETF Portfolio, including reinvested dividends. Source: Morningstar, Inc. Data as of 9/30/2015. |
||||
Various steps have been taken to eliminate or reduce this problem. The most effective one is probably the creation of computer programs that will try to take advantage of this mispricing to make a profit, which would reduce the arbitrage opportunity and the mispricing. But such programs may not work perfectly.
In addition, it is hoped that ETF investors will have learned not to place market sell orders in this kind of market. I hope that it was not individual investors who got stung badly, but rather computerized trading systems.
If you are prone to panic, ETFs may not be your best investment choice. Remember that the popular index ETFs will be the least impacted in a fast market and the less popular indexes will be more vulnerable. Even more vulnerable will be actively managed ETFs.
Looking Forward
There are still a number of conflicting forces impacting the market. The most bearish factor to me is the recent reduction in overall corporate profits. The most bullish factor is the growing number of loud growling bears.
Perhaps we will have a better picture of the serious contenders for president next March when our next Model Fund Portfolio article appears. In the meantime, you can follow the portfolio here.
Model Fund Portfolio: Selection Rationale
First Methodology
The fund selection rationale consists of two distinct approaches. The first approach is to select actively managed funds where the managers have shown a long-term ability to outperform the market after allowing for additional portfolio risk, regardless of the sector invested in. A fund must have the following characteristics to be considered for the Model Fund Portfolio:
- It must be a pure no-load fund. Short-term holding penalties are allowed if paid to the fund and not the manager.
- It must have been active for 10 years. However, exceptions are possible.
- It must have outperformed the S&P 500 index over the past five-year and 10-year periods.
- In its worst three-year (calendar) period, it must not have had a loss; or, in particularly difficult market periods, its loss must have been substantially less than that of the S&P 500 index.
- Its expense ratio must not be above 1.25%. Lower ratios will increase desirability.
- Fund assets must not be over $10 billion. Some exceptions are permitted, depending on fund objectives.
- It must currently be open to individual investors, with a minimum investment of $25,000 or less.
The above rules apply to new fund selections. Funds will not automatically be eliminated if they later violate the rules without considering other factors.
Second Methodology
The second methodology selects investment approaches that have provided excess returns or reduced portfolio risk to investors over the long term and then searches for the best traditional fund or exchange-traded fund (ETF) in that area. Factors to be considered are:
- The liquidity of the fund.
- The resources of the management company, in the case of ETFs.
- The investment returns and risk over as long a term as possible, given the newness of so many ETFs.
- Selection of areas with demonstrated long-term excess returns: value stocks, small-cap stocks, real estate and special areas where individuals cannot easily invest. An example of a fund in a special area would be Fidelity Capital & Income fund (FAGIX), which invests in distressed securities.
Portfolio Management Notes
- The Model Fund Portfolio is meant to be a portfolio, and we suggest you invest in the entire portfolio on an equal investment basis—that is, invest equal dollar amounts in each fund initially. If you are building an All-ETF Portfolio, see the recommended weightings shown in Table 3.
- If a fund is closed, create your portfolio from the remaining funds.
- You may make adjustments based on your non-fund holdings. For example, if you have partnership or individual holdings in investment real estate (not personal housing), you may reduce or eliminate any REIT funds.
- There is no need to rebalance on a regular basis. Rebalancing can be accomplished when there are portfolio changes or if one holding gets way out of line. We will notify you of any rebalancing in the Model Fund Portfolio.
Discussion
FREE REPORT

Tercio Volpini from NC posted over 10 years ago:
Larry Sealy from AL posted over 10 years ago:
Wiliam Wise from CO posted over 10 years ago:
Thos Braun from NY posted over 10 years ago:
Doug from NY posted over 10 years ago:
Taljit Sandhu from MI posted over 10 years ago:
You need to log in as a registered AAII user before commenting.
Log InCreate an account