


Related
Portfolio Strategies

Large-cap growth stocks, especially technology stocks, continue to lead the market this year.
The S&P 500 index as represented by the exchange-traded fund (ETF) SPDR S&P 500  (SPY) leads the Model Fund Portfolio 9.3% to 7.0% year to date.
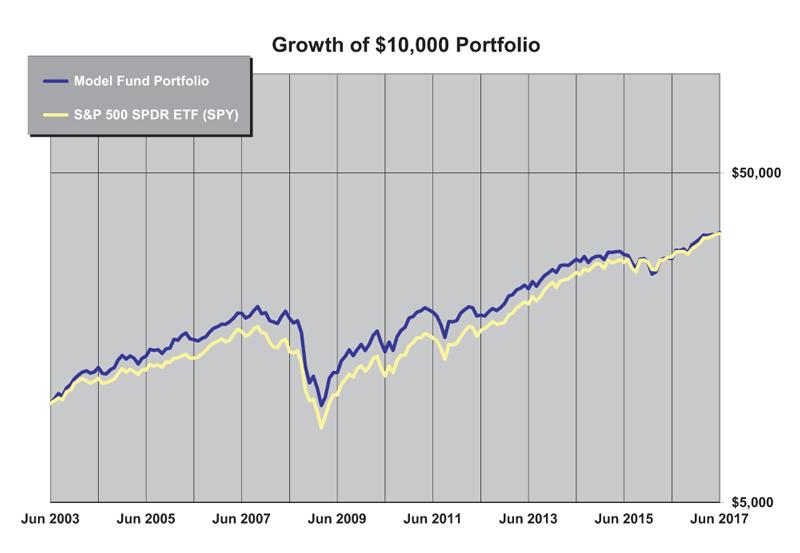
For performance figures over longer periods, please see Figure 1 and Tables 1 and 3.
Table 1 lists the mutual funds and ETFs that currently make up the Model Fund Portfolio.
Two exchange-traded funds were replaced during the end of June portfolio review, as summarized in Table 2.
(RFV) was sold and replaced with Vanguard Mid-Cap Value (VOE).(RZV) was sold and replaced with Vanguard Small-Cap Value (VBR).In both cases the change was made because the replacement fund offers a lower expense ratio and tighter bid/ask spread.
Vanguard Mid-Cap ETF (VOE) has been a component of my new Level3 Passive Portfolio since its inception at the end of May 2016 (see Table 4).
There were no other changes in the Model Fund Portfolio.
Table 1. Model Fund Portfolio
| Type | Fund (Ticker) | Market Cap Size | YTD Return (%) | Annual Return (%) | Fund Assets ($ Mil) | Exp Ratio (%) | Std Dev (36 Mo. Ann’l) (%) | Worst 3-Yr Cal Period (%) | |||
|---|---|---|---|---|---|---|---|---|---|---|---|
| 1- Yr | 5- Yr | 10- Yr | Since 6/30/2003 | ||||||||
| MF | Aston/Fairpointe Mid Cap N (CHTTX) | Mid-Cap | 5.1 | 29.8 | 15.2 | 9.0 | 11.4 | 1,503.3 | 1.12 | 15.4 | -7.9 |
| MF | Fidelity OTC (FOCPX) | Large-Cap | 23.5 | 36.4 | 20.2 | 12.3 | 13.0 | 11,682.4 | 0.91 | 15.3 | -9.3 |
| ETF | First Trust US IPO (FPX) | Large-Cap | 10.7 | 18.9 | 18.0 | 10.2 | nmf | 840.9 | 0.60 | 12.3 | -2.3 |
| ETF | Guggenheim S&P 500 Eq Wt Cons Stpl (RHS) | Large-Cap | 5.5 | -1.5 | 15.1 | 11.5 | nmf | 511.8 | 0.40 | 10.3 | 2.4 |
| ETF |
Guggenheim S&P 500 Equal Weight (RSP) |
Large-Cap | 7.8 | 16.8 | 15.1 | 7.8 | 10.4 | 13,526.2 | 0.20 | 10.7 | -11.4 |
| ETF | SPDR S&P Insurance (KIE) | Large-Cap | 7.0 | 25.9 | 18.8 | 5.9 | nmf | 885.5 | 0.35 | 12.2 | -13.7 |
| ETF |
Vanguard Mid-Cap Value (VOE)* |
Mid-Cap | 6.9 | 18.0 | 15.7 | 7.6 | nmf | 7,342.0 | 0.07 | 10.8 | -12.1 |
| ETF |
Vanguard REIT Index (VNQ)** |
Large-Cap | 2.6 | -1.9 | 9.3 | 6.2 | 10.3 | 33,954.0 | 0.12 | 14.8 | -11.9 |
| ETF |
Vanguard Small-Cap Value (VBR)* |
Small-Cap | 2.4 | 19.1 | 15.0 | 7.5 | nmf | 11,276.3 | 0.07 | 13.4 | -8.9 |
| Avg of Funds in Actual Model Fund Portfolio† | 8.0 | 18.0 | 15.8 | 8.7 | 11.3 | 9,058.0 | 0.43 | 10.6 | -8.3 | ||
| Actual Fund Portfolio Performance† | 7.0 | 19.9 | 12.2 | 5.8 | 8.9 | — | — | 11.6 | -6.4 | ||
| Optional Investment: | |||||||||||
| ETF | iShares Barclays 1-3 Year Treas Bond (SHY) | Bonds | 0.4 | -0.2 | 0.5 | 1.8 | 2.4 | 10,971.7 | 0.15 | 0.8 | 0.3 |
| Comparison: | |||||||||||
| ETF |
SPDR S&P 500 (SPY) |
Giant-Cap | 9.3 | 17.8 | 14.5 | 7.1 | 8.8 | 236,737.5 | 0.10 | 10.2 | -8.4 |
|
nmf= no meaningful figure. *Added to Model Fund Portfolio at end of June 2017. **VGSIX returns used before October 2004. †A simple average of the funds in the current Model Fund Portfolio. ††Performance of actual portfolio since inception (June 2003) including reinvested dividends. Source: Morningstar, Inc. Data as of 6/30/2017. |
|||||||||||
Guggenheim has reduced the expense ratio on its Guggenheim S&P 500 Equal Weight ETF (RSP) from 0.40% to 0.20%. This will increase the return to investors. I wish Vanguard and others would start competitive equally weighted S&P 500 funds, but they have spent so much effort defending capitalization-weighting that it would be difficult for them to do so even if they wanted to. Perhaps one of the other large mutual fund companies will see the opportunity.
Table 2. Model Fund Portfolio Transactions
| Buy | |
|---|---|
| Fund (Ticker) | |
|
Vanguard Mid-Cap Value (VOE) |
|
|
Vanguard Small-Cap Value (VBR) |
|
| Sell | |
| Fund (Ticker) | Reason |
|
Guggenheim S&P MidCap 400 Pure Value (RFV) |
switching to lower-cost equivalent |
|
Guggenheim S&P SmallCap 600 Pure Value (RZV) |
switching to lower-cost equivalent |
Nothing has changed in Washington and nothing is getting done. Maybe that’s a blessing. The economy and corporate earnings continue to look favorable for the market. There still seems to be a lot of cash waiting for a stock market pullback. If we don’t get one soon, investors holding cash will probably surrender and buy stocks.
Earnings seem to be the primary driver of equities at this time. This is as it should be. Continued growth in earnings not only leads to stock price increases, but also to full employment and higher wages.
Please follow the Model Fund Portfolio at AAII.com until the next update in the November AAII Journal.
Table 3. Model Fund Portfolio Annual Performance
| Average Annual Return (%) | Cumulative Growth of $10,000 ($) | |||
|---|---|---|---|---|
| Model Fund Portfolio |
S&P 500 SPDR ETF (SPY) |
Model Fund Portfolio |
S&P 500 SPDR ETF (SPY) |
|
| 2003* | 18.6 | 15.0 | 11,858 | 11,500 |
| 2004 | 17.7 | 10.7 | 13,955 | 12,735 |
| 2005 | 5.4 | 4.8 | 14,711 | 13,350 |
| 2006 | 16.1 | 15.6 | 17,086 | 15,438 |
| 2007 | 10.2 | 5.4 | 18,820 | 16,268 |
| 2008 | -35.9 | -36.9 | 12,071 | 10,273 |
| 2009 | 24.9 | 26.4 | 15,080 | 12,981 |
| 2010 | 20.3 | 14.9 | 18,136 | 14,914 |
| 2011 | -1.7 | 2.0 | 17,827 | 15,207 |
| 2012 | 12.6 | 15.8 | 20,075 | 17,608 |
| 2013 | 26.7 | 32.2 | 25,436 | 23,279 |
| 2014 | 9.9 | 13.6 | 27,962 | 26,439 |
| 2015 | -4.5 | 1.3 | 26,711 | 26,793 |
| 2016 | 15.3 | 11.8 | 30,807 | 29,957 |
| 2017 YTD** | 7.0 | 9.3 | 32,960 | 32,735 |
| Since Incep** | 8.9 | 8.8 | 32,960 | 32,735 |
|
*June 30 to December 31, 2003. **Through June 30, 2017. Portfolio was started on June 30, 2003. |
||||
This portfolio is intended to be either the complete equity portfolio for those investors who wish to manage their own portfolio, but do not choose to be involved in individual stock selection, or one portion of a whole portfolio for those who may wish to select individual equities and actively managed funds on a limited basis but keep the majority of their portfolio in index funds.
The portfolio consists of index ETFs that should have, based on their approach, returns above that of the S&P 500 index. As a portfolio, it is more diversified than the S&P 500, which should reduce portfolio downturns that are based on the impact of a few sectors.
Portfolio changes should be relatively rare and will occur only when a new or different ETF is felt to be more effective at accomplishing a similar objective than one of the current holdings. There are some new index ETFs with promising approaches, but there will be a period of observation before they can be considered.
Table 4. Level3 Passive Portfolio
|
|
Initial Weight | YTD Return % | 1-Yr Return % |
Return (%) Since 5/31/2016 |
|---|---|---|---|---|
|
|
||||
| Fund (Ticker) | ||||
|
Guggenheim S&P 500 Equal Weight (RSP) |
40% | 7.8 | 16.8 | 16.7 |
|
PowerShares Russell 1000 Equal Weight (EQAL) |
20% | 6.4 | 14.2 | 14.9 |
|
Vanguard Mid-Cap Value (VOE) |
20% | 6.9 | 18.0 | 18.3 |
|
Vanguard REIT Index (VNQ) |
20% | 2.6 | -1.9 | 4.9 |
| Weighted Avg of ETFs in Portfolio* | 6.3 | 12.8 | 14.3 | |
| Actual Level3 Passive Portfolio** | 6.3 | 12.8 | 14.2 | |
| Comparison | ||||
|
SPDR S&P 500 (SPY) |
9.3 | 17.8 | 18.1 | |
|
*A weighted average return of the ETFs in the current Level3 Passive Portfolio. **Performance of actual Level3 Passive Portfolio, including reinvested dividends.Source: Morningstar, Inc. Data as of 6/30/2017. For more on the Level3 approach, go to www.level3investing.com. |
||||
Four ETFs make up the Level3 Passive Portfolio. The weights of the holdings in the portfolio are very likely to change over time based on experience.
A more thorough discussion of the ETFs in the Level3 Passive Portfolio and other new funds that might qualify when they have sufficient volume and history are discussed in my book “Investing at Level3” (www.level3investing.com).
Guggenheim S&P 500 Equal Weight ETF (RSP) This exchange-traded fund has outperformed the cap-weighted S&P 500 index over the 14 years of its existence. Other indexes also indicate that equal weighting provides higher returns. Equal weighting gives more weight to value stocks and smaller-cap stocks in an index, which leads to superior performance over the long run.
This fund, because of its size and history, is given a portfolio weight of 40%.
PowerShares Russell 1000 Equal Weight ETF (EQAL)
This ETF includes the top 1,000 stocks by capitalization size and gives some exposure to mid-cap stocks. Mid-cap stocks historically have had higher returns than large caps. It is a new fund, however, and uses an innovative approach that needs some observation before comparing it to Guggenheim S&P 500 Equal Weight ETF.
For now, it is weighted at 20% of the portfolio.
Vanguard Mid-Cap Value ETF (VOE)
Mid-cap value has had higher returns than large stocks or mid-cap growth stocks.
It is weighted at 20% of the portfolio.
Vanguard REIT Index ETF (VNQ)
The returns of real estate investment trusts (REITs) have exceeded the returns of the S&P 500 over the long run and provide diversification as well.
This ETF is weighted at 20%.
The new approach to the Model Fund Portfolio is more aggressive than in the past, now including some holdings with an intermediate-term focus. The portfolio focuses on:
Portfolio changes are only made every three months, and are sent out in the monthly Model Portfolios Update email.
For the Model Fund Portfolio, the initial holdings are equally weighted. For the Level3 Passive Portfolio, the initial weightings are as previously indicated and as shown in Table 4. The approach to rebalancing in both cases is to keep it to a minimum. While momentum is less of a factor with funds than it might be with stocks, and transaction costs for funds are much less than for stocks, rebalancing frequently is a distraction and can make taxes a significant consideration.
You should be able to achieve almost all the rebalancing necessary when you add and withdraw funds or when changes are made in the holdings. In the 14 years of the Model Fund Portfolio, no rebalancing has been thought necessary. If over time a holding gets significantly out of line, adjustments can be made.
Decisions will have to be made by the individual since every investor will have added assets at a different time, so everyone’s weights will be different. But the following are some general guidelines:
Portfolio Strategies
AAII Model Portfolios

Jim Egbert from CO posted over 9 years ago:
John Lambert from NJ posted over 9 years ago:
John Hawkins from GA posted over 9 years ago:
Gordon Robinson from NC posted over 9 years ago:
John Lambert from NJ posted over 9 years ago:
Scott B from NJ posted over 9 years ago:
James Edwards from Alaska posted over 6 years ago:
Jean from AAII posted over 6 years ago:
You need to log in as a registered AAII user before commenting.
Log InCreate an account