The market made up for its summer doldrums with a very strong 2006 ending.
I pointed out in my last few columns that there was so much bullishness concerning 2007 that it might push the expected 2007 gains into late 2006. While this may have happened, I still think 2007 has a lot going for it, in addition to being the strongest year in the four-year election cycle.
There are several caveats, however. The current political deadlock in Washington may slow the usual “spend to get elected” mentality of Congress, thus reducing the usual economic push in the pre-election year.
To me, however, the scariest factor out there is the fact that all of the major brokerage research departments are bullish. This is quite rare, and would be very unsettling if I were not basically a buy-and-hold investor.
Portfolio Performance
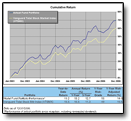
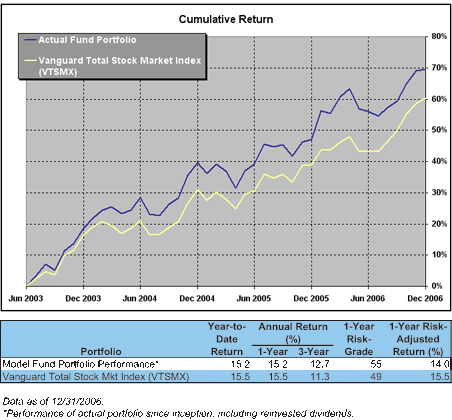
Our Model Mutual Fund Portfolio joined the general market in having strong final months. With a 2006 return of 15.2%, the actual portfolio was slightly below the market return of 15.5%, as represented by the Vanguard Total Stock Market Index fund (VTSMX).
Figure 1.
Model Fund Portfolio
Performance vs. Benchmark
|
|
CLICK ON IMAGE TO
SEE FULL SIZE.
|
|
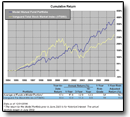
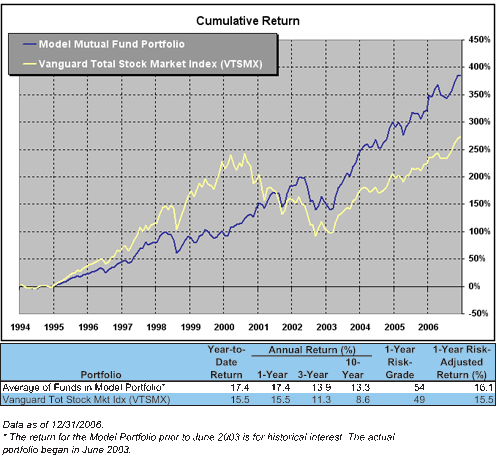
The Model Fund Portfolio continues to beat the market over the longer term, as can be seen in Figure 1 and Table 1. This was one of the better years for large-cap stocks, but for the entire year micro-caps still had the highest return.
Portfolio Changes
We made one change in the fund holdings. We sold Fenimore Value fund (FAMVX) and replaced it with American Century Equity Income fund (TWEIX). While FAMVX had not violated the rules as yet, it seemed likely to do so soon and was behaving strangely, as well as performing poorly over the last several years.
While Mairs & Power Growth (MPGFX) also had a below-average year, that may be due to the market cycle and we will retain it.
Figure 2.
Historical Performance
of Model Portfolio
vs. Benchmark
|
|
CLICK ON IMAGE TO
SEE FULL SIZE.
|
|
We don’t want to be switching funds based on short-term performance, because a fund with an investment style currently out of favor may be the strong fund next year. We want to judge not so much on what the strategy is (assuming it’s a valid strategy), but rather how well they implement that strategy.
We have adjusted the categories as needed with the market movement, and adjusted the asset limit for lower expense ratios from $3.0 to $3.5 billion, as can be seen in the Model Mutual Fund Portfolio: Selection Rules box on page 24 (Rule #6).
The Model ETF Portfolio
Our newest model portfolio is focused on exchange-traded funds (ETFs). The Model ETF Portfolio has been up and running for only three quarters, and we still view it as exploratory. Nonetheless, I will share the results here.
The return on the ETF portfolio was 10.8% over nine months as compared to 3.7% for the Fidelity NASDAQ Composite (ONEQ) and 11.0% for the iShares S&P; 500 Index (IVV). Results can be seen in Table 2.
| Table 2. AAII’s Model ETF Portfolio
|
| Weightings: It is recommended that the First Trust Dow Jones Select MicroCap Index, PowerShares FTSE RAFI US 1000, Rydex S&P; Mid-Cap 400 Pure Value, and Rydex S&P; Small-Cap 600 Pure Value funds be weighted equally as they are in the Model ETF Portfolio. The weighting of the iShares Cohen & Steers Realty fund can vary based on other real estate holdings. Since the Model ETF Portfolio has no other real estate, it was weighted equally in the actual portfolio. iShares Lehman 1-3 Year Treasury Bond fund would be used to reduce risk. Since the Model Portfolio is very long-term, the iShares Lehman 1-3 Year Treasury Bond fund was not included in the actual portfolio, but in the future we will show the risk and return effect of holding this exchange-traded fund.
|
| ETF (Ticker) |
Return
(%)* |
Style
(Estimate) |
Capitalization
(Estimate) |
| First Trust Dow Jones Select MicroCap Index (FDM) |
5.3 |
Blend |
Nano- & Micro-Cap |
| PowerShares FTSE RAFI US 1000 (PRF) |
12.4 |
Blend |
Mid- & Giant-Cap |
| Rydex S&P Mid-Cap 400 Pure Value (RFV) |
9.8 |
Value |
Mid-Cap |
| Rydex S&P Small-Cap 600 Pure Value (RZV) |
6 |
Value |
Micro- & Small-Cap |
| iShares Cohen & Steers Realty (ICF) |
20.5 |
REIT |
Large-Cap |
| Average of ETFs |
10.8 |
— |
— |
| Benchmarks |
| Fidelity Nasdaq Composite Index (ONEQ) |
3.7 |
Low Value |
Giant-Cap |
| iShares S&P 500 Index (IVV) |
11 |
Low Value |
Giant-Cap |
| iShares Lehman 1-3 Year Treasury Bond (SHY) |
3.5 |
na |
na |
*Return data from 4/1/2006 to 12/31/2006. Benchmark return data from S&P; Micropal.
Actual ETF Portfolio was started on 4/1/2006. |
The nine-month performance is a little distorted from what would be normal expectation. The first quarter of 2006, when we weren’t yet invested, was strong for most of our holdings relative to the overall market, while the fourth quarter was stronger for the overall market, which was dominated by the largest issues. This means that for the entire year of 2006, our portfolio would have performed better relative to the market.
On the other hand, we got quite a boost from our REIT (real estate investment trust) fund, iShares Cohen & Steers Realty (ICF). REITs continue to provide outstanding returns and may well continue to do this. Many individuals think of the volatility of the consumer housing market as a reason to avoid REITs, but REITs have little to do with the general housing market. The one small area of REITs that is related, apartment rental properties, does not always perform in concert with changes in housing prices.
What It’s Composed Of
The portfolio—when started April 1, 2006—had equal weights of First Trust Dow Jones Select MicroCap Index (FDM), PowerShares FTSE RAFI US 1000 (PRF), Rydex S&P; Mid-Cap 400 Pure Value (RFV), and Rydex S&P; Small-Cap 600 Pure Value (RZV) funds.
For the Model ETF Portfolio, we did not buy any shares of the iShares Lehman 1-3 Year Treasury Bond (SHY) fund. I outlined my rationale in my August 2006 column, noting that the amount invested in the REIT and short-term Treasuries ETFs should vary among investors based on other real estate holdings and risk preferences. Since we have no other real estate holdings, for the Model ETF Portfolio we invested an equal amount in the REIT ETF, iShares Cohen & Steers Realty fund. Our portfolio is geared to the very long term, so we did not buy any of the short-term Treasuries ETF, the iShares Lehman 1-3 Year Treasury Bond fund. When we have more experience with the portfolio, we will examine the impact different levels of this ETF would have on risk and return, so you can assess the proportion of it that might be needed to match your risk preference.
ETF Portfolio Changes
There are no changes in the Model ETF Portfolio.
While I like the approach of First Trust Dow Jones Select MicroCap Index fund, I am a little disappointed that the liquidity has not grown faster, as low liquidity can impact the bid/ask spread and ultimately the rate of return. We will monitor this over the next six months.
| Table 1. Tracking Error vs. Market Capitalization and Style Difference
|
| We categorize mutual funds by both the size and style of their stock holdings. Size is measured by the average market capitalization (share price times the number of shares outstanding) of the stocks held by the fund, and style is based on the price-to-book value ratios (price per share divided by net assets per share) of the underlying stocks. Here is how we break down these categories: |
| Size Category |
Market Cap |
| Giant-Cap |
$15 billion and greater |
| Large-Cap |
$7 billion to $14.9 billion |
| Mid-Cap |
$2.5 billion to $6.9 billion |
| Small-Cap |
$700 million to $2.4 billion |
| Micro-Cap |
$300 million to $699 million |
| Nano-Cap |
$0 to $299 million |
| Style Category |
Price-to-
Book-Value Ratio |
| Very High Value |
1.79 and below |
| High Value |
1.80 to 2.29 |
| Moderate Value (Blend) |
2.30 to 2.54 |
| Low Value (Growth) |
2.55 to 2.99 |
| Very Low Value (High Growth) |
3.00 and above |
Diversifying Internationally
As longer-term members know, I have never been a fan of foreign stocks or funds. I would buy them only if they met the same criteria set for U.S. holdings, but I would not buy them simply for diversification or speculation. My feeling is that their return, on average, is lower (some of this due to higher investment costs) and the risk reduction from such diversification is of a very short-term nature and not worth the reduction in return.
While this has been true over the long term, for several years now the returns of foreign investments have been improving relative to the U.S. market. I am now thinking that maybe this is not a short-term distortion due to currency values, but a long-term change. I intend to examine this more closely to see if the addition of foreign holdings would be worthwhile, particularly in the Model ETF Portfolio.
I will update you in my August 2007 AAII Model Portfolios column.
You may follow the Model Mutual Fund Portfolio on our Web site (www.aaii.com), but we won’t include the Model ETF Portfolio on the site until we have more history.





No comments have been added yet. Add your thoughts to the discussion!
You need to log in as a registered AAII user before commenting.
Log InCreate an account