For the three months ending February 28, AAII’s model Shadow Stock Portfolio didn’t match the 25.7% of the previous three months—but that would have been a bit much to expect.
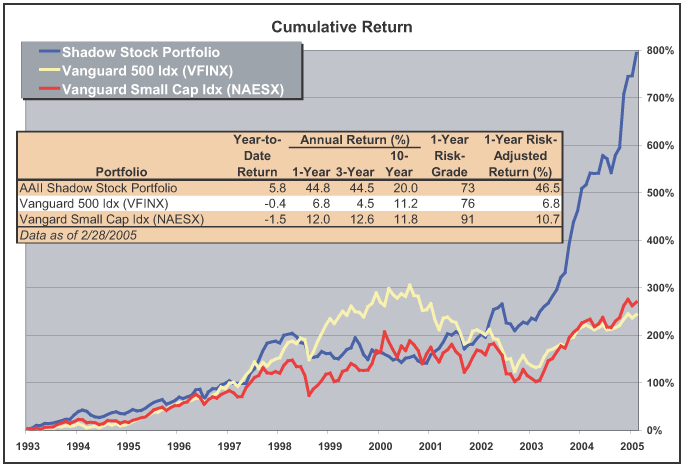
The portfolio is up 10.4% since November 30 and 5.8% for 2005 year-to-date, which compares quite favorably with the S&P’s 3.0% gain for the three months and 0.4% loss year-to-date. Results for various periods are shown in Figure 1.
This has been a tricky year for the general market so far. The year after presidential elections is the weakest year in the election cycle. However, for some unknown reason years ending in “5” have always been exceptionally strong. I pointed this out in my column in 1994 (“A Modest Timing Possibility Based on the Business Cycle,” November 1994 AAII Journal; available at AAII.com) when the market looked sick—and sure enough 1995 was a strong year, posting +37.4 % on the S&P 500.
While I can discern no rational reason for such a 10-year cycle, the S&P has averaged +33.6 % in years ending in five since 1935 and 27% when it was the year after an election.
Quarterly Changes
There were no changes in the AAII Shadow Stock Portfolio during the last three months, although two stocks on probation—AirNet Systems (ANS) and T-3 Energy Systems (TTES) did not file their quarterly earnings reports before February 28, which is the time we would make our changes for this quarter.
Therefore, we won’t make any decisions until our next quarterly deadline, with any changes reported in the July AAII Journal. But those of you with Stock Investor Pro [AAII’s stock research database and screening program] who evaluate monthly and act before we do can watch them.
| Table 2. First-Quarter 2005 Transactions |
| Company (Ticker) |
Reason |
Sell
No Transactions
Buy
No Transactions
|
|
Figure 1.
Shadow Stock Portfolio
Performance vs Benchmarks
(through 2/28/05)
|
|
CLICK ON IMAGE TO
SEE FULL SIZE.
|
|
Also, Metals USA (MUSA) is just a few dollars short of a market cap of $500,000, which would require a sale. Most likely it will be a sell in the second quarter, but things can change. Like Hub Group (HUBG) last quarter, it is migrating to what we consider to be small cap. In the Shadow Stock Portfolio, we buy stocks at nano-cap size (under $250 million), hold them through micro-cap size (up to $500 million) and sell them when they become small caps. These size definitions change with changes in the overall market, but the concept—investing in nano- and micro-caps—holds steady.
To conserve space we are not listing the Shadow Stock Portfolio Rules this issue. You can find them in the January 2005 issue or on our Web site in the Model Portfolios area. We will publish them again in the July issue of the Journal.
I can’t promise another 25% or even 10% quarter coming up—but who knows?



No comments have been added yet. Add your thoughts to the discussion!
You need to log in as a registered AAII user before commenting.
Log InCreate an account