



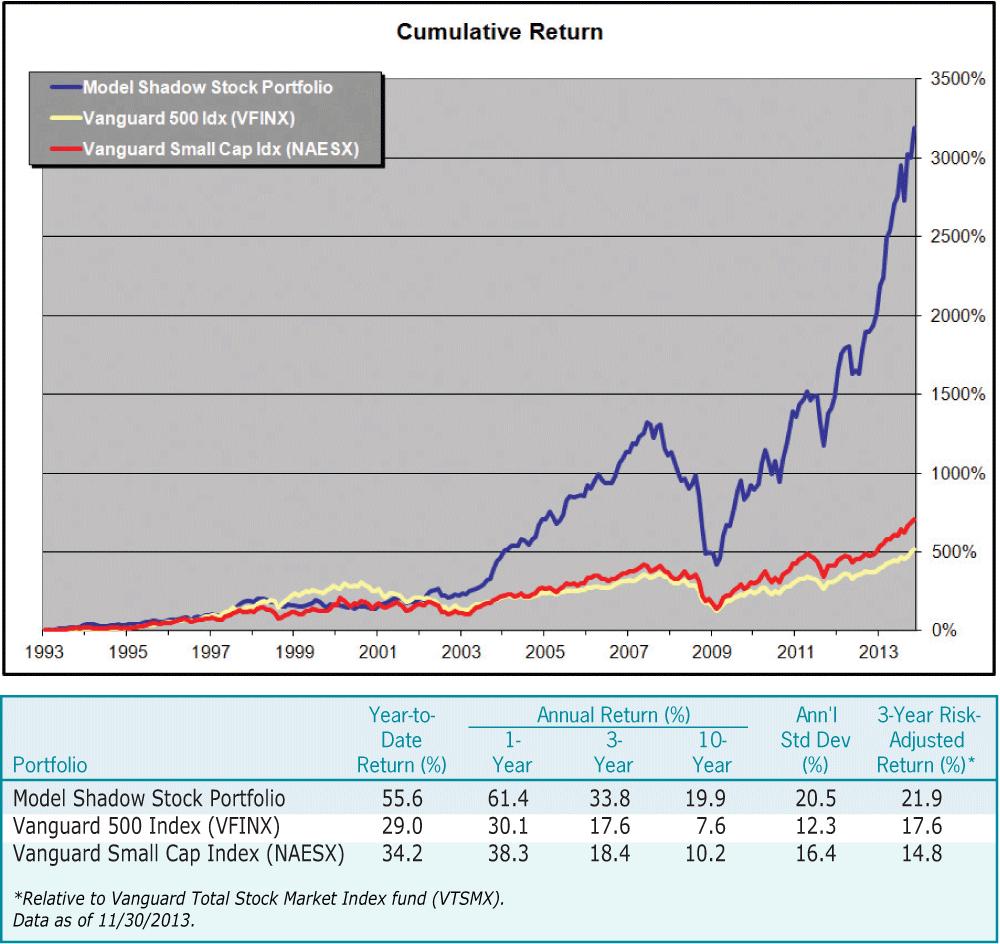
The Model Shadow Stock Portfolio is up 55.6% year-to-date compared to 29.0% for the S&P 500 index, as measured by the Vanguard 500 Index fund  (VFINX). Figure 1 shows the year-to-date returns as of November 30, 2013, as well as annual returns for one-, three- and 10-year periods.
This has been an exceptional year, and if the Model Shadow Stock Portfolio stays at this level it will be the third-best year in its 21-year history. As you can see in Table 3, the years 2003 and 2009 were both up over 70%.
Many pundits keep predicting a pullback. It may happen, but the market increase has about doubled since the dire predictions began.
We had been running a chart in this column showing the number of first-pass qualifying stocks at my quarterly review. If the number of stocks passing my initial screen each quarter had any predictive value, the market would have fallen six months ago, since very few stocks have been qualifying. Like most possible predictors of future market direction, it has not shown any meaningful guidance. Therefore, we are no longer showing historical figures here in chart form, although we may mention the number of qualifiers when discussing purchases.
Unusual Activity
There have been only a couple of times in 20 years where dramatic news came out right after a stock was purchased for the portfolio and before the purchase was reported to you. This time, it was Fab Universal Corp. (FU). The situation with Fab Universal involved a report of unexpected high earnings for the quarter with very positive predictions for the future. This drove the stock price up dramatically from $4.25 to an intraday high of $11.25. Shortly afterward, short sellers challenged the figures, emphasized the extreme dilution coming, and questioned the validity of the sales. (You can go online to SeekingAlpha.com for the details.) The stock price had dropped to $5.50 by the time we sent out an emergency notice to sell on November 20, and a few days later it stopped trading.
By the time we indicated our purchase, the stock had increased so much that its price-to-book-value ratio was far above 0.80; based on our rules, it should not have been purchased. If you purchased it on the way down when it qualified again (based on questionable data), I hope our emergency sell message got to you. If it did not, I would recommend selling it when you can, as we did in the actual portfolio.
The story of Fab Universal does present an opportunity to review two guidelines.
First, when we announce a purchase, enough AAII members may try to buy the stock that it moves the price up. This tends to even out and a little patience is usually rewarded. But as pointed out in the portfolio rules, you should not buy the stock if the price-to-book-value ratio goes higher than 0.80 (if there is a shortage of eligible stocks or you already have some of the stock, it is acceptable buy at a price-to-book-value ratio as high as 0.90). You can check the current price-to-book-value ratio in the Actual Portfolio table at the Model Shadow Stock Portfolio page on AAII.com, where the figures are updated in real time (go to www.aaii.com/model-portfolios/portfolio).
| Current Price |
52- Week High Low |
Market Cap | P/E Ratio | P/B Ratio | Div Yield | |||
| Company (Ticker) | ($) | ($) | ($) | ($ Mil) | (X) | (X) | (%) | Notes |
| Alamo Group, Inc. (ALG) | 58.71 | 58.95 | 31.15 | 709.2 | 20.9 | 2.08 | 0.5 | |
| Alpha and Omega Semicon (AOSL) | 7.75 | 9.30 | 6.64 | 199.2 | nmf | 0.70 | 0.0 | earnings probation (2013 Q4) |
| CSS Industries Inc. (CSS) | 31.14 | 31.94 | 20.11 | 288.9 | 15.7 | 1.17 | 1.9 | |
| Ducommun Incorporated (DCO) | 25.34 | 30.98 | 14.32 | 273.2 | 15.7 | 1.13 | 0.0 | |
| Ennis, Inc. (EBF) | 18.54 | 19.59 | 13.92 | 486.1 | 15.3 | 1.29 | 3.8 | |
| Five Star Quality Care (FVE)* | 4.93 | 6.87 | 4.44 | 238.0 | 18.3 | 0.77 | 0.0 | qualifed as of 11/30/2013 |
| Flexsteel Industries (FLXS) | 27.66 | 28.10 | 18.56 | 198.6 | 14.6 | 1.28 | 2.2 | |
| Gilat Satellite Networks (GILT) | 4.45 | 6.20 | 4.37 | 187.0 | nmf | 0.79 | 0.0 | earnings probation (2013 Q3) |
| Hardinge Inc. (HDNG) | 15.49 | 16.88 | 9.27 | 184.1 | 15.6 | 1.07 | 0.5 | |
| Hooker Furniture Corp. (HOFT) | 17.08 | 18.31 | 13.33 | 183.7 | 18.6 | 1.38 | 2.3 | |
| International Shipholding (ISH) | 28.31 | 32.12 | 15.95 | 205.2 | 12.8 | 0.71 | 3.5 | qualifed as of 11/30/2013 |
| Key Tronic Corporation (KTCC) | 10.52 | 12.28 | 8.95 | 110.8 | 10.8 | 1.15 | 0.0 | |
| Kimball International (KBALB) | 14.89 | 15.02 | 8.48 | 449.1 | 23.6 | 1.38 | 1.3 | |
| LMI Aerospace, Inc. (LMIA) | 12.69 | 23.20 | 10.81 | 163.1 | 16.9 | 0.76 | 0.0 | qualifed as of 11/30/2013 |
| Marlin Business Services (MRLN) | 24.85 | 28.64 | 15.46 | 323.2 | 21.1 | 1.70 | 1.8 | |
| Medical Action Industries (MDCI) | 8.60 | 10.07 | 2.53 | 141.0 | nmf | 1.46 | 0.0 | |
| Mitcham Industries (MIND) | 17.50 | 18.41 | 11.51 | 224.7 | 30.2 | 1.27 | 0.0 | |
| Olympic Steel, Inc. (ZEUS) | 28.07 | 31.68 | 18.10 | 307.7 | nmf | 1.04 | 0.3 | |
| PC Connection, Inc. (PCCC) | 21.73 | 22.34 | 10.00 | 568.7 | 16.6 | 1.78 | 0.0 | |
| PCM Inc. (PCMI) | 9.50 | 11.96 | 5.66 | 111.2 | 13.2 | 0.89 | 0.0 | |
| RCM Technologies (RCMT) | 6.46 | 6.97 | 5.00 | 79.9 | 17.5 | 1.27 | 0.0 | |
| Renewable Energy Group (REGI) | 11.37 | 16.50 | 5.42 | 414.5 | 2.9 | 0.70 | 0.0 | |
| REX American Resources (REX) | 32.74 | 41.00 | 17.12 | 267.4 | 57.4 | 1.05 | 0.0 | |
| Rocky Brands Inc. (RCKY) | 15.24 | 19.97 | 12.56 | 114.6 | 10.8 | 0.90 | 2.6 | |
| Salem Communications (SALM) | 8.99 | 10.14 | 4.97 | 224.0 | nmf | 1.14 | 2.4 | earnings probation (2013 Q1) |
| Shoe Carnival, Inc. (SCVL) | 28.93 | 29.00 | 18.80 | 592.8 | 19.2 | 1.88 | 0.8 | |
|
Standard Motor Products (SMP) |
34.72 | 39.99 | 19.03 | 802.3 | 16.1 | 2.30 | 1.3 | |
| TravelCenters of America (TA) | 10.63 | 12.50 | 4.18 | 314.3 | 18.3 | 0.79 | 0.0 | |
| VOXX International (VOXX) | 17.84 | 18.00 | 6.21 | 433.2 | 14.0 | 0.96 | 0.0 | |
| Willis Lease Finance (WLFC) | 18.23 | 18.24 | 11.70 | 153.7 | 18.2 | 0.74 | 0.0 | |
| *Company is new to the portfolio as of 12/2/2013. | ||||||||
| Source: AAII’s Stock Investor Pro/Thomson Reuters. Data as of November 30, 2013. | ||||||||
Explanation of Notes
Approaching Size Limit: Stocks are sold if their market capitalization goes above three times the initial maximum criterion. The current market capitalization maximum for initial screening is $300 million. Stocks are marked “approaching size limit” if their current market cap exceeds 2½ times the initial criterion, or $750 million.
Approaching Value Limit: Stocks are sold once their price-to-book-value ratio goes above three times the initial criterion. The current initial price-to-book ceiling is 0.80. Stocks are marked “approaching value limit” if their current price-to-book-value ratio exceeds 2½ times the initial criterion, or 2.00.
Earnings Probation: If the last 12 months’ earnings from continuing operations are negative, the stock is put on probation; if a subsequent quarter has negative earnings prior to 12-month earnings becoming positive, the stock is sold. The date within the parentheses lists the fiscal quarter during which the company first reported negative trailing 12-month earnings.
Qualified as of: Stock still qualified as a buy when the screen was run with current data. Stocks that don’t currently qualify as a buy are held until they meet one of the sell rules.
Second, you should also check the news about the stock to make sure a negative earnings or other disqualifying report did not come out between our purchase date and the date when you are buying. Yahoo! Finance (finance.yahoo.com) or your broker’s website will list such news items. News can push the stock price up or down. If the stock is violating one of the buy rules, do not buy it. If it is not clear what the impact of the news item (tender offer, class-action lawsuit, etc.) will be, avoid the stock. Bad things will occasionally happen, but they tend to be offset by unexpected good things and a diversified portfolio reduces shocks significantly.
Rule Change
Due to the impact that the bull market is having on the overall market capitalization of stocks, we are increasing the maximum market cap buy criterion to $300 million.
This raises our selling point to $900 million (three times the initial maximum) and our warning level to $750 million (two and a half times the initial maximum).
Portfolio Changes
Table 1 shows the current holdings in the Model Stock Portfolio.
We sold Fab Universal on an emergency basis due to uncertainty about the validity of their data. In the past, we have eliminated Chinese stocks; in the future, we will eliminate U.S.-based companies whose main business is in China as well.
| Company | Reason |
| Buy | |
| Five Star Quality Care, Inc. (FVE) | |
| Purchased Additional Shares With Excess Cash | |
| LMI Aerospace, Inc. (LMIA) | |
| Sell | |
|
Addus Homecare Corp. (ADUS) |
exceeded value limit |
| Fab Universal Corp. (FU) | allegations of fraud & corporate misconduct |
We also sold Addus Homecare Corp. (ADUS) because it went over the price-to-book limit of 2.40 (three times the initial criterion of 0.80) and is no longer a value stock.
We bought Five Star Quality Care Inc. (FVE) and added to our holding of LMI Aerospace Inc. (LMIA), which still qualified, because we had excess funds and did not have enough cash to buy a full position in September when it was initially added to the portfolio.
Because of the increase in the permissible market cap to $300 million, (raising the sell requirement to $900 million), we did not have to sell Standard Motor Products (SMP) this month.
Changes are summarized in Table 2.
Looking Ahead
As of this writing, we now know President Obama’s choice for Federal Reserve chairman, and the first reduction in quantitative easing (the Fed’s bond-buying program) was announced just before we went to press. Many gurus believe the stock market will weaken with the tapering of quantitative easing because of investors switching from stocks to bonds. Given that continued tapering will depend on a strengthening economy, any hit to the stock market should be short-lived, particularly if earnings continue to be strong.
The election cycle indicator has been so far off the mark lately that I hesitate to even mention it, but the second year in the cycle (2014) has historically been slightly below the overall average at 11.5%. However, 2013 would have been up only 6.7% based on the first-year election cycle average since 1935, so I wouldn’t take the cycle indicator too seriously.
| Average Annual Return (%) | Cumulative Value of $10,000 ($) | |||||
| Model | Vanguard | Vanguard | Model | Vanguard | Vanguard | |
| Shadow | 500 | Small Cap | Shadow | 500 | Small Cap | |
| Stock | Index | Index | Stock | Index | Index | |
| Year | Portfolio |
(VFINX) |
(NAESX) | Portfolio |
(VFINX) |
(NAESX) |
| 1993 | 32.3 | 9.9 | 18.7 | 13,230 | 10,989 | 11,870 |
| 1994 | 2.0 | 1.2 | -0.5 | 13,492 | 11,118 | 11,810 |
| 1995 | 20.7 | 37.4 | 28.7 | 16,291 | 15,282 | 15,204 |
| 1996 | 22.3 | 22.9 | 18.1 | 19,927 | 18,775 | 17,959 |
| 1997 | 44.3 | 33.2 | 24.6 | 28,756 | 25,010 | 22,375 |
| 1998 | -8.9 | 28.6 | -2.6 | 26,188 | 32,168 | 21,790 |
| 1999 | 0.0 | 21.1 | 23.1 | 26,187 | 38,945 | 26,831 |
| 2000 | -7.7 | -9.1 | -2.7 | 24,163 | 35,418 | 26,116 |
| 2001 | 21.4 | -12.0 | 3.1 | 29,325 | 31,160 | 26,926 |
| 2002 | 10.8 | -22.1 | -20.0 | 32,506 | 24,259 | 21,535 |
| 2003 | 73.1 | 28.5 | 45.6 | 56,268 | 31,174 | 31,360 |
| 2004 | 43.7 | 10.8 | 19.9 | 80,843 | 34,530 | 37,587 |
| 2005 | 17.9 | 4.8 | 7.4 | 95,353 | 36,180 | 40,376 |
| 2006 | 29.4 | 15.6 | 15.6 | 123,363 | 41,832 | 46,687 |
| 2007 | -1.8 | 5.4 | 1.2 | 121,166 | 44,083 | 47,227 |
| 2008 | -50.8 | -37.0 | -36.0 | 59,582 | 27,764 | 30,217 |
| 2009 | 72.3 | 26.5 | 36.1 | 102,665 | 35,120 | 41,130 |
| 2010 | 45.4 | 14.9 | 27.7 | 149,238 | 40,358 | 52,529 |
| 2011 | 6.3 | 2.0 | -2.8 | 158,701 | 41,155 | 51,067 |
| 2012 | 33.3 | 15.8 | 18.0 | 211,588 | 47,666 | 60,274 |
| YTD | 55.6 | 29.0 | 34.2 | 329,136 | 61,467 | 80,887 |
| Since Incep | 18.2 | 9.1 | 10.5 | 329,136 | 61,467 | 80,887 |
The next column on the Model Shadow Stock Portfolio will be in the April AAII Journal. In the meantime, you can follow updates at AAII.com and through the AAII Model Portfolios Update email (sign up at www.aaii.com/email).
Model Shadow Stock Portfolio Rules
Purchase and Sales Rules
Stock purchases must meet these criteria:
- No bulletin board or pink sheet stocks will be purchased.
- Price-to-book-value ratio must be less than 0.80. If the price-to-book-value ratio moved up a bit since the stock was included in the portfolio, it is still OK to purchase the stock unless this ratio goes above 0.90. (Figure will change gradually with changes in overall market values.)
- Market capitalization must be between $30 million and $300 million. (Figure will change gradually with changes in overall market values.)
- The firm’s last quarter and last 12 months’ earnings from continuing operations must be positive.
- No financial stocks or limited partnerships will be purchased.
- No stocks on foreign exchanges or ADRs will be purchased because of different accounting and/or withholding tax on dividends.
- The share price must be greater than $4.
- In order to reduce trading by avoiding stocks that are forever marginal, any stock that was sold within two years will not be rebought.
- Note second item under Stock Order Guidance concerning spreads when buying shares.
- Price-to-sales ratio must be less than 1.2. (Figure may change gradually with changes in overall market values.)
- Eliminate any company that failed to file a 10-Q (quarterly) report in the last six months.
Stocks are sold if any of the following occur:
- If last 12 months’ earnings from continuing operations are negative, the stock is put on probation; if a subsequent quarter has negative earnings prior to 12-month earnings from continuing operations becoming positive, the stock is sold.
- The stock’s price-to-book-value ratio goes above three times the initial criterion.
- Market capitalization goes above three times the initial maximum criterion.
Stock Order Guidance
- These rules are for general guidance. Your own experience, market conditions and the size of the position will impact your own decisions. The results in the model portfolio were obtained while sometimes paying more.
- Market orders are not used. Instead, if the quoted bid-ask spread is less than 2% (ask price minus bid price, divided by ask price), place a limit order at the ask price for a buy and at the bid price for a sell. If the bid-ask spread is more than 2%, try to place a limit order between the bid and ask prices to keep transaction costs low. If necessary, build a position gradually. With low commissions, it is often better to place partial orders than to try to establish a large position all at once. Be patient.
- The average daily dollar volume should be at least four times the amount needed for your position. This will ensure liquidity to get in and out of the position, even if you need to grow the position gradually and sell gradually. This will result in a varying number of qualifying stocks for each investor.
- For NASDAQ stocks, it appears to be better to use day orders. If the order is not filled, it is placed again with a slight adjustment. For NYSE and Amex stocks, good-till-canceled (GTC) orders are used to keep a place in line in the specialists’ books. If the market isn’t close to the desired price, the price is adjusted in a few days with a new GTC order.
- If price changes cause a stock to become ineligible (due to changes in price-to-book-value ratio or market capitalization) when only part of the order has been filled, stocks already purchased are kept but the balance of the order is canceled.
Management Rules
- Equal dollar amounts are invested in each stock initially.
- Decisions are made only at the end of each quarter. In order to react to the majority of earnings reports as soon as possible, quarterly reviews are made in February, May, August, and November.
- Best judgment is used for tenders or mergers, but all criteria must be obeyed.
- At the end of a quarter, if receipts from stocks sold exceed requirements for new purchases, the excess receipts—up to 5% of the portfolio’s value—are kept in cash until the next quarter. If the excess receipts are greater than 5% of the total portfolio value, the amount above 5% is distributed to smaller holdings that still qualify as buys. Efficient quantities are purchased: If over 10% of the portfolio is in cash, the price-to-book-value ratio can be moved up, but never over 0.90.
- At the end of a quarter, if receipts from stock sales are insufficient to buy all newly qualifying stocks, purchases are made in order of lowest bid/ask spreads.
- Note that if you are managing your own portfolio, it should consist of at least 10 stocks. If you are developing the portfolio gradually, you can do it stock by stock, but don’t put more than 10% of your funds in each additional stock. More than 20 stocks is not needed until the portfolio exceeds $1 million.
Happy New Year!
Discussion
FREE REPORT

William Horsfall from NY posted over 12 years ago:
Joseph Hoffman from TN posted over 12 years ago:
Charles Rotblut from IL posted over 12 years ago:
Jeff Goodwin from CA posted over 12 years ago:
Joel Gitnick from NJ posted over 12 years ago:
Richard Dimattia from NJ posted over 12 years ago:
William Ford from IN posted over 12 years ago:
Bill R. Vickery from NM posted over 12 years ago:
Bill R. Vickery from NM posted over 12 years ago:
Nicholas Caringi from FL posted over 12 years ago:
Charles Rotblut from IL posted over 12 years ago:
Fred Coffinger from AZ posted over 12 years ago:
Harvey Ganz from CA posted over 12 years ago:
Edward Schaul from OK posted over 12 years ago:
Charles Rotblut from IL posted over 12 years ago:
Edward Schaul from OK posted over 12 years ago:
James Cloonan from IL posted over 12 years ago:
Ken Jones from FL posted over 12 years ago:
Bill Rusk from Ohio posted over 12 years ago:
Vaughan from NZ posted over 12 years ago:
James Mate from OH posted over 12 years ago:
Carol Krausz from IL posted over 12 years ago:
James Mate from OH posted over 12 years ago:
Richard Orwoll from NC posted over 12 years ago:
S Burrill from MI posted over 12 years ago:
James Mate from OH posted over 12 years ago:
Richard Orwoll from NC posted over 12 years ago:
Charles Rotblut from IL posted over 12 years ago:
Fred Coffinger from AZ posted over 12 years ago:
James Merritt from OR posted over 12 years ago:
Charles Rotblut from IL posted over 12 years ago:
Fred Coffinger from AZ posted over 12 years ago:
J Stensvold from MN posted over 12 years ago:
Harry Ploss from TX posted over 12 years ago:
You need to log in as a registered AAII user before commenting.
Log InCreate an account