The end of February saw volatility returning to the market with a vengeance, and it is continuing into March as I write this. Shadow Stock trades were placed during that ‘exciting’—albeit nerve-wracking—week, as it fell during our regular quarterly review period.
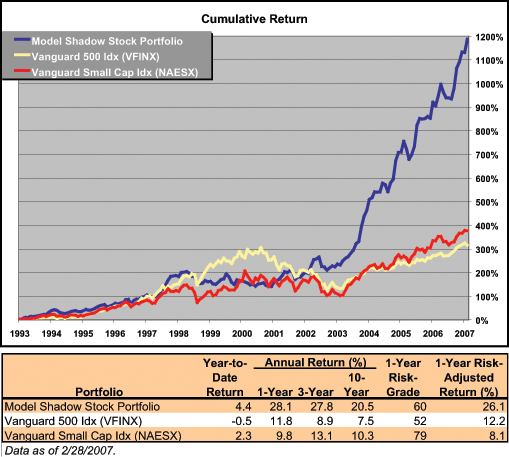
Despite the market adjustment, the Model Shadow Stock Portfolio managed to stay ahead of the market. As of February 28, 2007, the Model Shadow Stock Portfolio was up 4.4% year-to-date, compared to –0.5% for the Vanguard 500 Index fund (VFINX) and +2.3% for the Vanguard Small Cap Index fund (NAESX).
The Shadow Stock Portfolio is doing better than the market in what is either a resumption of the long-term uptrend or a short-term respite from a lengthier downtrend. By the time you read this, the situation should be clearer. I still would bet on an up year, but since I am a buy-and-holder, it doesn’t make much difference to me.
Figure 1.
Model Shadow Stock
Portfolio vs. Benchmarks
(Through 2/28/07)
|
|
CLICK ON IMAGE TO
SEE FULL SIZE.
|
|
Figure 1 provides returns for various cumulative periods for the portfolio and comparative indexes.
As we have done every so often in the past, we are including results for the entire history of the Model Shadow Stock Portfolio in Table 1.
Awhile back we compared the portfolio results with the results achieved by formal advisory services as covered in The Hulbert Financial Digest. A number of you asked that we continue doing this on some kind of a regular basis, so we have decided to do it annually. Table 2 shows the results through year-end 2006 for five-year and 10-year annualized comparisons (while it doesn’t seem possible to me, next year we will have 15 years of performance to compare). For the 10-year period, the Model Shadow Stock Portfolio would have been #1 among the newsletters Hulbert tracks, and for the five-year period it would have come in at #2.
| |

|
| Table 2. The Model Shadow Stock Portfolio vs. Advisor Newsletters
|
| Last 5 Years |
Annual Return
(%) |
| Shadow Stock Portfolio |
33.3 |
| DJ Wilshire 5000 Index |
7.4 |
| Hulbert Financial Digest Top Newsletter* |
34.3 |
| Last 10 Years |
Annual Return
(%) |
| Shadow Stock Portfolio |
20.0 |
| DJ Wilshire 5000 Index |
8.6 |
| Hulbert Financial Digest Top Newsletter* |
19.2 |
* Newsletter with the highest return for the indicated period.
Data as of 12/31/2006. |
Quarterly Portfolio Activity
Table 3 shows the current holdings and their status as of March 9, 2007, and Table 4 highlights activity in the portfolio during the three months ending February 28, 2007.
Stocks no longer held include a tender offer and a few stocks that met sell rules:
- Sands Regent (SNDS) was bought out for cash;
- Bon-Ton Stores (BONT) was sold because of earnings, but also because reorganization has pushed the market cap and price-to-book ratio beyond what is appropriate for our portfolio; and
- Lazare Kaplan International (LKI) and Pomeroy IT Solutions (PMRY) were sold for violating their earnings probation.
We didn’t sell Blair Corporation (BL) even though it is to be bought out because we didn’t need the funds. The premium is very small, however, and if you are holding it in your own portfolio and need funds for purchases, you can sell it now anywhere near the buyout price of $42.50.
There were several purchases, this quarter:
- L.S. Starrett Co. (SCX),
- Merix Corp (MERX),
- P&F; Industries (PFIN), and
- Additional shares of existing holdings Rex Stores Corp. (RSC), Rocky Brands, Inc. (RCKY), and SigmaTron International (SGMA).
As an example of random events, Rocky Brands came out with negative earnings a week after we purchased the shares, so it does not qualify now.
In November 2005 we bought Bonso Electronics (BNSO) and continue to hold it. Several of you have pointed out that it is really a foreign stock, which we overlooked. However, since it isn’t currently paying a dividend (which would complicate tax matters) we will continue to hold it.
Another example of how screening programs can mislead you is our purchase of California Coastal Communities (CALC). There was an extraordinary dividend of $12.50 per share, which reduced the book value and put the price-to-book ratio above our 0.80 purchase ceiling. However, at a price-to-book of 1.75, it is not so high that we would sell it under normal circumstances, so we will hold it.
We do screen for news that has come out after the date of the Stock Investor Pro data that we use, but we will check several sources from now on and suggest you do the same if you are screening stocks on your own.
| Table 4. First-Quarter 2007 Transactions
|
| Company (Ticker) |
Reason |
| Tender |
| Sands Regent (SNDS) |
acquired by Herbst Gaming, Inc. |
| Buy |
| L.S. Starrett Company (SCX) |
|
| Merix Corporation (MERX) |
|
| P&F; Industries, Inc. (PFIN) |
|
| Rex Stores Corp. (RSC) |
purchased additional shares with excess cash |
| Rocky Brands, Inc. (RCKY) |
purchased additional shares with excess cash |
| Rex Stores Corp. (RSC) |
SigmaTron International, Inc. (SGMA) |
| Sell |
| Bon-Ton Stores, Inc., The (BONT) |
negative earnings |
| Lazare Kaplan Intern’l (LKI) |
negative earnings |
| Pomeroy IT Solutions, Inc. (PMRY) |
negative earnings |
The Outlook
While I don’t pretend to be able to predict or time the market, I feel a bit better about the coming year, since now not all analysts are bullish. I could wish for a repeat of 2003, the last year in this phase of the election cycle. The market was weak and down until March, when it turned strongly up.
While cycles tend to repeat, there is always a great deal of variation in the exact shape of the wave. As I mentioned before, this time the difference could be that Congress, usually spending like crazy before the primaries, might be deadlocked enough to prevent the usual boost to the economy. In addition, the Democrats are accusing the Republicans of overspending, which might limit their ability to push spending as much as usual in the pre-election year.
The next Shadow Stock Portfolio column will be in the July issue, but monthly updates as well as the Portfolio Rules can be found in the Shadow Stock Portfolio area of AAII.com.




No comments have been added yet. Add your thoughts to the discussion!
You need to log in as a registered AAII user before commenting.
Log InCreate an account