



The stock market is lethargic, but it is up a bit for the year, as is the Model Shadow Stock Portfolio.
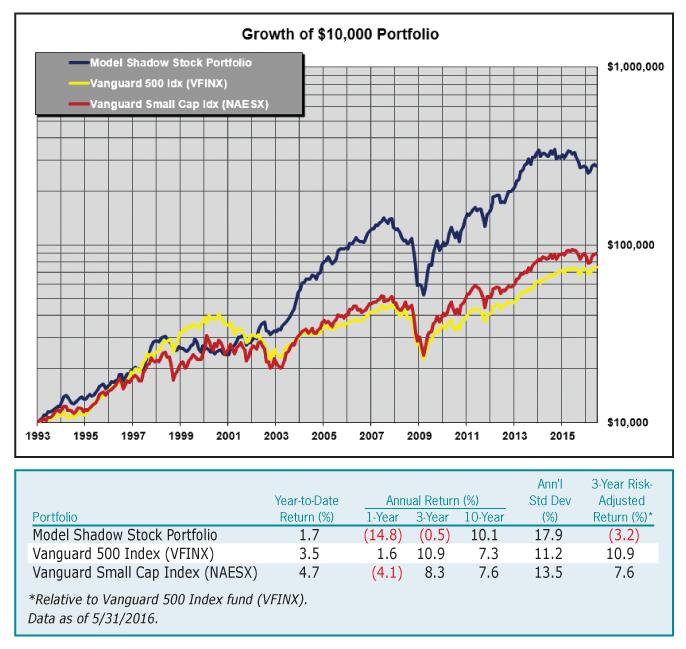
The Model Shadow Stock Portfolio is up 1.7% year to date as of May 31, compared to 3.5% for the S&P 500 as measured by the Vanguard 500 Index fund  (VFINX).
Results for other periods are shown in Figure 1 and Table 3.
The market action in the short run continues to be a little perverse in that if the economy looks better, then investors worry that the Federal Reserve will raise rates and get bearish.
This is like not wanting your broken leg to heal because they’ll take your crutches away.
No Portfolio Changes
Table 1 presents the current holdings in the portfolio. As shown in Table 2, there were no changes this quarter because no stocks qualified for sale.
However, a number of qualifying stocks continue to pass the purchase criteria. This is one of the limitations in evaluating a market strategy with a real portfolio. In the real world, you have limited assets, so you can only buy when you sell or obtain additional funds. The results are real, however, unlike with simulations where there are many unknowns.
Future Adjustments
In doing the research for my forthcoming book, “Investing at Level3” (go to www.Level3Investing.com for details), I had a chance to review the various strategies for selecting stocks that appear to outperform the market and have been tested through the years. The primary criteria used by the Model Shadow Stock Portfolio—low price-to-book-value ratio, low price-to-sales ratio, and small market capitalization—continue to hold up as the most important predictors of future returns. There are several other factors, however, that are quite promising and seem to work well as supplements to our current criteria.
Table 1. The Model Shadow Stock Portfolio
| Company (Ticker) | Current Price ($) | 52-Week | Market Cap ($ Mil) | P/E Ratio (X) | P/B Ratio (X) | Div Yield (%) | Notes | |
| High $ | Low $ | |||||||
| Alamo Group, Inc. (ALG) | 61.64 | 61.82 | 43.98 | 698.0 | 15.9 | 1.88 | 0.6 | |
| CDI Corp. (CDI) | 6.35 | 14.68 | 4.31 | 119.8 | nmf | 0.57 | 8.2 | earnings probation (2016q1) |
| CSS Industries Inc. (CSS) | 26.74 | 31.61 | 24.11 | 248.2 | 14.2 | 0.89 | 3.0 | |
| Ducommun Inc. (DCO) | 16.90 | 27.00 | 12.28 | 186.4 | — | 0.93 | 0.0 | earnings probation (2015q3) |
| Ennis, Inc. (EBF) | 18.26 | 21.55 | 14.68 | 479.4 | 13.1 | 1.58 | 3.8 | |
| Flexsteel Industries (FLXS) | 40.90 | 48.67 | 27.25 | 322.2 | 13.4 | 1.53 | 1.8 | |
| Global Power Equip** (GLPW) | 1.74 | 8.07 | 1.50 | 22.9 | nmf | nmf | nmf | |
| Hardinge Inc. (HDNG) | 10.44 | 13.72 | 7.85 | 139.0 | 49.7 | 0.82 | 0.8 | |
| Hooker Furniture Corp. (HOFT) | 24.19 | 35.95 | 22.16 | 284.1 | 16.2 | 1.67 | 1.7 | |
| Key Tronic Corp. (KTCC) | 8.91 | 11.35 | 6.09 | 84.7 | 14.7 | 0.91 | 0.0 | qualified as of 5/31/2016 |
| Kimball Electronics (KE) | 11.27 | 17.01 | 9.15 | 321.7 | 13.8 | 1.00 | 0.0 | |
| L S Starrett Co. (SCX) | 12.15 | 19.28 | 8.40 | 87.8 | 275.3 | 0.80 | 3.3 | qualified as of 5/31/2016 |
| LMI Aerospace, Inc. (LMIA) | 8.42 | 12.25 | 8.06 | 114.4 | nmf | 0.93 | 0.0 | earnings probation (2016q1) |
| Marlin Business Services (MRLN) | 15.16 | 19.29 | 12.62 | 188.9 | 12.3 | 1.21 | 3.7 | |
| PC Connection (PCCC) | 22.99 | 27.16 | 19.19 | 609.8 | 13.0 | 1.52 | 0.0 | |
| PCM Inc. (PCMI) | 10.80 | 10.84 | 7.48 | 125.1 | nmf* | 1.17 | 0.0 | |
| RCM Technologies Inc. (RCMT) | 5.37 | 6.00 | 4.16 | 66.6 | 12.2 | 2.01 | 0.0 | |
| Renewable Energy Group (REGI) | 9.21 | 12.80 | 6.02 | 391.7 | nmf* | 0.66 | 0.0 | |
| REX American Resources (REX) | 58.42 | 66.17 | 43.50 | 382.4 | 13.7 | 1.28 | 0.0 | |
| Rocky Brands Inc. (RCKY) | 11.40 | 20.32 | 9.67 | 86.3 | 17.3 | 0.61 | 3.9 | |
| Salem Media Group (SALM) | 6.61 | 8.17 | 3.60 | 172.2 | 15.3 | 0.80 | 3.9 | qualified as of 5/31/2016 |
| Seneca Foods Corp. (SENEA) | 31.22 | 35.83 | 25.85 | 314.8 | 7.3 | 0.79 | 0.0 | |
| Shoe Carnival, Inc. (SCVL) | 23.30 | 30.00 | 17.36 | 460.8 | nmf* | 1.26 | 1.1 | |
| SigmaTron International (SGMA) | 5.88 | 9.12 | 5.02 | 24.2 | 11.2 | 0.41 | 0.0 | |
| Townsquare Media Inc. (TSQ) | 8.83 | 14.13 | 7.95 | 159.3 | 109.4 | 0.44 | 0.0 | |
| TravelCenters of America LLC (TA) | 7.07 | 17.09 | 6.41 | 279.7 | 126.3 | 0.48 | 0.0 | |
| Ultra Clean Holdings (UCTT) | 5.70 | 8.16 | 4.50 | 192.7 | nmf* | 0.93 | 0.0 | |
| Vishay Precision Group (VPG) | 13.51 | 15.75 | 10.25 | 178.8 | nmf* | 1.02 | 0.0 | |
| VOXX International (VOXX) | 3.31 | 9.61 | 2.94 | 77.8 | nmf* | 0.21 | 0.0 | |
| Willis Lease Finance (WLFC) | 24.46 | 25.67 | 15.11 | 180.8 | 21.2 | 0.83 | 0.0 | qualified as of 5/31/2016 |
|
nmf = no meaningful figure. *Trailing four-quarter GAAP earnings negative, but adjusted earnings positive. **Global Power was delisted on 3/31/2016 after failing to meet the NYSE deadline for restating its 2013 and 2014 financial statements. Source: AAII’s Stock Investor Pro/Thomson Reuters and Morningstar.com. Data as of 5/31/2016. |
||||||||
|
Approaching Size Limit: Stocks are sold if their market capitalization goes above three times the initial maximum criterion and there is a stock to replace it. The current market capitalization maximum for initial screening is $300 million. Stocks are marked “approaching size limit” if their current market cap exceeds 2½ times the initial criterion, or $750 million.
Earnings Probation: If the last 12 months’ earnings from continuing operations are negative, the stock is put on probation; if a subsequent quarter has negative earnings prior to 12-month earnings becoming positive, the stock is sold. The date in parentheses is the fiscal quarter during which the company first reported negative trailing 12-month earnings. See the Model Shadow Stock Portfolio area of AAII.com for more information. |
||||||||
Table 2. Second-Quarter 2016 Transactions
|
Sell |
|
| Company (Ticker) | Reason |
| There are no sells this quarter. | |
|
Buy |
|
| Company (Ticker) | Maximum Price to Pay |
| There are no buys this quarter. | |
I am working on ways that these other filters might be integrated into our model—if not as primary criteria, then as a tie-breakers when there are more qualifying stocks than needed. I hope to make some adjustments to the portfolio’s rules this year after completing my analysis. However, small market cap and low price-to-book ratio will always be major criteria for the Model Shadow Stock Portfolio.
Looking Ahead
The future is always uncertain, but sometimes it seems more uncertain than usual. This is one of those times. The market uncertainty is increased because there seems to be such a balance between potential good and potential bad. Price-earnings ratios are above average but corporate profits could turn up quickly.
The political landscape is certainly not clear and the variations in proposed tax plans are incredibly wide. Of course, if we get one party in the White House and another controlling Congress, the changes might not be so great. But then we might not get anything done.
The next six months are going to be unusual, to say the least. We are probably not going to have much more clarity three months from now, when my next Model Shadow Stock Portfolio column appears in the October AAII Journal. In the meantime, you can follow the portfolio at AAII.com.
Table 3. Model Shadow Stock Portfolio: Annual Performance
|
|
Average Annual Return (%) | Cumulative Growth of $10,000 ($) | ||||
|
|
Model Shadow Stock Portfolio |
Vanguard 500 Index (VFINX) |
Vanguard Small Cap Index (NAESX) | Model Shadow Stock Portfolio |
Vanguard 500 Index (VFINX) |
Vanguard Small Cap Index (NAESX) |
|
|
||||||
|
|
||||||
| Year | ||||||
| 1993 | 32.3 | 9.9 | 18.7 | 13,230 | 10,989 | 11,870 |
| 1994 | 2.0 | 1.2 | -0.5 | 13,492 | 11,118 | 11,810 |
| 1995 | 20.7 | 37.4 | 28.7 | 16,291 | 15,282 | 15,204 |
| 1996 | 22.3 | 22.9 | 18.1 | 19,927 | 18,775 | 17,959 |
| 1997 | 44.3 | 33.2 | 24.6 | 28,756 | 25,010 | 22,375 |
| 1998 | -8.9 | 28.6 | -2.6 | 26,188 | 32,168 | 21,790 |
| 1999 | 0.0 | 21.1 | 23.1 | 26,187 | 38,945 | 26,831 |
| 2000 | -7.7 | -9.1 | -2.7 | 24,163 | 35,418 | 26,116 |
| 2001 | 21.4 | -12.0 | 3.1 | 29,325 | 31,160 | 26,926 |
| 2002 | 10.8 | -22.1 | -20.0 | 32,506 | 24,259 | 21,535 |
| 2003 | 73.1 | 28.5 | 45.6 | 56,268 | 31,174 | 31,360 |
| 2004 | 43.7 | 10.8 | 19.9 | 80,843 | 34,530 | 37,587 |
| 2005 | 17.9 | 4.8 | 7.4 | 95,353 | 36,180 | 40,376 |
| 2006 | 29.4 | 15.6 | 15.6 | 123,363 | 41,832 | 46,687 |
| 2007 | -1.8 | 5.4 | 1.2 | 121,166 | 44,083 | 47,227 |
| 2008 | -50.8 | -37.0 | -36.0 | 59,582 | 27,764 | 30,217 |
| 2009 | 72.3 | 26.5 | 36.1 | 102,665 | 35,120 | 41,130 |
| 2010 | 45.4 | 14.9 | 27.7 | 149,238 | 40,358 | 52,529 |
| 2011 | 6.3 | 2.0 | -2.8 | 158,701 | 41,155 | 51,067 |
| 2012 | 33.3 | 15.8 | 18.0 | 211,588 | 47,666 | 60,274 |
| 2013 | 61.0 | 32.2 | 37.6 | 340,599 | 63,009 | 82,966 |
| 2014 | -5.8 | 13.5 | 7.4 | 320,844 | 71,516 | 89,105 |
| 2015 | -15.2 | 1.3 | -3.8 | 272,161 | 72,410 | 85,693 |
| YTD | 1.7 | 3.5 | 4.7 | 276,846 | 74,941 | 89,711 |
| Since Incep | 15.2 | 8.9 | 9.8 | $276,846 | $74,941 | $89,711 |
|
Data as of 5/31/2016. |
||||||
Model Shadow Stock Portfolio Rules
Purchase and Sales Rules
Stock purchases must meet these criteria:
- No bulletin board or pink sheet stocks will be purchased.
- Price-to-book-value ratio must be less than or equal to 1.00. (Figure will change gradually with changes in overall market values.)
- Market capitalization must be between $30 million and $300 million. (Figure will change gradually with changes in overall market values.)
- The firm’s last quarter and last 12 months’ earnings from continuing operations must be positive and, if there are earnings estimates, the estimates must be positive for the current quarter and year.
- No financial stocks or limited partnerships will be purchased.
- No stocks on foreign exchanges or ADRs will be purchased due to different accounting and/or withholding tax on dividends. Foreign stocks traded primarily on U.S. exchanges are OK with one exception: The stock of any company whose primary business is in China will not be purchased.
- The share price must be greater than $4.
- In order to reduce trading by avoiding stocks that are forever marginal, any stock that was sold within two years will not be rebought.
- Note second item under Stock Order Guidance concerning spreads when buying shares.
- Price-to-sales ratio must be less than 1.2. (Figure may change gradually with changes in overall market values.)
- Eliminate any company that failed to file a 10-Q (quarterly) report in the last six months.
Stocks are sold if any of the following occur:
- If last 12 months’ earnings from continuing operations are negative, the stock is put on probation; if a subsequent quarter has negative earnings prior to 12-month earnings from continuing operations becoming positive, the stock is sold.
- The stock’s price-to-book-value ratio goes above three times the initial criterion and there is a stock to replace it.
- Market capitalization goes above three times the initial maximum criterion and there is a stock to replace it.
Stock Order Guidance
- These rules are for general guidance. Your own experience, market conditions and the size of the position will impact your own decisions. The results in the model portfolio were obtained while sometimes paying more.
- Market orders are not used. Instead, if the quoted bid-ask spread is less than 2% (ask price minus bid price, divided by ask price), place a limit order at the ask price for a buy and at the bid price for a sell. If the bid-ask spread is more than 2%, try to place a limit order between the bid and ask prices to keep transaction costs low. If necessary, build a position gradually. With low commissions, it is often better to place partial orders than to try to establish a large position all at once. Be patient.
- The average daily dollar volume should be at least 10 times the amount needed for your position. This will ensure liquidity to get in and out of the position, even if you need to grow the position gradually and sell gradually. This will result in a varying number of qualifying stocks for each investor.
- If price changes cause a stock to become ineligible (due to changes in price-to-book-value ratio or market capitalization) when only part of the order has been filled, shares already purchased are kept but the balance of the order is canceled.
Management Rules
- Equal dollar amounts are invested in each stock initially.
- Decisions are made only at the end of each quarter. In order to react to the majority of earnings reports as soon as possible, quarterly reviews are made in February, May, August, and November.
- Best judgment is used for tenders or mergers, but all criteria must be obeyed.
- At the end of a quarter, if receipts from stocks sold exceed requirements for new purchases, the excess receipts—up to 5% of the portfolio’s value—are kept in cash until the next quarter. If the excess receipts are greater than 5% of the total portfolio value, the amount above 5% is distributed to smaller holdings that still qualify as buys. Efficient quantities are purchased: If over 10% of the portfolio is in cash, the price-to-book-value ratio can be moved up, but never over 1.00.
- At the end of a quarter, if receipts from stock sales are insufficient to buy all newly qualifying stocks, purchases are made based on the width of the bid-ask spread and the number of shares at bid or ask price.
- Note that if you are managing your own portfolio, it should consist of at least 10 stocks. If you are developing the portfolio gradually, you can do it stock by stock, but don’t put more than 10% of your funds in each additional stock. More than 20 stocks is not needed until the portfolio exceeds $1 million.
Discussion
FREE REPORT

Madhu Kapadia from NJ posted over 10 years ago:
Dan Pouliot from VT posted over 10 years ago:
Michael Shideler from OR posted over 10 years ago:
You need to log in as a registered AAII user before commenting.
Log InCreate an account