


If you have been buying individual municipal bonds, and if you have access to the Internet, you are probably familiar with the Web site InvestinginBonds.com (www.investinginbonds.com). This is the official Web site of the Bond Market Association, which for the past few years has been reporting municipal bond trades.
Initially, trades were reported only for bonds that traded four or more times in one day. Reporting was gradually broadened to include all bond trades. Those trades, however, were all reported for the previous day.
As of January 31, 2005, a momentous change took place. Trades are now reported, and prices available, 15 minutes after a trade: in other words, in real time.
The focus of this article will be how you, Mr. or Mrs. Individual Investor, can use this information.
First, let’s review some basics: namely, how to read the price of any bond. A complete listing would include all of the following information:
Please note that a complete listing for any bond includes two prices. One is the “bid” and it is the amount the dealer paid when he bought the bond. The other is the “ask” (also called the offer), and that is the price the dealer is now asking for that bond. The difference between these two prices is called the “spread” and that spread represents the commission the dealer wants to earn.
For municipal bonds, since the beginning of time, only one price has been shown when trades are reported, and that is the price at which the dealer wants to sell the bond. The spread, that is, the dealer commission, remains hidden. That is why commissions on municipal bonds are said to be opaque.
SEC rules state that commissions should be “reasonable.” But dealers have a good deal of latitude on how to interpret “reasonable.” A number of factors affect the spread (and, therefore, the total price) for any municipal bond. They include:
- The bond’s maturity: Typically, bonds with a shorter maturity trade with a much narrower spread.
- The bond’s credit quality: Lower-rated bonds sell at a higher spread than higher-quality bonds.
- The direction of interest rates: If rates are rising, that is a weak market—spreads also rise. In a strong market, with high demand, spreads narrow.
- The number of bonds being traded: The smaller the number of bonds, the higher the markup. One hundred bonds constitutes a round lot. For an individual investor, expect commissions to be higher for any lot smaller than 25 bonds (par value, $25,000 dollars).
- How often a bond trades: Bonds that trade more often trade at lower spreads.
- The dealer’s cost, plus how much he wants to earn for the bond.
- The parties to the trade: Is this a customer sell, a customer buy, or a trade between two dealers?
- The bond’s credit quality: Lower-rated bonds sell at a higher spread than higher-quality bonds.
Traditionally, dealers’ commissions on municipal bonds have been considered reasonable if they varied between a range of about ½ of 1% (say for AAA rated bonds, with very short maturities, in a strong market) to perhaps 4% for bonds with some speculative characteristics (current examples would include tobacco bonds) that have long maturities. Average commissions for AAA-rated bonds with maturities in the intermediate to long range (say between 10 and 30 years) have been in the 2% to 3% range.
But abuses have not been uncommon, with some unscrupulous dealers charging commissions as high as 10% or higher. Every year, a number of large brokerage firms have been fined for this type of abuse.
Note also that with interest rates at current levels, even a 2% commission can represent up to six months or a year’s worth of interest income!
The hidden spread has always been the bane of municipal bond investors. Listing bond trades in real time represents an effort, on the part of the industry, to enable investors to better evaluate the price at which bonds are offered to the individual investors. The hope is that, eventually, this will result in narrower, and more uniform, spreads and pricing.
As in the past, this Web site continues to list all trades that occurred the preceding day.
|
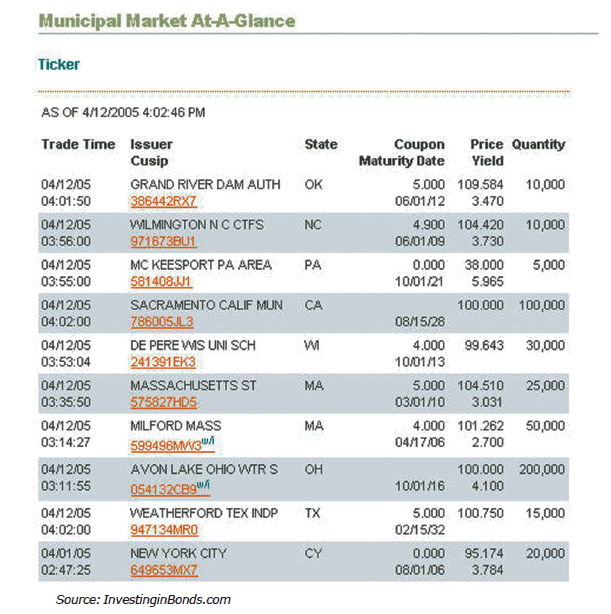
The big news is that you can now see municipal bond trades that occur on the day you are consulting the Web site. For municipal bond investors, there are two possibilities for viewing the trades. First, you may simply want to look at streaming data—that is, trades are listed 15 minutes after they occur and you can, if you want, just look at these trades as they occur (see Figure 1).
|
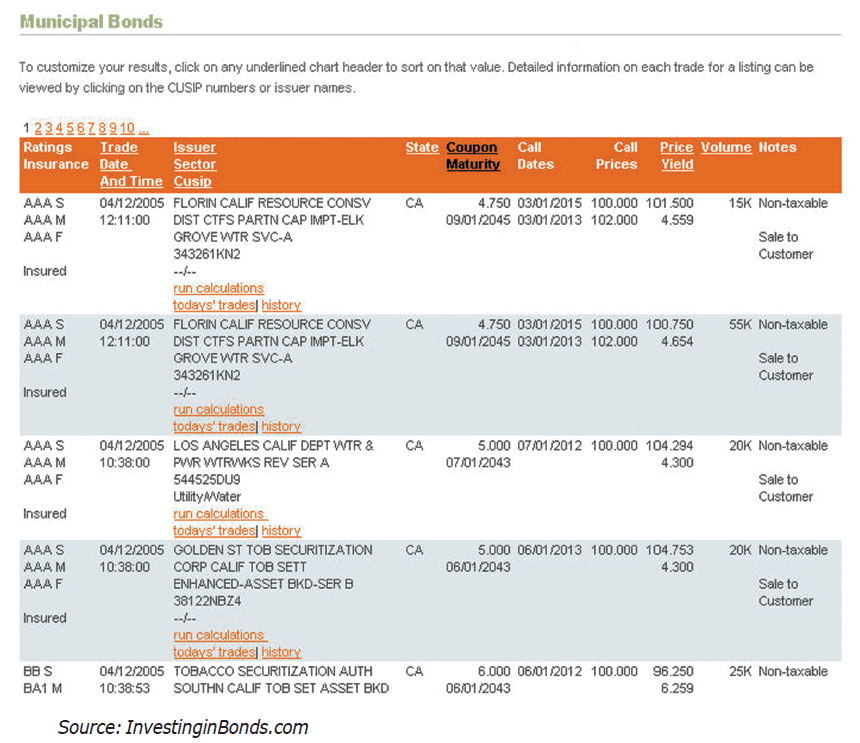
More likely, however, is that you will consult the Web site if you are considering either the purchase or sale of a bond. The Web site allows you to view trades based on a number of different sorting options (see Figure 2). In most cases, you would probably want to buy municipals from the state in which you reside, because they are exempt from both federal and state taxes, so you would select a sort based on that state. If you sort on that basis, what comes up would be all the bonds that have traded on that particular day for the state you have chosen.
An example of a listing is presented in the accompanying sidebar.
| Real-Time Trade Data: What It Can Reveal | ||||
|
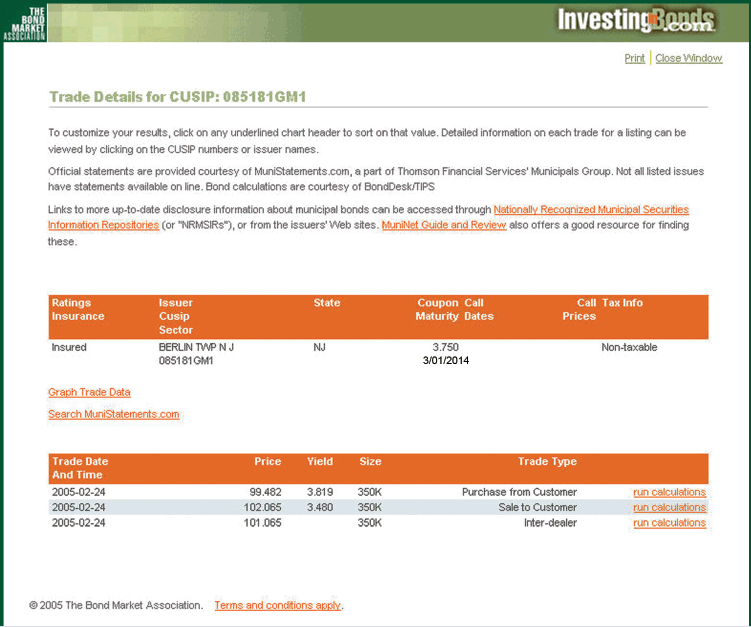
As an example of how you can use the new real-time information, Figure 3 shows trade data for one New Jersey municipal bond listed in March of 2005.
The basic information is easily interpreted. Three separate trades occurred for this bond, issued by Berlin Township, maturing in about 10 years, rated AAA by virtue of bond insurance. The data also includes information about the parties to the trade: whether this was an inter-dealer trade, that is, a trade between two dealers, a purchase from a customer, or a sale to a customer. The first thing to notice is that only one price is listed for each trade—and in many listings, if the bond only traded once, you will see only one price listed. That means that the amount of the dealer commission remains hidden. However, in this example you can pretty much calculate the spread because in each instance, the exact same number of bonds (350) changed hands—each trade was at a par value of $350,000. Most likely we are dealing with a succession of trades involving the same bonds. It would seem to go like this:
This example is somewhat atypical in that it involves a fairly large lot. But it shows three trades for the exact same number of bonds, at three different prices, with two dealer commissions. Moreover, while discussions of spreads may at times appear to be much ado about very little, because spreads represent commissions on trades valued at thousands of dollars, even small percentages add up to real money. In this example, the spread between the lowest price and the highest price is 2.583 (approximately 2.6%), which is actually fairly narrow, due to the fact that this is a dealer-size trade. But on a $350,000 par value bond trade, that spread adds up to $9,040.50! |
Let’s say you are shopping for municipal bonds. If you see a trade that just occurred, at what seems an attractive price, do you call up your broker and say: “I want 100 of these”?
Well, unless you are dealing with a new issue, or a very large block of bonds put up for sale (and these, of course, do occur from time to time), you are unlikely to find the exact same bonds for sale.
These real-time prices, however, provide you with very specific comparables that enable you to evaluate where the market is for municipal bonds at different points on the yield curve.
How can you use this information?
First, you need to be aware that using real-time prices as comparables requires a good deal of familiarity with the way the bond market works. Some caveats are in order.
- The spread remains hidden (unless, you can infer it, as in the example in the sidebar).
- Remember also that on any one day, only a tiny fraction of all municipal bonds, changes hands. One estimate is that only ½ of 1% of all municipal bonds trades on any one day.
- As our sidebar example shows, it is quite likely that if a bond trades a number of times, those trades take place at different prices. All of the factors which affect the spread (and which were listed in the opening part of this article) continue to affect prices of any bond during the trading day.
- More importantly, because the spread remains hidden, it is difficult to evaluate whether the reported trades occurred at fair or unfair prices.
- Remember also that on any one day, only a tiny fraction of all municipal bonds, changes hands. One estimate is that only ½ of 1% of all municipal bonds trades on any one day.
- Maturities need to be virtually identical (even a few months’ difference will result in different prices).
- Call provisions should be identical.
- Credit ratings should be the same. (Bear in mind that bonds that are rated AAA because of insurance do not trade like bonds rated AAA on the strength of the underlying credit—so-called AAA naturals).
- The number of bonds being traded needs to be similar.
- You need to be making the same kind of transaction (i.e., either buying or selling).
- Call provisions should be identical.
In spite of its limitations, the real-time reporting of municipal bond trades provides far better and far more precise information than has been available to municipal bond buyers up until now.
Paradoxically, because all trades are now listed, the very amount of information is very confusing. Here are some additional suggestions for using the listings:
- Focus on trades involving a large number of bonds. Trades involving 25 bonds or fewer are more likely to have occurred at higher spreads.
- Look for bonds that traded several times. You get a better sense of spreads, and of the direction of the market, by looking at multiple listings for the same bond.
- Try to get a sense of whether the market is weak or strong. If you are a buyer, you can probably get better pricing if the market is weak. You can get a sense of this by looking at the direction of Treasury rates. Most financial Web sites now contain a listing of Treasury rates: Are they rising or falling? While factors unique to a sector of the market affect prices in that sector of the market, generally, municipal bonds follow Treasuries. But another factor that affects the strength or weakness of the municipal bond market is supply: that is, the number of bonds issued during any week. A large supply depresses prices and increases yield. That is a better day to buy than to sell. The opposite is also true. Note that on a day when the market makes a large move, with the price of the benchmark Treasury moving up or down by a full point, a similar change in pricing is likely to occur in the municipal bond market.
- Look for bonds that traded several times. You get a better sense of spreads, and of the direction of the market, by looking at multiple listings for the same bond.
|
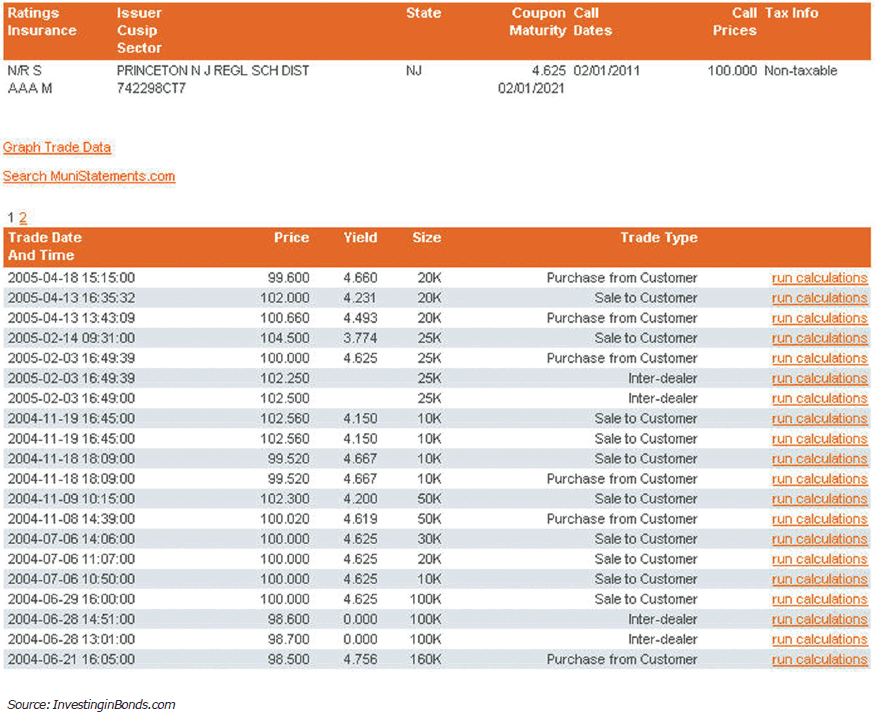
Finally, note that InvestinginBonds.com provides one more level of information that is particularly useful if you want to sell a bond. If you click on the CUSIP number of a bond, you can see the trade history of the bond—the prices at which the bond changed hands for periods of up to several years. For example, Figure 4 shows the trades that occurred for a bond issued by the Princeton NJ Regional School District (CUSIP 742298CT7). This is an actively traded high-quality bond, rated AAA, which means that spreads should be in the narrow range. The trade history shows that this bond traded 20 times between June of 2004 and the current date (April 20, 2005). Prices at which customers sold (listed as Purchase from Customer) ranged from 98.5 ($985 per bond) to 100.66 ($1,006.60 per bond). Prices at which customers bought (listed as Sale to Customer) ranged from 99.52 ($995.20 per bond) to 104.5 ($1,045 per bond). Inter-dealer spreads, by comparison, are in the 25 basis points (0.25%) range. Some of the variability in all prices is no doubt due to market conditions prevailing on the date of the transaction. But the spreads between buying and selling prices for individual investors provide evidence of how expensive it is to sell bonds, particularly for lots of 25 bonds or fewer. Spreads for selling odd or small lots are typically in the 4% to 5% range, which means that at current interest rate levels, the seller is giving up as much as one year’s interest income. For inactively traded bonds with more speculative characteristics, spreads may be even higher.
| Keeping an Eye on Spreads: Other Pricing Data |
| One other Web site to check out when pricing municipals bonds is MunicipalBonds.com (www.municipalbonds.com), an alternate source of extensive pricing data. According to its developer, its mission is to bring transparency to the municipal bond market. It publishes voluminous lists of trades and prices occurring the previous day, with some spreads included. In addition, it publishes annual lists of the 100 worst trades for the preceding year, both nationally and for individual states. In the past, some of these made you gasp: hapless sellers selling a bond for 25 cents on the dollar, to a dealer who then charges 90 cents for the same bond. Time will tell whether real-time reporting will result in fairer and more uniform commissions. |
A logical question at this point is: Has the market changed as a result of the listings?
This is difficult to say. I have spoken to a couple of brokers, and they mentioned that savvy investors are using these listings to try to obtain more favorable pricing. But most investors remain unaware of these listings. And to date, while fewer outright abusive commissions are being reported, spreads have not narrowed noticeably.
Some brokers, however, realize change is coming, and are trying to attract investors by providing new services. One early entrant is the brokerage division of Fidelity Investments. Fidelity has revamped its Web site (www.fidelity.com) for offering municipal (and other) bonds. Fidelity’s Web site lists bond offerings using the Bond Desk database, which is a database used by other large brokers. Bear in mind that Bond Desk lists bond offerings from a large number of dealers. The prices listed by Bond Desk are set by the dealers who own the bonds. Spreads remain undisclosed.
The purpose of Fidelity’s revamp is to address some of the difficulties mentioned earlier in the article and help average individual investors select bonds that are fairly priced. Fidelity’s Web site does not list all of the bonds available on the Bond Desk Database. Instead, Fidelity applies several screens. First, Fidelity screens out bonds if spreads exceed 3%. Fidelity also applies what they call a “risk” test: That test is based on the premise that if the yield of a bond exceeds that of comparable bonds, there may be a risk that is not obvious (in the world of bonds, higher yield usually is accompanied by higher risk). Based on these tests, Fidelity assigns various ratings to the bonds it offers for sale. Fidelity has also developed a number of other tools—for example, a scatter graph showing whether bonds are close to an aggregate yield curve for the market on that day.
At this point, I am unable to evaluate how useful you would find the tools offered by Fidelity. While writing this article, on February 29, I compared muni offerings on both the Vanguard and Fidelity Web sites. Both use Bond Desk, and I typed in the same criteria for selecting bonds. Vanguard’s Web site listed 126 bonds; Fidelity, because of its exclusion criteria, listed only 39.
It was not obvious to me that all of the bonds excluded by Fidelity represented less attractive offerings. The “risk” test seems to me to be the most questionable. Because it is based primarily on higher yield than for other comparable bonds, it may indeed identify bonds whose risk factors are not immediately obvious. But it would also exclude bonds selling cheaply for any number of other reasons—and that is precisely the kind of bonds I look for, namely, bonds that are bargain-priced. But to be fair, many of the bonds offered on the Fidelity Web site did also seem to offer good value.
Another intriguing development, still only in the talking phase, is the creation of a platform that would enable individual investors to buy and sell directly through the platform, eliminating the dealer. As we see illustrated in the sidebar example, if more than one trading desk (or dealer) is involved in trading a particular bond, each one adds a commission. This is entirely legitimate and to be expected, but a platform eliminating intermediaries would theoretically result in more favorable pricing, particularly for small trades.
Clearly, however, we are at the beginning of a process. At the moment, real-time pricing information is available only on the Internet, and change seems to be proceeding at a glacial pace. But there is movement and, for alert buyers, a better shot at getting fairer pricing either in buying or in selling bonds.
Ms. Thau is a former municipal bond analyst for Chase Manhattan Bank. She also until recently was a visiting scholar at the Columbia University Graduate School of Business.
Annette Thau, Ph.D., is author of “The Bond Book: Everything Investors Need to Know About Treasuries, Municipals, GNMAs, Corporates, Zeros, Bond Funds, Money Market Funds, and More,” (copyright 2001, published by McGraw-Hill; $29.95). She has spoken to AAII chapters in different parts of the country about bonds and bond funds.
Discussion
FREE REPORT

No comments have been added yet. Add your thoughts to the discussion!
You need to log in as a registered AAII user before commenting.
Log InCreate an account