The market stumbled a bit over the past quarter but still manages to keep up a pace that could let it attain the 22% average pre-election-year return—of course, we still have six months to go.
I feel better about the market now that there are more bearish voices.
Interest rates, Federal Reserve action, the housing slowdown, and the sub-prime lending problems weigh on the market, but there are always areas of concern in the stock market. Terrorism, of course, could have an impact, and the recent actions in Britain certainly raise concerns.
The Model ETF Portfolio, composed of exchange-traded funds, has been separated from the Model Mutual Fund Portfolio coverage. You can find a review of the Model ETF Portfolio in a separate article on page 11 of this issue. Going forward, the ETF portfolio will be reviewed in the May and November issues of the AAII Journal.
The coverage of the Model Mutual Fund Portfolio will continue to appear in the February and August issues.
Portfolio Performance
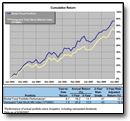
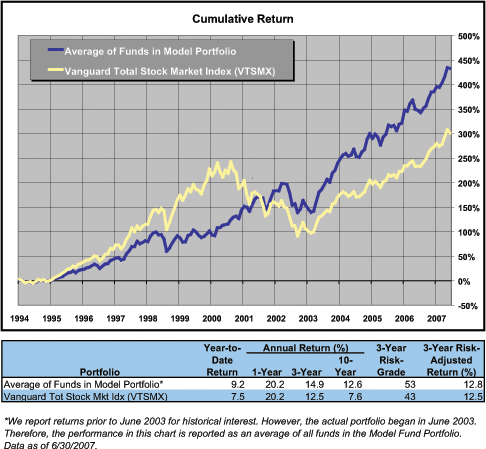
The Model Mutual Fund Portfolio is doing well year-to-date. It is up 9.7% compared to 7.5% for the total stock market, as measured by the Vanguard Total Stock Market Index fund (VTSMX).
Figure 1.
Model Fund Portfolio
Performance vs. Benchmark
|
|
CLICK ON IMAGE TO
SEE FULL SIZE.
|
|
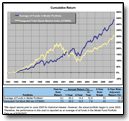
The results for year-to-date and longer terms can be seen in Figures 1 and 2 and Table 1. Within the portfolio, the CGM Focus fund (CGMFX) continues to do exceptionally well—it is up 23.3% year-to-date. However, the day-to-day volatility would inhibit sleep if it were the only fund in your portfolio—which I hope it is not.
Portfolio Changes
The T. Rowe Price Capital Appreciation fund (PRWCX) has been sold from the Model Fund Portfolio. The fund’s assets are well over $10 billion, and we do not believe at that size it can significantly outperform an index fund over the long term.
Figure 2.
Historical Performance
of Funds in the
Model Portfolio
|
|
CLICK ON IMAGE TO
SEE FULL SIZE.
|
|
It will be replaced in the Model Fund Portfolio by Manning & Napier Pro-Blend Extended Term A (MNBAX), which had been listed as a substitute fund for the funds that are closed to new investors.
Tamarack Microcap Value (TMVSX) has re-opened its “S” (no-load) shares to new investors. Tamarack Microcap Value is already in the Model Portfolio, but investors who started with the portfolio after the “S” shares were closed can now buy them. To keep as close to the model portfolio as possible you can take the following actions:
- If you already have Tamarack Microcap Value, you should replace T. Rowe Price Capital Appreciation fund with the Manning & Napier fund.
- If you did not have Tamarack Microcap Value, you would have already purchased the Manning & Napier fund as a substitute. In this case, you should replace T. Rowe Price Capital Appreciation fund with the Tamarack Fund.
FMI Common Stock fund (FMIMX) remains closed and Mairs & Power Growth fund (MPGFX) remains the substitute for it.
These changes in the portfolio are not based on factors that require instant action, so if your funds are in a taxable account and nearing the one-year mark for long-term capital gains treatment, wait to make any changes.
We will cover the Mutual Fund Portfolio again in the February 2008 AAII Journal, but in the meantime you can follow it at www.aaii.com in the Model Fund Portfolio area.
| |

|
| Cap Size and Style
|
| We categorize mutual funds by both the size and style of their stock holdings. Size is measured by the average market capitalization (share price times the number of shares outstanding) of the stocks held by the fund, and style is based on the price-to-book value ratios (price per share divided by net assets per share) of the underlying stocks. Here is how we break down these categories: |
| Size Category |
Market Cap |
| Giant-Cap |
$15 billion and greater |
| Large-Cap |
$7 billion to $14.9 billion |
| Mid-Cap |
$2.5 billion to $6.9 billion |
| Small-Cap |
$700 million to $2.4 billion |
| Micro-Cap |
$300 million to $699 million |
| Nano-Cap |
$0 to $299 million |
| Style Category |
Price-to-Book-Value Ratio |
| Very High Value |
1.79 and below |
| High Value |
1.80 to 2.29 |
| Moderate Value (Blend) |
2.30 to 2.54 |
| Low Value (Growth) |
2.55 to 2.99 |
| Very Low Value (High Growth) |
3.00 and above |





No comments have been added yet. Add your thoughts to the discussion!
You need to log in as a registered AAII user before commenting.
Log InCreate an account