


Wayne Thorp leads a class in AAII's new Essential Investing Video Course. Go to https://www.aaii.com/ves for more information and to subscribe.
In this issue of the AAII Journal we offered up an overview of point & figure charting. This unique way of plotting price movement isn’t available at most investment websites. However, we have found a couple of online sources that provide useful point & figure charts. Both sites offer free access to point & figure charts, with paid subscriptions required to access more advanced features.
You may have options as to the scaling of box sizes at these sites. Traditional scaling is based on price levels: the scale adjusts as the price changes. Average True Range (ATR) is a measure of volatility and is based on the high-low range versus the prior close. So, with higher volatility—the greater the range of prices—the higher the ATR. In turn, a larger ATR value means bigger box values for the point & figure chart. Depending on the volatility of the security you are tracking, ATR scaling may lead to bigger or smaller box sizes compared to traditional scaling. Larger box values lead to fewer reversals, while small box sizes lead to more reversals.
StockCharts.com
www.stockcharts.com
Free to $39.95/mo.
StockCharts has been a CI favorite for stock charting for years and that still holds today. However, looking at sites such as TradingView (below), it’s obvious the site lags a bit in interactivity. However, it more than makes up for it with the overall offerings, including point & figure charts. In all, the site has nearly 20 different chart types. There is free access to charting, although you are more limited in the amount of data you can plot.

To load a point & figure chart, enter a ticker in the search box at the top-middle of the landing page and select P&F Chart from the pull-down menu. With point & figure charts, you can specify the prices used—close or high-low—as well as the scaling—traditional or ATR. You don’t have the level of control when it comes to plotting specific date ranges. The duration of the chart is driven by the size of the chart you choose. However, you can choose plotting periods of one minute to one month.
By default, trendlines are drawn onto the charts you create. The site also alerts you to recent point & figure patterns that may have formed. StockCharts also offers scanning tools that will look for stocks and funds/ETFs exhibiting specific chart patterns based on candlestick and point & figure charts. Lastly, the site’s ChartSchool is a great place to learn more about technical analysis and point & figure charting.
TradingView.com
www.tradingview.com
Free to $39.95/mo.
TradingView offers a treasure trove of tools and resources for more active investors and traders. With free registration you can access point & figure charting, but you will have to pay for the more advanced offerings at the site. As a free user, though, expect to see a steady stream of ads.
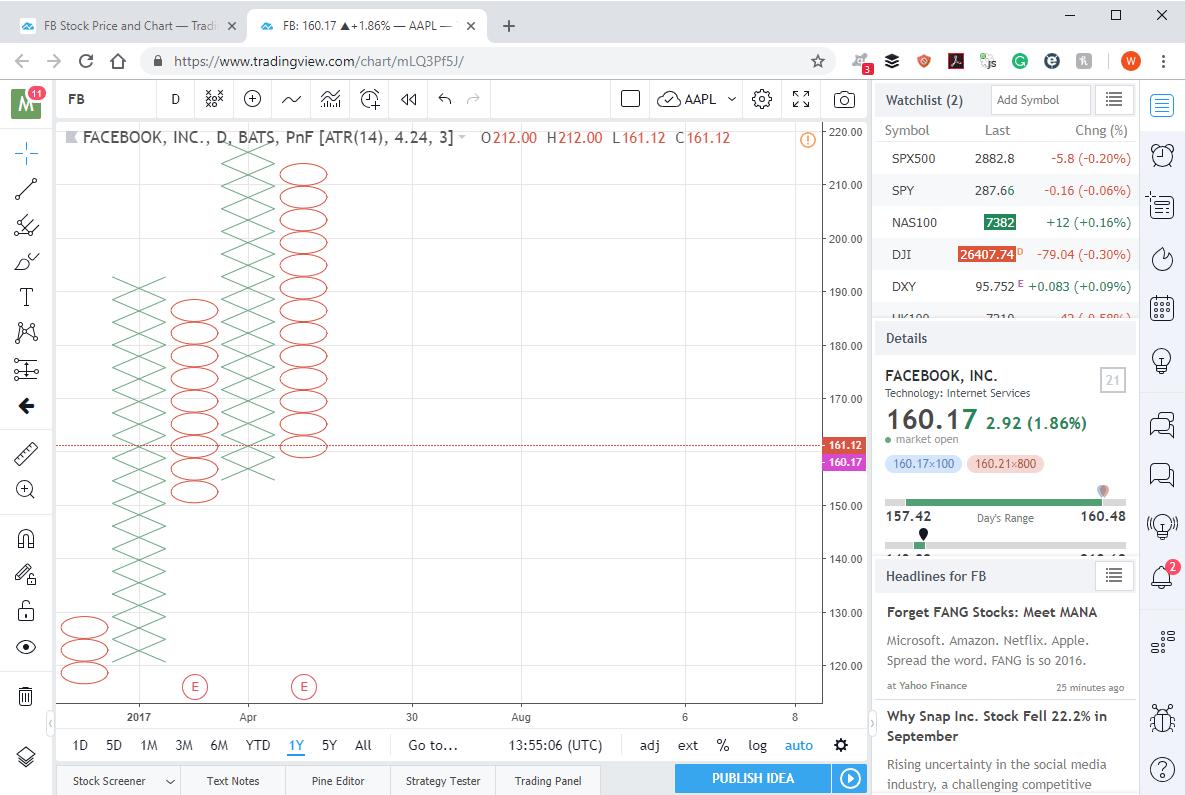
To access the point & figure charts on the site, type in a ticker at the top of the site home page. This will take you to an overview page where you click on the “Full-Featured Chart” button at the top-right of the Overview chart. You have 12 chart types to choose from, including point & figure. You can then select the periodicity—one minute to one month—and the time frame—one day to all available data (roughly 50 years).
For point & figure charting, TradingView defaults to using ATR scaling for its box sizes.
Their charts are much more interactive than those found at StockCharts.com. You can expand and compress charts using your mouse roller button and add trendlines and text comments to charts with simply a mouse click.
Discussion
FREE REPORT

Ted N from MN posted over 4 years ago:
Wayne T from IL posted over 4 years ago:
You need to log in as a registered AAII user before commenting.
Log InCreate an account