



Related

First Cut Stocks
The Piotroski financial scoring system has grown into a popular approach to identify companies that have solid and improving financials.
by John Bajkowski | June 2017

The Piotroski financial scoring system has grown into a popular approach to identify companies that have solid and improving financials.
Joseph Piotroski, an accounting professor, set out to see if it was possible to use simple financial criteria to separate the winners from the losers among the universe of deep-value stocks. In his study, reported in the 2000 research paper “Value Investing: The Use of Historical Financial Statement Information to Separate Winners from Losers,” Piotroski noted strong evidence supporting the use of value multiples such as the price-to-book-value (P/B) ratio to build portfolios that outperform the market, but not all deep-value stocks turn out to be winners. Most academic researchers construct large portfolios that end up beating the market by holding a few big winners that overcome also holding many underperforming stocks.
Piotroski’s financial scoring system (F-Score) used nine criteria that he divided into broad categories:
Piotroski then scored each criterion with either a zero or a one, depending on a company’s underlying financials. Together the nine criteria compose a composite F-Score that has a maximum score of 9; the higher the score, the better. In his study, Piotroski compared the performance of “winners” (a score of 8 or 9) and “losers” (a score of 0 or 1). He found that the winners outperformed the losers over the next year.
We first introduced AAII members to the Piotroski approach in the August 2001 AAII Journal in an article titled “Finding the Winners Among Low Price-to-Book-Value Stocks.” A screen based upon the approach is presented and tracked in the Stock Screens section of AAII.com and is built into our stock screening and research program Stock Investor Pro. The Piotroski screen has been one of AAII’s top-performing screens over our long-term comparison, but with a great deal of variability from year to year.
As was noted in the February 2017 AAII Journal, recent research indicates that the Piotroski F-Score works well with more than deep-value stocks. In a paper titled “The Value in Fundamental Accounting Information,” H.J. Turtle of Colorado State University and Kainan Wang of the University of Toledo analyzed the predictive value of the full F-Score to more than 125,426 firm-year return observations for the period of 1973 through June 2014. High F-Scores were defined as ranging from 7 to 9. Low F-Scores were defined as 0 to 2. Their results suggest that portfolio performance improves with fundamental accounting information of the F-Score in a wide variety of asset pricing contexts. The outperformance associated with high F-Scores and the underperformance associated with low F-Scores is particularly evident among stocks with the greatest information uncertainty.
We thought it would interesting to examine the performance of groups of portfolios formed with distinct F-Score bands ranging from low F-Scores to high F-Scores for both separately distinct universes of value stocks (low price to book value) and richly priced stocks (high price to book value).
Stocks with a low price to book value is the starting universe for Piotroski. The price-to-book-value ratio is determined by dividing market price per share by book value per share. Book value is generally determined by subtracting total liabilities from total assets and then dividing by the number of shares outstanding.
If accounting measures truly capture the value of a stock, then the stock should trade at a price near its accounting book value. However, this is typically not the case. Companies have some leeway when implementing accounting principles. While companies follow GAAP (generally accepted accounting principles), no two companies have the exact same accounting policies. The financial statements require many assumptions, judgments and estimates by management, which causes variations among firms even if management is not trying to distort or manipulate the numbers. Some firms are more conservative regarding how they report and track the values of revenues, costs, inventories, assets and even liabilities, while others are more aggressive. These decisions flow through the income statement and impact the book value of assets and liabilities. Some analysts like to take matters into their own hands and adjust the book value so that it completely ignores intangible assets like patents, copyrights, trademarks or goodwill.
We created two base universes from which to construct the F-Score portfolio buckets: a low price-to-book-value group and a high price-to-book-value group. We used AAII’s Stock Investor Pro stock screening program to perform our analysis. Stock Investor Pro covers the full universe of domestically traded stocks on the NYSE, NASDAQ, and Amex exchanges and over the counter. To help ensure minimum liquidity and financial reporting standards, over-the-counter stocks and ADRs (American depositary receipts; securities representing foreign stock that are traded on the U.S exchanges) were excluded from the analysis.
We then created the low price-to-book-value group by selecting stocks within the bottom 20% of stocks according to their price-to-book ratio. We created a separate high price-to-book-value group by selecting stocks within the top 20% of stocks according to their price-to-book ratio. We tracked the performance of these groups using six-month holding periods and then ran the screens again to construct new portfolios every six months. We used data from 1999 through 2016.
The low price-to-book group averaged around 860 stocks over the testing period and had a compound annual price appreciate of 10.4% over the 18 years of testing. The high price-to-book group had a compound annual price change of just 3.4% over the same period, but averaged around 1,023 stocks. The filter excluding over-the-counter stocks had a greater impact on the low price-to-book universe, creating a slightly smaller universe. Figure 1 shows the performance of the two groups over time along with the total return performance of the S&P 500 index as measured by the Vanguard 500 Index fund  (VFINX). The fund realized an annual total return of 5.3% over the same time period. The chart (as well as Figures 2 and 3) shows the growth of a $1,000 portfolio and highlights the strong initial performance of the growth stocks in the late 1990s followed by the resurgence of value after the market crash of 2000.
Piotroski developed a nine-point scale that helps to identify stocks with solid and improving financials. Profitability, financial leverage, liquidity and operating efficiency are examined using popular ratios and basic financial elements that are easy to use and interpret.
Piotroski awarded up to four points for profitability: one for positive return on assets, one for positive cash flow from operations, one for an improvement in return on assets over the last year and one if cash flow from operations exceeds net income. These are simple tests that are easy to measure. Because the requirements are minimal, there is no need to worry about industry, market or time-specific comparisons.
Return on assets examines the return generated by the assets of the firm. Return on assets is net income divided by total assets. A high return on assets implies the assets are productive and well-managed. If the firm’s return on assets is positive, the subsequent indicator for F-score purposes is equal to one. If the firm’s return on assets is negative, the indicator will equal zero.
The second variable in the profitability criteria is operating cash flow. If the firm’s operating cash flow is positive, one point is scored. If it is negative, zero points are scored. Operating cash flow is reported on the statement of cash flows and is designed to measure a company’s ability to generate cash from day-to-day operations as it provides goods and services to its customers. Operating cash flow adjusts net income for items such as depreciation, changes to accounts receivable and changes in inventory.
The third metric, change in return on assets, is the current year’s return on assets less the prior year’s return on assets. A company can increase return on assets by boosting its profit margin or by using its assets to increase sales (or both). If the change in return on assets yields a positive number, one point will be awarded. Otherwise, zero points will be awarded.
The final metric in the profitability section of the F-Score calculation addresses the relationship between earnings and cash flow levels—accrual. Piotroski seeks companies that have cash flow from operations that is greater than net income before extraordinary items. The measure tries to avoid firms making accounting adjustments to earnings in the short run that may weaken long-term profitability. Piotroski feels that this accrual relationship may be particularly important when evaluating value firms due to the possibility that management has a strong incentive to manage earnings to avoid triggering problems such as violations to debt covenants. If cash flow from operations is greater than net income before extraordinary items, the firm will receive one point for the accruals score, otherwise a zero is entered. In Stock Investor Pro, income after taxes represents income before extraordinary items, so the screen looks for firms with cash from operations greater than income after taxes for the most recent fiscal year.
Piotroski awarded up to three points for capital structure and the firm’s ability to meet future debt obligations: one if the ratio of debt to total assets declined in the past year (change in average), one if the current ratio improved over the past year (change in liquidity) and one if the company did not issue any additional common stock. Since many low price-to-book-value stocks are constrained financially, he assumed that an increase in financial leverage, a deterioration of liquidity or the use of external financing are signs of increased financial risk.
Piotroski measures change in leverage as the historical change in the ratio of total long-term debt to average total assets. For our purposes, we have also added in short-term debt to the numerator because many companies include the current portion of long-term debt in this figure. The higher the figure, the greater the financial risk. According to Piotroski’s research, by raising external capital, a financially distressed firm is signaling its inability to generate sufficient internal funds. In addition, an increase in long-term debt is likely to place additional constraints on a firm’s financial flexibility. If the firm’s leverage ratio didn’t change, or fell in the most recent fiscal year compared to the year prior, the firm will receive one point. Otherwise, it receives zero points.
The variable change in liquidity measures the historical change in the firm’s current ratio between the current and prior fiscal year. The current ratio is defined as the ratio of current assets to current liabilities at fiscal year-end. A high current ratio indicates a high level of liquidity and less risk of financial trouble. Too high of a ratio may point to unnecessary investment in current assets, failure to collect receivables or bloated inventory—all factors that negatively affect earnings. Piotroski assumes that an improvement in liquidity is a good signal about the firm’s ability to service debt obligations. The liquidity variable equals one if the firm’s current ratio improved, zero otherwise.
The final capital structure element awards one point if the firm did not issue common stock over the last year. Similar in concept to an increase in long-term debt, financially distressed companies that raise external capital could be indicating that they are unable to generate sufficient internal cash flow to meet their obligations. Additionally, if a company issues stock while its stock price is likely depressed (has a low price-to-book ratio), it highlights the company’s weak financial condition. We measure an equity offering by assessing if the company has maintained or reduced the average number of outstanding shares during their last fiscal year.
The remaining two elements examine the changes in the efficiency of operations. Companies gain one point for showing an increase in their gross margin and another point if their asset turnover has increased over the last fiscal year. The ratios reflect two key elements impacting return on assets.
Long-term investors buy shares of a company with the expectation that the company will produce a growing future stream of cash from selling goods and services. Gross profit margins reflect the firm’s basic pricing decisions and its material costs. Gross income or profit is measured as revenue less the company’s cost of goods sold. Gross margin represents the proportion of each dollar of sales that the company retains as gross profit. Piotroski feels that an improvement in margin signifies a potential improvement in factor costs, a reduction in inventory costs or a rise in the price of the firm’s product. The change in gross margin is defined as the firm’s current gross margin ratio (gross income divided by total sales) less the prior year’s gross margin ratio. If the company’s current gross margin is above that of last year, the firm will receive one point; otherwise, a zero is logged.
The final element in Piotroski’s financial scoring system adds a point if asset turnover for the latest fiscal year is greater than the prior year’s turnover. Asset turnover (total sales divided by average total assets) measures how well the company’s assets have generated sales. An increase in the asset turnover signifies greater productivity from the asset base and possibly greater sales levels.
A stock’s F-Score can range from 0 to 9. Overall, Piotroski found that the higher the F-Score, the higher the average portfolio return. Our current Piotroski screen looks at the low price-to-book universe and requires a high F-Score of 8 or 9.
We thought it would be interesting to take the low price-to-book and high price-to-book groups and divide each universe into five segments with F-Score groupings of 0 to 1, 2 to 3, 4 to 5, 6 to 7 and 8 to 9. We could see how many firms typically fall into a particular F-Score segment and whether higher F-Scores lead to higher returns for both deep value stocks as richly priced stocks.
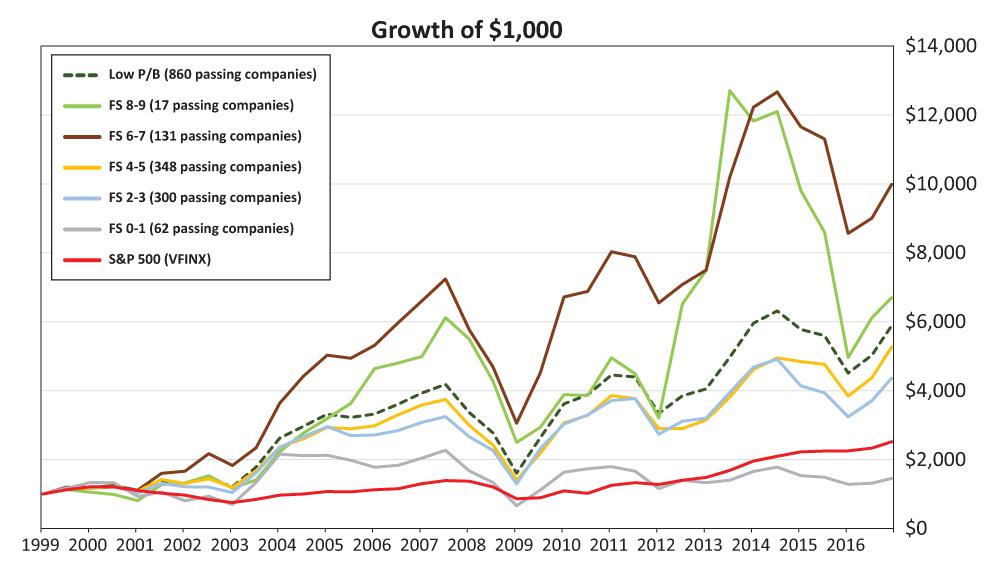
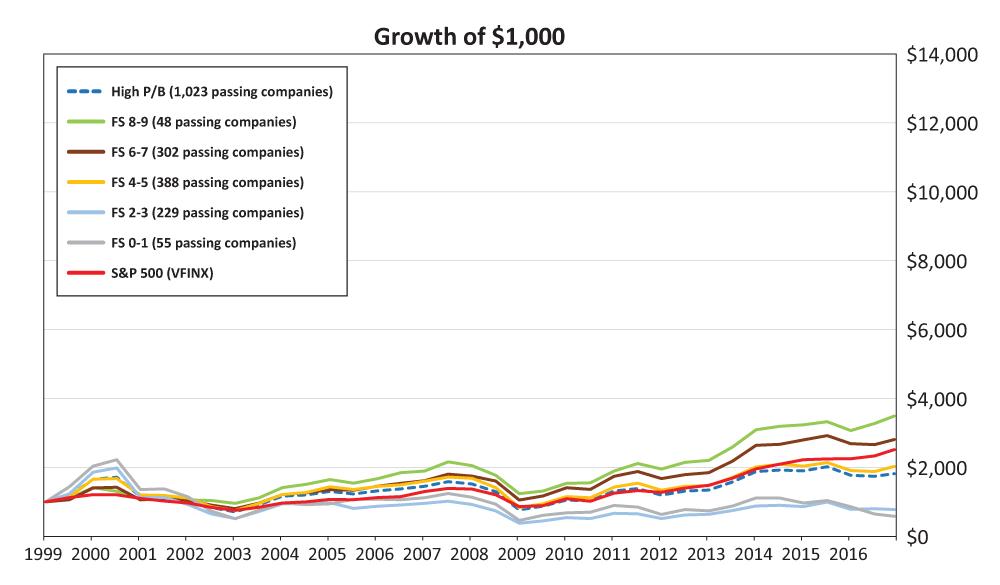
Figures 2 and 3 show the growth of hypothetical portfolios constructed within the high and low price-to-book universes. The legend for each table also lists the average number of stocks that passed each screen over the time of the analysis. The distribution of F-Scores is not symmetrical. A greater number of companies have F-Scores in the middle than at either extreme. We kept the vertical scale that shows the cumulative growth of each strategy consistent for each chart so you can more easily make comparisons across all three figures.
Within the high price-to-book universe (Figure 2), we witnessed a symmetrical relationship between the F-Score and subsequent performance—higher F-Scores resulted in greater performance. The high price-to-book universe had a compound annual price change of 3.4%, while the lowest F-Score group (scores of 0 and 1) lost 3.0% annually and the highest F-Score group (scores of 8 and 9) gained 7.2% annually over the same 18-year time frame.
Our testing of the F-Scores groups within the low price-to-book group indicated that while higher F-Scores generally resulted in higher future performance, the strongest performance came with the second highest F-Score group, which contained low price-to-book stocks with a F-Score of 6 or 7 (Figure 3). This segment resulted in annual price growth of 13.6%, while the segment with F-Scores of 8 and 9 had annual performance of 11.1%. Both of these high F-Score groups outperformed the general low price-to-book universe, which had an average annual price change of 10.4%. The lowest F-Score Group (scores of 0 and 1) had an average return of 2.1%, well below the S&P 500’s total annual total return of 5.3%.
The exchange-listed low price-to-book group is slightly smaller than the high price-to-book group. The smallest average portfolio over the period of our testing was the low price-to-book universe with the highest F-Scores of 8 or 9, which averaged just 17 passing stocks. In our past experiences with the low price-to-book, high F-Score combination, we found the approach often led to very high returns, but often with very small portfolios. When we first created the Piotroski screen, we only tracked portfolios with a F-Score of 9. However, this proved to be too restrictive, so we subsequently expanded the F-Score universe to include stocks with F-Scores of 8 or higher. Our results from latest examination indicates that we can likely even expand the F-Score low price-to-book universe to include stocks with F-Scores of 7 and possibly 6.
Piotroski’s segmentation of firms by financial strength continues to look helpful in identifying both potentially attractive stocks as well companies to avoid. Generally, the higher the F-Score, the greater the average portfolio return. The nine metrics that make up the Piotroski F-score include:
These are fairly basic measures that can be easily calculated and followed. They form a helpful fundamental framework to further analyze a company that looks to reward investors willing to take the time to do some basic homework.
The AAII maintains a blog for members on our website (blog.aaii.com); look for further thoughts on the Piotroski F-Score approach in the “From the President” section.
First Cut Stocks

Financial Statements


Paul Stadnik from OR posted over 9 years ago:
Lawrence Pennefather from AL posted over 9 years ago:
Lee Huberty from FL posted over 9 years ago:
Doug from NY posted over 9 years ago:
Manjunath Sharma from CA posted over 9 years ago:
Donna from CT posted over 9 years ago:
John Garrisi from CA posted over 9 years ago:
George Sturgis from MS posted over 9 years ago:
Paul Krusa from CO posted over 9 years ago:
Paul Krusa from CO posted over 9 years ago:
John Hastings from KS posted over 9 years ago:
Paul Senior from CA posted over 9 years ago:
Lee Wenzel from MN posted over 9 years ago:
You need to log in as a registered AAII user before commenting.
Log InCreate an account