


I am amazed at all of the articles and Web pages devoted to “asset allocation.”
While they all take the same general approach, they disagree strongly on the details. The general approach is to mandate that at a certain age, you should have a certain percentage of your wealth in each of stocks, bonds, cash, and sometimes other asset classes such as real estate. Sometimes they further divide each class into subclasses. For example, stocks might be divided into: large vs. small, domestic vs. foreign, or value vs. growth. They will then briefly mention that this reduces risk, but there will be no analysis of how it does this or proof that it works. The emphasis will be on the debate over whether a 50-year-old should have 50%, 60%, or 70% in equities.
Most of the articles treat the topic as if asset allocation were an end in itself, rather than one possible tool in the creation of a portfolio that provides the highest return for a given level of risk. This is akin to arguing about the best road to take before you decide where it is you want to go.
Those of you close to my age remember Adele Davis, the famous nutritionist. When she would lecture, invariably she would be asked something like, “Are tomatoes good for me?”
Her response would be, “Which tomatoes, grown where?”
My response to an author advocating a certain percentage in bonds vs. stocks is “Which bonds, which stocks?”
Take a portfolio that is 70% invested in an S&P 500 index fund and 30% in a bond index fund, and calculate its risk. Well, I can find a different 100% stock portfolio that is less risky than the 70%/30% indexed portfolio, and I can also find a 100% bond portfolio that is more risky.
Allocation may be helpful, but the key to risk control is the selection of the individual assets in the portfolio. I firmly believe that diversification within asset classes is more important than the allocation between classes. Choose individual investments first, allocate weightings later.
In addition to this general problem of mistaken emphasis, there are some special problems with the usual approach to asset allocation. These include:
| Table 1. Asset Allocation—Calculation of Benchmark | ||
| Asset Class |
Annual Return* (%) |
Risk Grade** (X) |
| Micro-Cap Stocks*** | 12.6 | 75 |
| T-Bills | 4.5 | 0 |
| S&P 500 Index | 10.2 | 90 |
| Desired Risk Level | na | 60 |
| If I want a risk exposure two-thirds that of the S&P 500 (2/3rds of 90 = 60), I need to find a portfolio that can beat a benchmark portfolio composed of micro-caps and Treasury bills with an equivalent risk: X%(75) + Y%(0) = 60; X = 60 ÷ 75 = 80% micro-caps and 20% Treasury bills. This benchmark portfolio would provide a return of 20%(4.5%) + 80%(12.6%) = 11.0%. Any allocation would have to beat 11.0% return with a 60 RiskGrade, or a return per unit of risk ratio of 11.0 ÷ 60 = 0.18, to be considered. The corresponding S&P 500 index/Treasury bill portfolio that would equate to a 60 RiskGrade level would be 67% S&P 500 and 33% Teasury bills, with a return of 8.3%.
*For period January 1, 1993 to June 30, 2002.**As of June 30, 2002.***Using DFA U.S. Micro Cap fund, ticker symbol DFSCX |
||
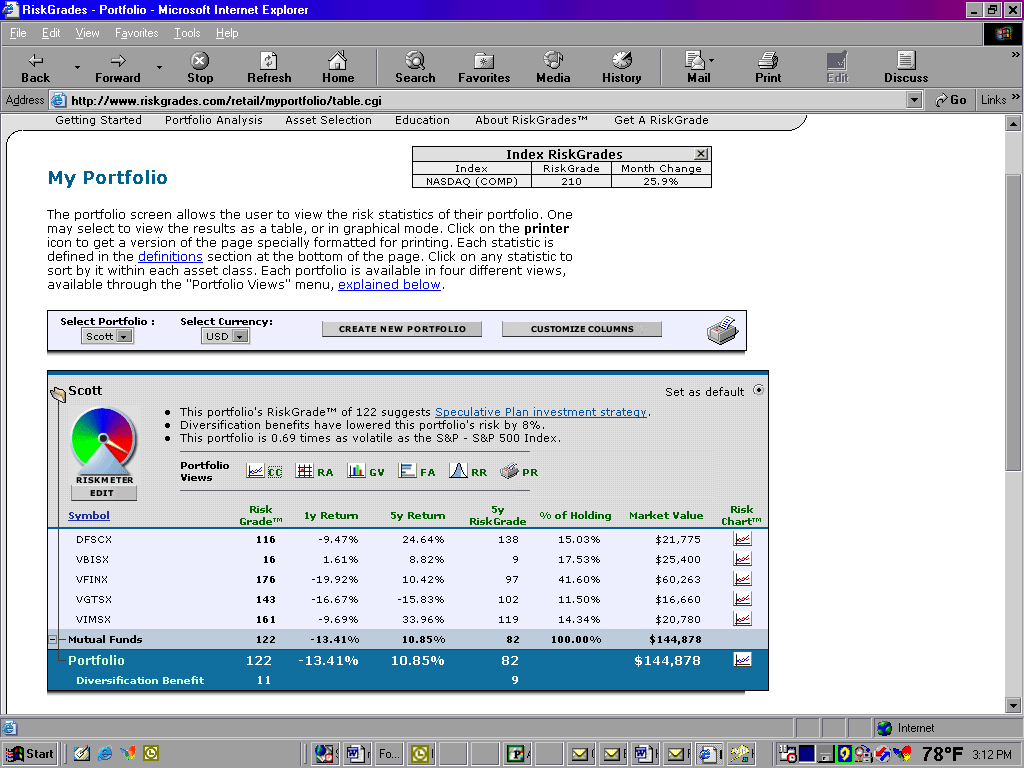
Let me discuss one process for measuring the effectiveness of any asset allocation approach. This analysis can be carried out using the RiskGrades Web site.
Take the highest return asset class, which is micro-cap stocks. You can use the DFA U.S. Micro Cap stock fund (ticker symbol: DFSCX) as a surrogate. Combine this fund with enough Treasury bills to reduce the risk to your appropriate risk level, where risk is measured by the RiskGrade (based on standard deviation, the amount by which most actual returns over a given period varied around the average return). You can combine the return of the micro-caps and the return of the T-bills in the chosen proportions to determine the overall return of this portfolio. You will then know the highest return per unit of risk that you can achieve at your desired risk level. This is your benchmark, and any potential asset allocation program you choose should be able to beat this benchmark to be acceptable (see Table 1). Note that the RiskGrade for this particular benchmark is based on performance as of June 30, 2002.
This is a method of measuring allocation across general asset classes, not of particular portfolios. You can certainly find individual portfolios with a higher ratio of return per unit of risk, but it will be difficult to find an asset class diversification program that is more effective over the long run.
I have really only tried to point out the problems with simple asset allocation approaches. The means of finding the highest returns for a given level of risk and adjusting allocation and diversification over time is more than enough material for a book.
I will take asset allocation analysis one step further, however, in Part Two of this series, with examples of how you can evaluate various asset allocation methods using the RiskGrade methodology and the wide assortment of index funds.
| Analyzing Your Portfolio Risk On-Line | |||
RiskGrades uses standard deviation as the basis for its risk measurement, but makes it more meaningful. It standardizes the somewhat meaningless levels of standard deviation by taking the average of all the world’s equities, and assigning it a standard deviation value of 100. All other standard deviations are expressed as a percentage of that figure. For example, if the RiskGrade of a portfolio is 77, it implies it has a risk 77% as high as the average risk of all equities in the world. The Web site provides the mathematical details of the approach, and it is free for individual investors. |
James B. Cloonan is chairman of AAII.
Discussion
FREE REPORT

No comments have been added yet. Add your thoughts to the discussion!
You need to log in as a registered AAII user before commenting.
Log InCreate an account