




The founder of online portfolio risk tool InvestSpy gives an overview of his free service.
At a Glance:
- Provides key portfolio risk parameters
- Offers correlation and factor analysis
- Intuitive and easy to use
InvestSpy.com is a free website that offers portfolio risk analytics to individual investors and financial advisers. We aim to bring the tools used by professional asset managers to the wider public by making them simple to use and free of charge. The ability to offer cost-free service is due to the fact that InvestSpy utilizes publicly available data on stocks and exchange-traded funds (ETFs) provided by Yahoo Finance.
The website consists of two main tools: Calculator and Analysis. In this article, I explain each tool separately.
Calculator
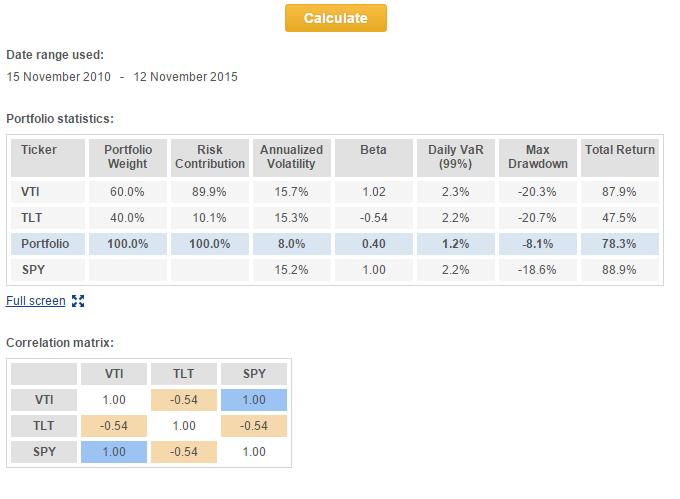
The Calculator page is the core component of the website. It allows you to obtain metrics such as risk contributions, volatility, beta, value at risk and maximum drawdown both for an individual security and for an entire portfolio. To build a portfolio, users are asked to specify individual positions by inputting security tickers one by one as currently there is no import function. Portfolios can be easily saved for the future, and there is no limit to the number of holdings in each portfolio. The results are compared with the SPDR S&P 500 ETF (SPY), an actively traded large-cap exchange-traded index fund. (SPY is, in fact, referenced in the second half of our website’s name.) For example, if you input a traditional 60% equities/40% fixed-income portfolio in the calculator with the Vanguard Total Stock Market ETF (VTI) representing stocks and the iShares 20+ Year Treasury Bond ETF (TLT) as a proxy for bonds, the results appear as shown in Figure 1.
The portfolio statistics section on this page has several different metrics for each holding in the user’s portfolio, including the following:
- Risk contribution
- Annualized volatility
- Beta
- Daily VaR (value at risk)
- Maximum drawdown
- Total return
All of these statistics are briefly explained in the FAQ section, while a number of articles on Seeking Alpha demonstrate how InvestSpy’s tools can be utilized in practice.
One interesting insight displayed in the portfolio statistics section in Figure 1 is that even though the annualized volatility of VTI and TLT is very similar, stocks account for 90% of the risk (as demonstrated by the risk contribution percentage) in the portfolio that is typically deemed well-diversified. It is also useful to inspect correlations between portfolio holdings or check the impact on portfolio risk that the addition of a new position would have. Users can run analysis for different data periods ranging from one to 15 years; it’s helpful to always test different data ranges to check if the outcomes are consistent.
Although past performance is no guarantee of future results, risk parameters tend to be much more stable than returns over time, making risk analysis an essential part of an investor’s homework.
The correlation matrix section of Figure 1 displays information regarding the strength of linear relationships among several different variables. The correlation coefficient, as it is academically named, is bound between -1.00 and 1.00. A correlation of 1.00 means that the variables are perfectly positively correlated—that is, they go up and down together in lockstep. In contrast, if the correlation coefficient is -1.00, the changes in the variables are perfectly negatively correlated, meaning they move in the exact opposite direction. A correlation of 0.00 would mean that no linear relationship exists between the variables.
As you can see in Figure 1, each variable runs vertically and horizontally in the same order in the correlation matrix. Each correlation is identified where each variable “meets” in the table. For example, the upper left-hand corner of the table shows a 1.00 correlation coefficient, meaning VTI and VTI have a correlation of 1.00. This will always be the case because each variable always has a perfect positive correlation with itself, which explains the fact that 1.00 figures go diagonally through the table.
Correlation is often used as a means to understand diversification within a portfolio. It’s important to remember, however, that correlation is not the same as causation. Just because two variables are correlated doesn’t mean that one causes the other to happen, or vice versa. We provide more in-depth information on correlation on the Analysis page, which is covered in the next section.
Analysis
The Analysis tool is the latest extension of our website. It consists of two parts: correlation analysis and factor analysis.
The correlation analysis section is a handy assistant in finding the most and least correlated ETFs with the security of your interest, whether it is a stock, an exchange-traded fund or a mutual fund. However, it is important to note that in this section we take into consideration only the largest ETFs that have at least $1 billion of assets under management and minimum five years of trading history. For instance, if you run a correlation analysis on iShares MSCI EAFE ETF (EFA), which tracks an index of large- and mid-cap international developed-market equities, you would get the results shown in Figure 2.
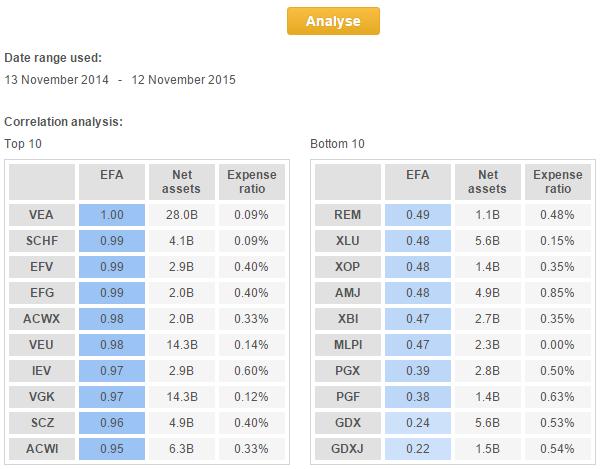
The Top 10 list reveals that there are multiple ETFs available that have a correlation with EFA of 0.99 to 1.00, indicating almost perfect co-movement. As some of these funds charge a substantially lower expense ratio than EFA’s 0.34%, investors can potentially use one of the alternatives to target developed countries at a lower cost. Furthermore, the Bottom 10 list displays ETFs with the lowest correlation coefficients to EFA. Given that the primary tenet of portfolio management theory is to combine uncorrelated investments, our correlation tool is an easy way to find efficient diversifiers.
Meanwhile, factor analysis aims to determine the driving forces behind a specific security. First, you need to specify a security from the Yahoo Finance database. Second, you have to select a group of factors from a list of four types: major asset classes, sectors, fixed income and single countries. The algorithm then runs an unrestricted multiple regression and presents a coefficients table. In simple terms, the regression uses the selected factors as explanatory variables to model the security of your interest. We tested this with the Market Vectors Gold Miners ETF (GDX), as shown in Figure 3, selecting asset classes of ETFs as the factors.
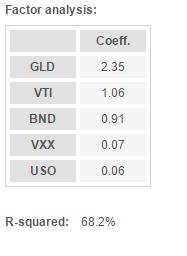
What the coefficients in the factor analysis table suggest is that to replicate the return of $1,000 invested in GDX as closely as possible, you would need to invest $2,350 in SPDR Gold Shares (GLD), $1,006 in Vanguard Total Stock Market (VTI), $910 in Vanguard Total Bond Market (BND), $70 in iPath S&P 500 VIX ST Futures ETN (VXX) and $60 in United States Oil fund (USO). These numbers have been computed simply by multiplying the coefficients by $1,000. At the bottom of the table is the R-squared, a statistic that measures how well the model fits the actual data. This statistic shows what percentage of return variation is explained by the selected model. In this particular case, the asset classes model explains almost 70% of GDX return. Such an exercise gives you a feel for what factors can influence the performance of a particular stock or fund. However, bear in mind that this is a very basic form of factor analysis; for more in-depth research a proper statistical software package would be required.
Summary
InvestSpy is a tool that helps investors to obtain risk characteristics about individual securities and their portfolios. Although the site does not forecast returns, it can help you get the risk management process under control. Understanding how portfolio holdings interact and blend together can help you prepare for different market scenarios and increase chances of staying in the game for the long run.
Price: Free
Discussion
FREE REPORT

No comments have been added yet. Add your thoughts to the discussion!
You need to log in as a registered AAII user before commenting.
Log InCreate an account