



The stock market continues to vacillate after its spectacular run in 2013.
But January’s pullback has been reversed over the last two months. Year-to-date through March 31, 2014, the Model Fund Portfolio is up 3.4% and the alternative All-ETF Portfolio is up 3.5%. These compare to a positive 1.8% for the S&P 500 index as measured by the Vanguard S&P Index fund (VFINX).
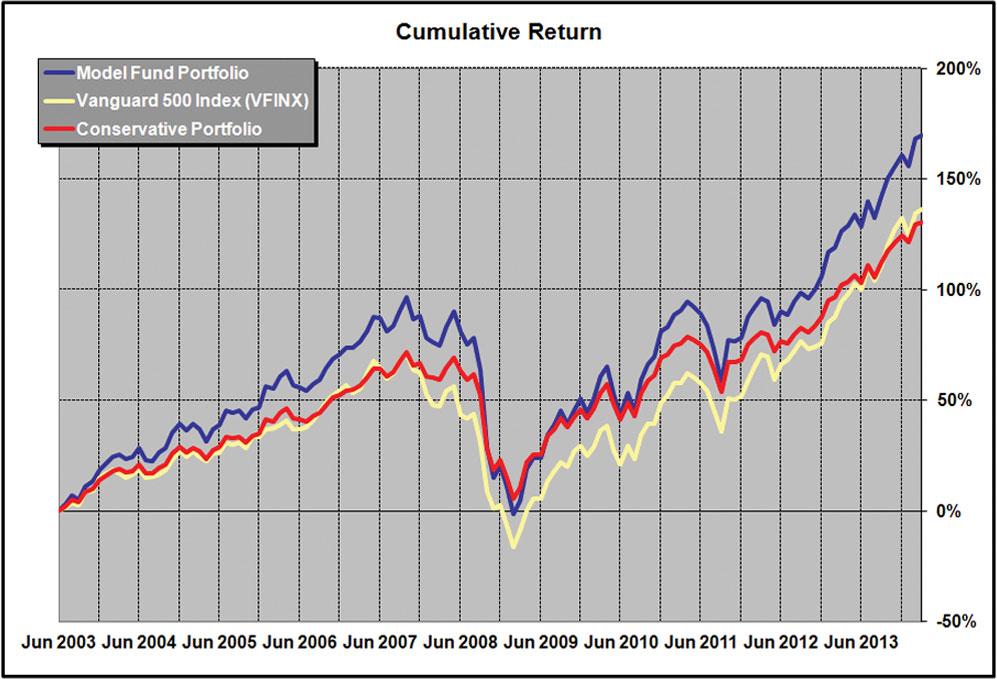
Results for the Model Fund Portfolio over longer terms can be viewed in Figure 1 and Tables 1 and 2. Performance for the All-ETF Portfolio is shown in Table 3.
Vanguard REIT Index ETF (VNQ) is up 10.0% year-to-date, as real estate continues its rebound from a weak 2013. IShares MSCI Frontier 100 ETF (FM) had a strong first-quarter 2014 performance, as frontier (pre-emerging) companies continue to outpace emerging market companies, which as a group had a slightly (–0.8%) negative return for the quarter. Small and mid-cap stocks have recovered from a weak January but are still underperforming year to date.
Portfolio Changes
There are no changes to the Model Fund Portfolio.
Aston/Fairpointe Mid Cap N fund  (CHTTX) and FMI Common Stock fund (FMIMX) continue to be closed to new investors. Current shareholders in these funds can continue to hold them; otherwise, you can build your portfolio from the other seven funds. While we are constantly searching, it is difficult to find funds that meet the requirements of the First Methodology in our Selection Rationale (see the box below for full explanation of selection methodologies and portfolio management notes).
Waiting for 10 years of experience to evaluate a fund eliminates a number of funds that may qualify in the future. The Model Fund Portfolio does not invest in sector funds.Every year some of them will produce the highest returns, but each year those high returns always come from different sectors. I just feel it is too difficult to predict which sectors will do best during any given period. The same is true of specific-country funds.
| Std | Worst | ||||||||||
| Dev | 3-Yr | ||||||||||
| Market | YTD | Annual Return (%) | Fund | Exp | (36 Mo. | Cal | |||||
| Cap | Return | 1- | 5- | 10- | Since | Assets | Ratio | Ann’l) | Period | ||
| Type | Fund (Ticker) | Size | (%) | Yr | Yr | Yr | 6/30/03 | ($ Mil) | (%) | (%) | (%) |
| MF |
Aston/Fairpointe Mid Cap N (CHTTX)* |
Large-Cap
|
4.9
|
31.9
|
29.2
|
11.2
|
13.0
|
2,561.1
|
1.12
|
18.5
|
-7.9
|
| MF |
Fidelity Capital & Income (FAGIX) |
na**
|
3.2
|
9.2
|
20.2
|
9.3
|
9.7
|
10,276.7
|
0.73
|
8.2
|
-7.2
|
| MF | Fidelity OTC (FOCPX) |
Large-Cap
|
3.1
|
41.0
|
25.9
|
10.9
|
nmf
|
8,250.0
|
0.76
|
16.6
|
-8.3
|
| MF |
FMI Common Stock (FMIMX)* |
Mid-Cap
|
1.8
|
22.0
|
22.8
|
11.2
|
12.1
|
1,413.9
|
1.19
|
12.8
|
-3.0
|
| ETF | Guggenheim S&P 500 Equal Weight (RSP) |
Large-Cap
|
2.9
|
24.1
|
25.9
|
9.2
|
10.8
|
7,085.8
|
0.40
|
14.1
|
-11.4
|
| ETF | Guggenheim S&P MidCap 400 Pure Val (RFV) |
Mid-Cap
|
1.5
|
21.6
|
31.4
|
nmf
|
nmf
|
95.0
|
0.38
|
16.5
|
-4.3
|
| ETF | Guggenheim S&P SmallCap 600 Pure Val (RZV) |
Small-Cap
|
1.4
|
33.5
|
36.0
|
nmf
|
nmf
|
182.7
|
0.35
|
19.5
|
-7.9
|
| ETF | iShares MSCI Frontier 100 (FM) |
Large-Cap
|
7.6
|
25.1
|
nmf
|
nmf
|
nmf
|
596.7
|
0.79
|
nmf
|
nmf
|
| ETF |
Vanguard REIT Index (VNQ)*** |
Large-Cap
|
10.0
|
4.2
|
28.7
|
8.1
|
nmf
|
21,005.0
|
0.10
|
16.5
|
-11.9
|
| Avg of Funds in Actual Model Fund Portfolio† |
|
4.0
|
23.6
|
27.5
|
10.0
|
11.4
|
5,718.5
|
0.65
|
13.4
|
-7.7
|
|
| Actual Fund Portfolio Performance†† |
|
3.4
|
19.1
|
20.9
|
8.0
|
9.7
|
—
|
—
|
12.8
|
-6.4
|
|
| Optional Investment |
|
|
|
|
|
|
|
|
|
|
|
| ETF | iShares Barclays 1-3 Year Treas Bond (SHY) |
|
0.1
|
0.2
|
1.0
|
2.4
|
3.2
|
7,860.0
|
0.15
|
0.5
|
1.3
|
| Conservative Portfolio††† |
|
2.6
|
14.2
|
15.9
|
6.8
|
8.1
|
—
|
—
|
9.6
|
-2.6
|
|
| Comparison |
|
|
|
|
|
|
|
|
|
|
|
| MF |
Vanguard 500 Index (VFINX) |
Giant-Cap
|
1.8
|
21.6
|
21.0
|
7.3
|
8.4
|
27,852.8
|
0.17
|
12.3
|
-8.4
|
| *CHTTX and FMIMX are closed to new investors. Current shareholders can continue to invest in both funds. Other investors should simply use the other seven funds to form their portfolio. | |||||||||||
| **Distressed securities - stock and bond. | |||||||||||
| ***Vanguard REIT Index Investors mutual fund (VGSIX) returns used prior to October 2004. | |||||||||||
| †A simple average of the funds in the current Model Fund Portfolio. | |||||||||||
| ††Performance of actual portfolio since inception (June 2003) including reinvested dividends. | |||||||||||
| †††75% Model Fund Portfolio/25% SHY. | |||||||||||
| nmf = no meaningful figure | |||||||||||
| Source: Morningstar, Inc. Data as of 3/31/2014. | |||||||||||
There are also no changes in the All-ETF Portfolio. In the case of this alternative portfolio, changes will occur if we feel a particular area of investment is better covered by a different exchange-traded fund or if we feel there is a change in the most important long-term investment strategic areas.
| Average Annual Return (%) | Cumulative Return of $10,000 ($) | |||||
|
Model
|
Conser-
|
Vanguard
|
Model
|
Conser-
|
Vanguard
|
|
|
Fund
|
Vative
|
500 Index
|
Fund
|
Vative
|
500 Index
|
|
|
Portfolio
|
Portfolio*
|
(VFINX) |
Portfolio
|
Portfolio*
|
(VFINX) |
|
| 2003** |
18.6
|
13.9
|
15.0
|
11,858
|
11,388
|
11,503
|
| 2004 |
17.7
|
13.3
|
10.8
|
13,955
|
12,905
|
12,742
|
| 2005 |
5.4
|
4.5
|
4.8
|
14,711
|
13,486
|
13,350
|
| 2006 |
16.1
|
13.0
|
15.6
|
17,086
|
15,243
|
15,436
|
| 2007 |
10.2
|
9.5
|
5.4
|
18,820
|
16,696
|
16,267
|
| 2008 |
-35.9
|
-26.4
|
-37.0
|
12,071
|
12,281
|
10,245
|
| 2009 |
24.9
|
19.0
|
26.5
|
15,080
|
14,609
|
12,959
|
| 2010 |
20.3
|
16.0
|
14.9
|
18,136
|
16,941
|
14,892
|
| 2011 |
-1.7
|
-0.7
|
2.0
|
17,827
|
16,825
|
15,186
|
| 2012 |
15.5
|
11.6
|
15.8
|
20,597
|
18,783
|
17,589
|
| 2013 |
26.7
|
19.6
|
32.2
|
26,097
|
22,470
|
23,250
|
| 2014 YTD*** |
3.4
|
2.6
|
1.8
|
26,987
|
23,053
|
23,659
|
| Since Incep*** |
9.7
|
8.1
|
8.3
|
26,097
|
22,470
|
23,250
|
| *75% Model Fund Portfolio/25% SHY. | ||||||
| **6/30/2003 to 12/31/2003. | ||||||
| ***Through 3/31/2014. Portfolio was started on 6/30/2003. | ||||||
Outlook
It seems that every time the market hits new highs investors start to take profits, and every time it pulls back there are buyers waiting to pounce on the opportunity. At some point we will get a significant move, but we can also stay in this trading range for a very long time.
| Annual Return (%) | ||||
| Fund (Ticker) |
Weight
|
2014 YTD
|
2013
|
|
| Guggenheim S&P 500 Equal Weight (RSP) |
40%
|
2.9
|
35.6
|
|
| Guggenheim S&P MidCap 400 Pure Value (RFV) |
20%
|
1.5
|
38.3
|
|
| Guggenheim S&P SmallCap 600 Pure Value (RZV) |
20%
|
1.4
|
45.1
|
|
| iShares MSCI Frontier 100 (FM) |
10%
|
7.6
|
25.6
|
|
|
Vanguard REIT Index (VNQ) |
10%
|
10
|
2.4
|
|
| Portfolio Weighted Performance |
100%
|
3.5
|
33.7
|
|
| Comparison: Spider S&P 500 (SPY) |
|
1.8
|
32.2
|
|
| Cumulative Return | ||||
| Annual Return (%) | of $10,000 ($) | |||
|
YTD
|
2013
|
YTD
|
2013
|
|
| All-ETF Portfolio |
3.5
|
33.7
|
$13,837
|
$13,372
|
| Comparison: Spider S&P 500 (SPY) |
1.8
|
32.2
|
$13,455
|
$13,221
|
| Source: Morningstar, Inc. Data as of 3/31/2014. | ||||
As always, a long-term outlook makes the short-term movement fun to talk about, but ultimately unimportant. By the time I write my next column on the Model Fund Portfolio, in the August 2014 AAII Journal, the mid-term elections should be warming up. Promises and recriminations may be impacting stock prices, particularly in the health care area. Until August, you can follow the Model Fund Portfolio in the Model Portfolios area.
Model Fund Portfolio: Selection Rationale
First Methodology
The fund selection rationale consists of two distinct approaches. The first approach is to select actively managed funds where the managers have shown a long-term ability to outperform the market after allowing for additional portfolio risk, regardless of the sector invested in. A fund must have the following characteristics to be considered for the Model Fund Portfolio:
- It must be a pure no-load fund. Short-term holding penalties are allowed if paid to the fund and not the manager.
- It must have been active for 10 years. However, exceptions are possible.
- It must have outperformed the S&P 500 index over the past five-year and 10-year periods.
- In its worst three-year (calendar) period, it must not have had a loss; or, in particularly difficult market periods, its loss must have been substantially less than that of the S&P 500 index.
- Its expense ratio must not be above 1.25%. Lower ratios will increase desirability.
- Fund assets must not be over $10 billion. Some exceptions are permitted, depending on fund objectives.
- It must currently be open to individual investors, with a minimum investment of $25,000 or less.
The above rules apply to new fund selections. Funds will not automatically be eliminated if they later violate the rules without considering other factors.
Second Methodology
The second methodology selects investment approaches that have provided excess returns or reduced portfolio risk to investors over the long term and then searches for the best traditional fund or exchange-traded fund (ETF) in that area. Factors to be considered are:
- The liquidity of the fund.
- The resources of the management company, in the case of ETFs.
- The investment returns and risk over as long a term as possible, given the newness of so many ETFs.
- Selection of areas with demonstrated long-term excess returns: value stocks, small-cap stocks, real estate and special areas where individuals cannot easily invest. An example of a fund in a special area would be Fidelity Capital & Income fund (FAGIX), which invests in distressed securities.
Portfolio Management Notes
- The Model Fund Portfolio is meant to be a portfolio, and we suggest you invest in the entire portfolio on an equal investment basis—that is, invest equal dollar amounts in each fund initially. If you are building an All-ETF Portfolio, see the recommended weightings shown in Table 3.
- If a fund is closed, create your portfolio from the remaining funds.
- You may make adjustments based on your non-fund holdings. For example, if you have partnership or individual holdings in investment real estate (not personal housing), you may reduce or eliminate any REIT funds.
- There is no need to rebalance on a regular basis. Rebalancing can be accomplished when there are portfolio changes or if one holding gets way out of line. We will notify you of any rebalancing in the Model Fund Portfolio.
Discussion
FREE REPORT

ALLAN KANE from ILLINOIS posted over 12 years ago:
Allen Keiser from MD posted over 12 years ago:
S Shah from TX posted over 12 years ago:
S Shah from TX posted over 12 years ago:
Doug from NY posted over 12 years ago:
Jim Grant from OH posted over 12 years ago:
You need to log in as a registered AAII user before commenting.
Log InCreate an account