


Dividends have historically been a cornerstone principle of value investing. However, companies of all shapes and sizes have implemented dividends into their shareholder return strategies. What is a dividend? Dividends can be issued as cash payments, as shares of stock or as other property, although for this article we are referring to cash dividends only. These cash payments are typically paid quarterly and represent a distribution of a portion of a company’s earnings.
The number of dividend-paying companies in the S&P 500 index increased 15% since 2009 (as of the end of April 2015 using Stock Investor Pro/Thomson Reuters data). Large-cap companies aren’t the only ones following this trend, either. Since 2009, the number of dividend-paying companies in the S&P MidCap 400 and S&P SmallCap 600 indexes increased by 23% and 33%, respectively.
Within the S&P 500, 84% of constituents currently pay a dividend. All 30 members of the Dow Jones industrial average pay a dividend.
With so many companies of such diverse types paying dividends, even investors who don’t necessarily focus on dividend policy as part of their strategy should stay updated on dividend plans and announcements. Whether dividends are currently part of your strategy or will prospectively become part of your strategy, you need solid go-to resources online where you can find valuable dividend information.
Company Websites
Although there are websites that are useful for dividend research, the best place to start is the company’s website. Getting information directly from the source tends to be the best approach. What type of information can you find on the company’s website?
First, you need to locate the investor relations section of the website. Here you can find a wide range of information; companies typically group items into several categories, including but not limited to company profile, events and presentations, financial information, stock information, SEC information, press releases and FAQs. No two companies have the exact same investor relations page, so there is no direct place to find dividend information, but many companies tend to include dividend facts and figures in the stock information or financial information sections. You should be able to find a history of dividend payments with the declared date, record date and payment date. It’s important to look at the history of the dividend payments to see if there are drastic fluctuations in payout amounts. When it comes to dividends, investors should seek stability. A company that doesn’t maintain its payment, or increase its payment, may be a sign that the dividend is not sustainable.
Although the sustainability of a company’s dividend payment isn’t the first priority for many, it’s important to note that a stock’s price typically reacts poorly to a dividend cut. Generally speaking, if capital gains are your goal, you want to make sure that the company in question has been reasonably consistent in its dividend payments.
If you can’t find the dividend information on the company’s investor relations website, you can email investor relations and ask them to provide it.
Other Online Resources
Computershare.com
Computershare.com is useful in dividend research because you can find information regarding a company’s particular direct stock purchase plan (DPP) or dividend reinvestment plan (DRP). Direct stock purchase plans allow individuals to purchase stock directly from the company or through a transfer agent as opposed to through a broker, and dividend reinvestment plans allow stockholders to automatically reinvest dividends into the particular company when they’re paid. All companies’ plans are different and may include or exclude certain features or fees.

When arriving at the site, click “investor centre.” Next, select “company research” toward the top right-hand side of the page. Type in a ticker of the company whose DRP or DPP plan you are considering investing in. At the bottom of the page, click “view direct stock purchase plan details.”
On ComputerShare, the two plans are combined into the term “DSPP,” for direct stock purchase plan. At the “Investment Plans Center,” you may see a couple options for the company you are researching. For example, Procter & Gamble (PG) displays two options, but one of them has the words “employees and retirees” written underneath the company name. Unless you work or worked at the company, avoid clicking on those options.
This page also displays the minimum shares to enroll (for existing accounts) and minimum initial investment (for new accounts) and the plan summary. To read the plan summary, click “view” under the plan summary column. The particular plan’s fees are displayed in the plan summary.
The site contains a link to a copy of the plan brochure that you can view or print, or you can request to have materials sent to you by mail.
Minimum one-time purchase requirements are displayed along with, dividend reinvestment fees, initial setup fee, ongoing automatic investment fee and more.
Dividend.com
Dividend.com is an excellent site for dividend information. It focuses on comprehensive dividend stock research information in the form of daily articles, data and ratings.
When you first reach the website, you see several tabs across the top: Best Dividend Stocks, Ex-Dividend Dates, High Yield Stocks, Screener, Newsletter, Dividend Tools, My Money, News and Premium. If you click on the Ex-Dividend Dates tab, you can search through a range of dates to find companies that are trading ex-dividend. You must own a stock before its ex-dividend date to receive its next dividend payment. Premium members can export this data into Microsoft Excel, and free members are restricted in the amount of times they can perform an ex-dividend search per day.
The Screener tab lets users screen for dividend-paying stocks on metrics such as industry and sector, market cap, share type, stock category. The screener also lets you filter by a desirable range of share price, annual dividend payout and dividend yield. Premium members can search using additional criteria.
An area I find particularly useful is the Dividend Tools tab. Again, not all of this content is available to free users, but there is a fair amount of information readily available at no cost. If you hover your mouse over the Dividend Tools tab, you will see 20 different sub-tabs. Clicking “dividend investing ideas” brings up a wide range of articles relating to dividend investing. Article titles include “Choosing a Sector to Invest In,” or “Dividends in Focus: Industry Leaders.”
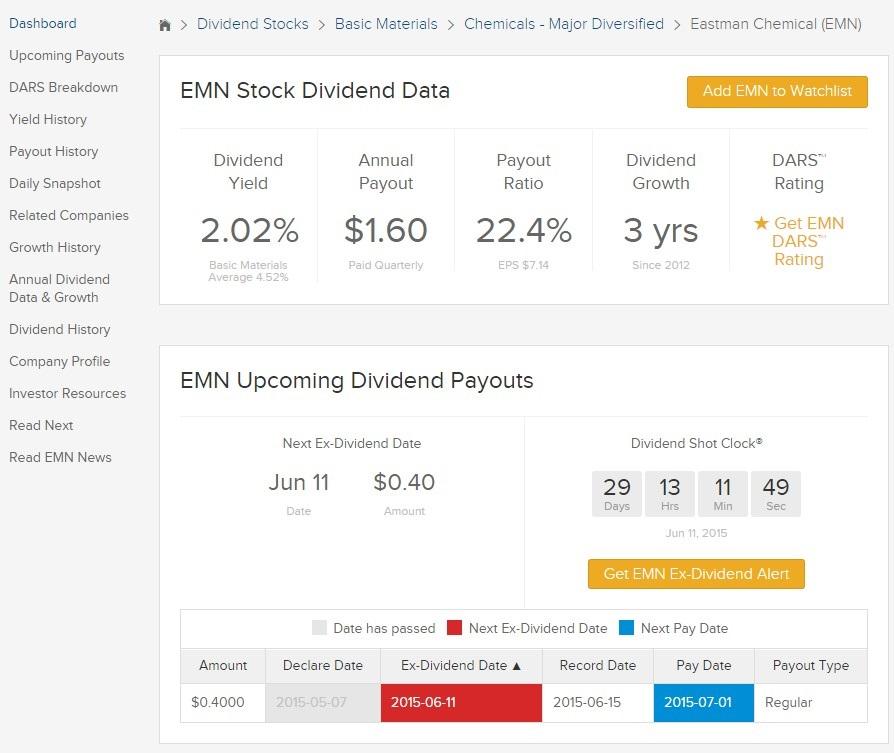
Typing a stock or ETF’s ticker in the search bar at the top of the Dividend.com page brings you to a separate page for that particular equity. The top of the page displays the equity’s dividend yield, annual payout, payout ratio and years of consecutive dividend growth. Any recently announced dividend distributions are shown, along with the declaration date, ex-dividend date, record date, pay date and payout type. A line chart displays the company’s dividend yield and stock price over adjustable periods of one month, three months, six months, one year and five years. Although an “all” option is technically available, in my personal experience it seems to limit you to data from 1995 and forward. The page also displays the security’s historical annual dividend data and growth (two years for non-premium members), recent dividend history, related companies, and recent news items.
Dividend.com offers two versions of paid subscriptions. The “lite” version costs $99 per year and includes the five oldest best dividend stocks, restricted dividend screener, ex-dividend date searches (one per day), DARS stock ratings (Dividend.com’s rating system), full dividend history, daily dividend newsletter and special dividend research reports. For $149 per year, you can get the “premium” version, which has unrestricted access to everything on the site as well as added features such as Excel downloads, the ability to create dividend portfolios and a monthly income generator.
Morningstar
Morningstar.com is a comprehensive website that provides detailed company information as well. When arriving at the site, you can search for an individual company by typing its ticker into the quote box at the top of the page.
The key ratios tab provides 10 years of insightful statistics regarding the company’s financial standing. This includes financial statement information such as gross margin, operating income, dividends, payout ratio, operating cash flow, free cash flow and more. Why do you need to look beyond the dividend payout and history?
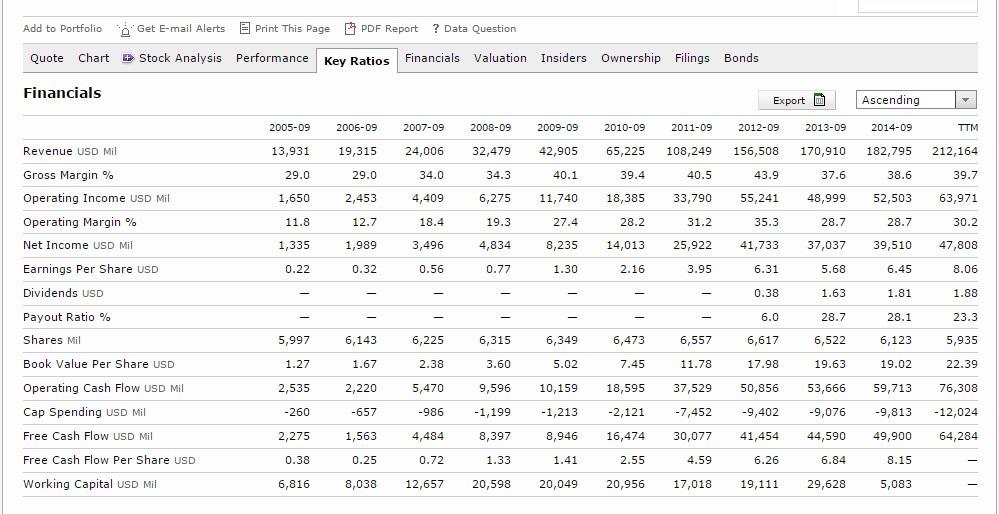
Researching dividends includes researching the financial stability of the firm that pays the dividend. As with any investment, thorough due diligence is necessary before jumping in. You can look at the dividend yield (implied annual dividends per share divided by price per share) and payout ratio (implied annual dividends per share divided by earnings per share) all you want, but if you have not also looked at the financials of the company, it’s difficult to analyze whether the payment is sustainable. You should answer questions such as: Does the company have enough free cash flow to cover its dividend payment? Is there a positive trend in earnings? Has the payout ratio remained steady over the years? Is the company highly leveraged (carries too much debt given its earnings or cash flows)?
Sustainable dividend growth is dependent upon sustainable earnings growth. If dividends stay the same but earnings decline, a company may have to find other means to cover its dividend payments. While dividends are paid from cash balances, one way a company builds up its reserves is by generating consistent income growth. Historically, a high payout ratio is not sustainable in the long term. If a company’s payout ratio is over 100%, the company is paying out more in dividends than it reports in net income. While dividends are paid out of cash and not net income, net income is a key driver of a company’s cash balance.
Morningstar’s premium service costs $189 a year, but all the information explained above is available with a free membership.
StockRover.com
StockRover.com is a comprehensive website geared toward individual investors. It is free, although there is a premium service available. One of the easiest ways to view company-specific information is to create your own watchlist. This is done by clicking the start button in the upper left-hand corner of the home page, then selecting “create watchlist.” Simply add the ticker symbols you want on your watchlist and at the bottom of the pop-out window select “create watchlist” again. The information on the watchlist companies will appear in the center window of the website. StockRover has several built-in views for you to analyze. Although many of them are excellent, I am going to highlight two particular views.
The first view that is useful for dividend analysis is, of course, the “dividends” view. This can be found between the valuation and profitability views, or you can select it via the drop-down titled “views” and selecting “dividends.” Your watchlist is displayed with ticker symbol, company name, dividends per share, dividend yield, payout ratio, dividend one-year change, dividend three-year average, dividend five-year average and the earnings yield. I found that many websites required “premium subscriptions” to view this information, but not StockRover.
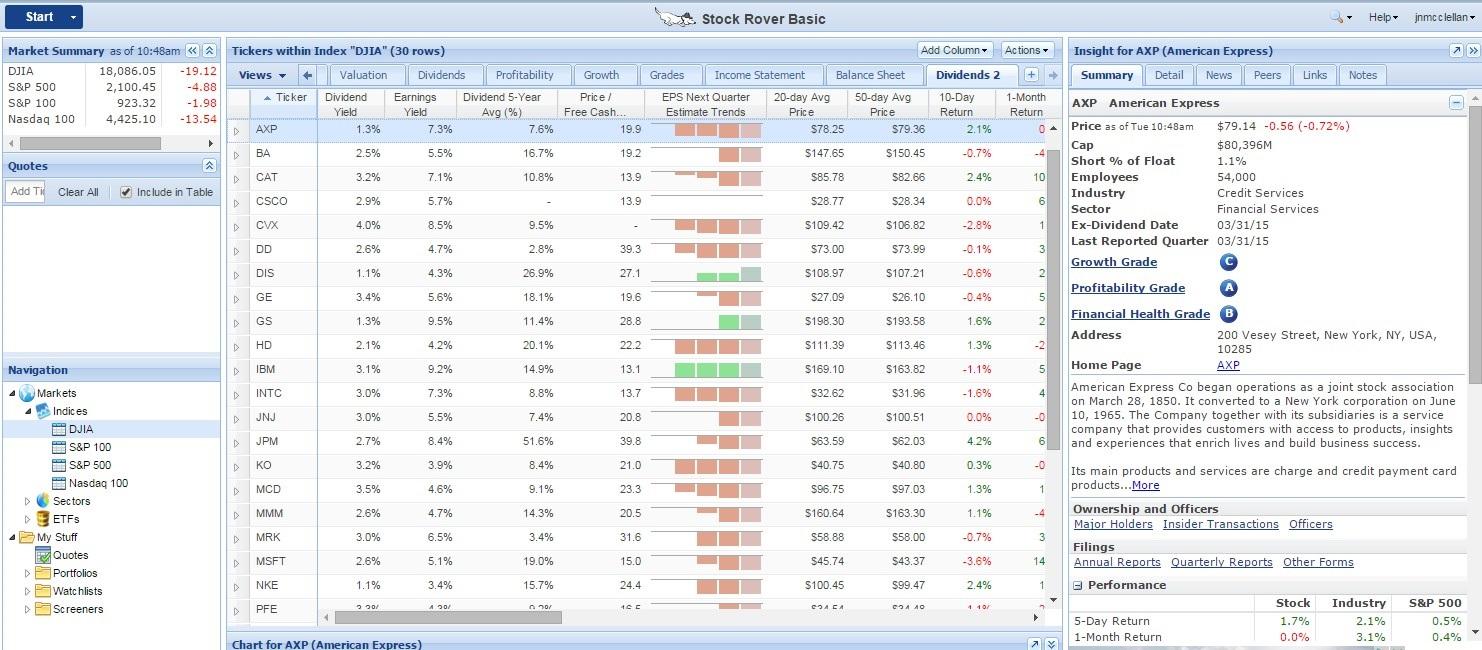
The other useful view is called “Dividends 2” and it is a view that I have created that is available on StockRover’s library. To get this (free) view, go to the start menu, then click “browse library.” In the “types” section along the left-hand side of the pop-out window, click “views.” Then in the “views” section, type “dividends 2” into the search box. You should see the view “Dividends 2” with “J N McClellan” listed as a creator. Check the box that says “import” in the views section. At the bottom of the window, you can then click “import.” This view contains much more information, such as price to free cash flow, earnings per share next quarter estimate trends, 20-day average price, forward price to earnings growth, one-month return, three-month return and more. Hover your mouse over the earnings per share next quarter estimate trends to see the estimated percentage change in quarterly earnings per share, as well as recent revisions to the earnings consensus estimate.
When you select any stock in the center window, detailed information appears in the window to the right. Detailed information includes financial statement information, revenue, operating income, earnings per share and dividend growth, and “grades” for growth, profitability, and financial health, in addition to much more information. This data is sourced from Morningstar.com.
Everything mentioned here is included with the free version of StockRover.com, all you have to do is create a free account. However, StockRover does offer a premium service that costs $249.99 per year ($74.99 per quarter). The premium service offers powerful tools for screening, charting and portfolio management.
Conclusion
Overall, researching dividend information is an important task, one for which you need reliable sources. For the actual dividend details regarding the declaration date, ex-dividend date, record date and payment date, the company’s website is always the first stop. However, researching dividends requires more than simply viewing the company’s dividend dates. You must also investigate the company’s financials to decide if the dividend payment is sustainable. Although dividends might not be the name of your game, several companies you may own or seek to own may pay dividends. The market reacts negatively to dividend decreases, and that could affect your total return over the long run.
Discussion
FREE REPORT

Brock Peacock from TX posted over 11 years ago:
Ted Pickett from Virginia posted over 11 years ago:
Michael Torrey from CA posted over 10 years ago:
Michael Daillak from CA posted over 9 years ago:
jack from virginia posted over 9 years ago:
David Phillips from AL posted over 9 years ago:
Eric from UT posted over 7 years ago:
You need to log in as a registered AAII user before commenting.
Log InCreate an account