


This article is meant to serve as a companion to “What the Evolving Robo Advisory Industry Offers,” a feature article in the October 2016 AAII Journal. Particularly, it compares the asset allocation recommendations and risk-return profiles that were created by several robo-advisers using a hypothetical AAII member.
Additionally, some of the robo-adviser companies disclose a “rough estimate” of the different allocations they use for specific risk-return profiles. Companies that disclosed their set asset weightings include Alpha Architect, Asset Builder, Betterment, Fidelity Go, Hedgeable, Personal Capital, Schwab Intelligent Portfolios, TradeKing Advisors and Wealthfront.
Keep in mind that just because a robo-adviser lists set asset allocations for various types of investors doesn’t mean that you would be placed in the exact allocation you think you fit into. For example, after going through the Betterment questionnaire as an “average AAII member,” Betterment’s algorithm returned a slightly different allocation than the predefined allocation that seemed to fit our example risk-return profile.
Additionally, these allocations may change over time. Each companies’ algorithm and model may change depending on the current market conditions. A model’s output is a function of its inputs.
Determining Allocation
Generally speaking, there are two different types of asset allocation: strategic asset allocation and tactical asset allocation. Strategic asset allocation compares an investor’s return objectives, risk tolerance and investment constraints to long-run capital market expectations. Asset classes are chosen and then permissible weighting ranges are determined. When a portfolio is rebalanced (typically at specific time intervals), the asset classes are reallocated to their target weights. Tactical asset allocation involves making short-term adjustments to asset class weightings based on short-term expected returns and relative performance among asset classes.
Tactical asset allocation is more of a market timing approach and the manager is often trying to beat a benchmark. Asset classes can be intentionally underweighted or overweighted based on short-term market expectations; tactical asset allocation is active management at the asset class level.
A majority of the robo-advisers employ strategic asset allocation.
With most firms, you will see the terms “mean variance optimization,” “efficient frontier,” “Black-Litterman model” and “modern portfolio theory” mentioned. Describing each of these models is beyond the scope of this article, but if you are curious you can find ample information online.
At their core the models focus on the risk-return profile: The goal is to generate the maximum return for a given level of risk. Risk is typically measured by standard deviation, and return is usually a derivation of historical returns combined with an “expected return.” Correlation—the way different asset classes have historically moved in relation to each other—is also considered. The models will add an asset class to your portfolio if its expected return boosts that of your overall portfolio, without adding a significant level of risk. The lower the correlation between asset classes, the better.
These models are extremely sensitive to their input parameters, and are particularly influenced by expected returns.
It was interesting that although many services cited the same models and key phrases, they often recommended totally different asset allocations. The reason for the difference between companies lies within the assumptions used and how often the assumptions are updated. For example, Wealthfront updates its assumptions annually, while Vanguard, which takes a bit more of a “hands on” approach to its robo-investing service, analyzes each investor’s plan quarterly.
The tax efficiency of investments can also play a role in asset allocation. Figure 1 shows Wealthfront’s explanation of the benefits of each asset class: U.S. stocks, foreign developed stocks, emerging market stocks, dividend growth stocks and municipal bonds are considered by Wealthfront to be tax efficient.
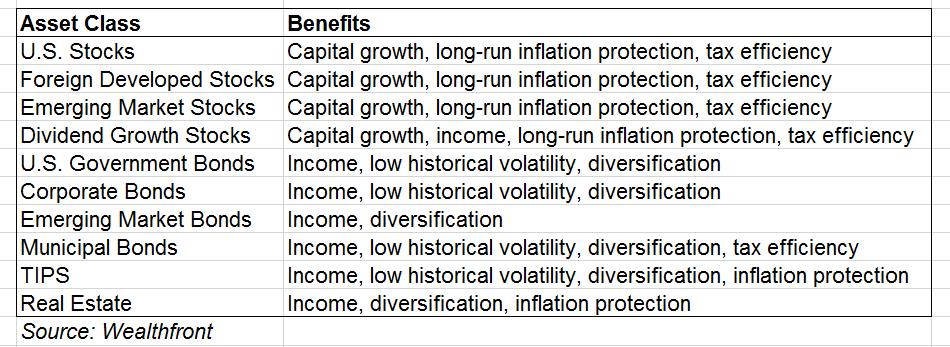
Robo-advisers generally determine tax efficiency by the cash flow distributed by an investment: the higher the cash flow (dividend and interest payments), the less tax-efficient the security. Alpha Architect, AssetBuilder, Betterment, Personal Capital, Schwab, Vanguard, Wealthfront and WiseBanyan all address “tax-efficient investing.”
Robo Questionnaires
Another reason for the large variation between robo-advisers’ asset allocation recommendations is the way they bucket investors into different risk-return profiles. Not all companies use the same five risk-return profiles, and not all companies ask the same questions to determine where you lie on the spectrum.
Alpha Architect, AssetBuilder, Betterment, Schwab Intelligent Portfolios, TradeKing Advisors and Wealthfront allow you to fill out a questionnaire and get a recommended allocation without actually signing up. To try it for yourself, go to these links.
Alpha Architect: Click here and select “invest now” at the top of the page.
AssetBuilder: Click here and select “find your portfolio” toward the top of the page.
Betterment: Click here and select “get started” toward the top of the page.
Schwab Intelligent Portfolios: Click here and select “open an account” at the top of the page. (You don’t need to open an account to get the recommendation.)
Wealthfront: Click here and select “invest now” at the top of the page.
TradeKing Advisors: Click here and select “get started” in the center of the page.
Generally speaking, the robo-advisers factor in the following metrics:
- Age
- Income
- Liquid assets
- Investable assets
- Desired investing term
Each question helps the robos determine your ability to take on risk and your willingness to take on risk. Although they sound similar, these two metrics are very different. Ability to take on risk has to do with your net worth, liquid investments, financial needs and age, while your willingness to take on risk has more to do with your tolerance for and aversion to risk. Ability usually trumps risk. For example, even though a 25-year-old may be comfortable losing $50,000 in a given year, that doesn’t mean he or she actually has the $50,000 to lose.
The process attempts to mimic the typical method used by a traditional adviser, where the adviser creates an investment policy statement (IPS) for each client. An IPS looks at the investors’ risk and return objectives as well as their constraints, which typically include liquidity requirements, time horizon, tax considerations, legal and regulatory considerations and unique circumstances.
Throughout the robo questionnaire process, however, you are not provided with a full IPS. The result is usually just a basic profile of risk and return that allows the robo-adviser to determine which asset classes and respective weightings to employ. An exception to this is Vanguard Personal Advisor Services, which mentions that an IPS will be created for each investor (but not for free!).
Some of the robo-advisers employ goals-based investing, which alters asset allocation based on the goals you have selected. Instead of solely asking questions about your net worth and age, goals-based investing allows you to choose from different goals such as saving for a car, saving for a retirement account, building wealth and saving for an emergency fund. Based on our analysis, some of the robo-advisers that offer goals-based investing include Betterment, Schwab Intelligent Portfolios and Vanguard Personal Advisor.
As an aside, not one of the robo questionnaires examined for this article asked about the investor’s liabilities or fixed expenses.
Asset Allocations
In the spreadsheet attached here, you can see the recommended asset allocations for different levels of risk.
Keep in mind that a majority of the robo-advisers do not invest directly in each asset class; instead, they invest in asset classes through exchange-traded funds (ETFs). So while a particular company might have 20% allocated to U.S. stocks, it typically means U.S. stock ETFs. To see which companies include securities other than ETFs, see our Overview Robo Table.
As a reminder, these asset allocations may change over time; just because they are mentioned on the robo-adviser’s website doesn’t mean you will definitely be bucketed into one of the respective weightings.
Also, certain asset classes can be changed over time as the robo-adviser reanalyzes its long-term outlook, expected returns and correlations.
One example is WiseBanyan’s statement regarding emerging market bonds, “Currently, we do not include emerging market bonds in our investor portfolios. This is because our model and investment process has determined that money is better allocated to emerging market equities and U.S. bonds. Were we to include this in our portfolio, we would use iShares USD Emerging Markets Bond Fund ETF (EMB).” WiseBanyan also does not include municipal bond or natural resource ETFs in its investors’ portfolios at this time.
It may also be difficult to compare “apples to apples” because several robo-advisers separate their asset classes differently. Some are more specific in their allocation breakdown than others. Schwab Intelligent Portfolios appears to be the most specific in their asset class breakdown, listing as many as 21 different asset categories. The company also goes even further into detail by explaining which securities they use as “primary” choices and which they use as “secondary” choices within each asset class grouping. Schwab’s software uses primary and secondary groupings in order to employ tax-loss harvesting; the algorithm switches between market-cap-weighted ETFs and fundamentally weighted ETFs to avoid wash sale rules. Schwab also explains why each asset class was selected, what role it plays in the portfolio, when it performs well and poorly, and why a specific security was chosen above others.
Not all of the robo-advisers disclosed the specific assets or ETFs that are used in each asset allocation. AssetBuilder, Betterment, Fidelity Go, Hedgeable, Schwab Intelligent Portfolios, TradeKing Advisors, Wealthfront and WiseBanyan are those that did disclose this information. Click here to download a Word document with a list of securities employed by each of the robos mentioned above.
It’s important to find out from any prospective robo-adviser what level of flexibility you have in changing the asset classes or assets used once a recommended allocation is presented to you. For example, Fidelity Go, Wealthfront and WiseBanyan don’t allow investors to alter the asset classes or investments used, but Schwab Intelligent Portfolios allows investors to exclude up to three ETFs from the recommended portfolio.
Another important question is whether the robo-adviser analyzes your portfolio as a whole—that is, does it link to your outside brokerage accounts? Or is its analysis limited to only the investments you hold in your robo account? If the service is only analyzing the investments held with it, can it provide a clear picture of your investment objectives and constraints? For example, Wealthfront and WiseBanyan don’t take into account an investor’s entire portfolio, but Betterment and Vanguard do. Not every service spells out what it does on its website, so be sure to ask.
For comparison, AAII’s asset allocation models for an aggressive, moderate, and conservative portfolio are shown in Figure 2.

Hypothetical AAII Member Results
To compare the robo-advisor recommendations, we filled out questionnaires at the sites using an “average” AAII member’s risk-return profile. Tables 1 through 8 display the asset allocations that were recommended for this hypothetical investor. The profile of an average AAII member is: age 65, preparing for retirement, slightly risk-adverse but willing to take on some volatility, and investing for the medium to long term. An initial investment of $50,000 was used, which represents a fraction of the average AAII member’s net worth.
Note that the recommended asset allocations can significantly change if one question is answered differently.
|
Table 1. Alpha Architect: Average AAII Member Result |
|
|
Balanced Risk |
|
| Domestic Stocks | 10.0% |
| Domestic Momentum Stocks | 10.0% |
| Int’l Value Stocks | 10.0% |
| Int’l Momentum Stocks | 10.0% |
| Real Estate | 20.0% |
| Commodities | 20.0% |
| Fixed Income | 20.0% |
|
Table 2. AssetBuilder: Average AAII Member Result |
|
|
Portfolio 9 |
|
| Fixed Income | 40.0% |
| U.S. Large-Cap Stocks | 8.0% |
| U.S. Small-Cap Stocks | 18.0% |
| REIT | 9.0% |
| International Stocks | 12.0% |
| Emerging Market Stocks | 13.0% |
|
Table 3. Betterment: Average AAII Member Result |
|
|
60% Stock 40% Bond Taxable |
|
| U.S. Total Mkt Stocks | 11.7% |
| U.S. Large Cap-Value Stocks | 11.7% |
| U.S. Mid-Cap Value Stocks | 3.8% |
| U.S. Small-Cap Value Stocks | 3.3% |
| Int’l Developed Mkt Stocks | 25.2% |
| Emerging Mkt Stocks | 5.3% |
| U.S. Municipal Bonds | 23.5% |
| U.S. Corporate Bonds | 2.3% |
| Int’l Bonds | 8.8% |
| Emerging Mkt Bonds | 5.1% |
|
60% Stock 40% Bond IRA/401K |
|
| U.S. Total Stock Mkt | 11.7% |
| U.S. Large-Cap Value | 11.7% |
| U.S. Mid-Cap Value | 3.8% |
| U.S. Small-Cap Value | 3.3% |
| Int’l Developed Mkts | 25.3% |
| Emerging Mkts | 5.3% |
| U.S. High-Quality Bonds | 14.0% |
| U.S. Corporate Bonds | 6.8% |
| Int’l Bonds | 13.1% |
| Emerging Mkts Bonds | 5.1% |
|
Table 4. Fidelity Go: Average AAII Member Result |
|
|
Growth |
|
| Domestic Stocks | 49.0% |
| Foreign Stocks | 21.0% |
| Bonds | 25.0% |
| Short-Term | 5.0% |
|
Table 5. Hedgeable: Average AAII Member Result |
|
| Med/High Risk - Taxable | |
| Cash | 2.0% |
| Currencies | 2.0% |
| Emerging Mkt Stocks | 2.0% |
| Fixed Income | 5.6% |
| Int’l Stocks | 1.9% |
| U.S. Stocks | 86.5% |
|
Med/High Risk - Retirement |
|
| Cash | 2.0% |
| Emerging Mkt Fixed Inc | 7.5% |
| Fixed Income | 48.3% |
| MLP | 6.0% |
| Real Estate | 9.9% |
| U.S. Stocks | 26.3% |
|
Table 6. Schwab Intelligent Portfolios: Average AAII Member Result |
|
| Med/High Risk - Taxable | |
| U.S. Large-Cap Stocks | 22.0% |
| U.S. Small-Cap Stocks | 13.0% |
| Int’l Developed Large-Cap | 14.0% |
| Int’l Developed Small-Cap | 7.0% |
| Emerging Mkt Stocks | 8.0% |
| U.S. REITs | 3.0% |
| Int’l REITs | 2.0% |
| Int’l Emerging Mkt Bonds | 9.0% |
| U.S. Corp. High Yield Bonds | 8.0% |
| Gold and Precious Metals | 5.8% |
| Cash | 8.2% |
| Med/High Risk - Retirement | |
| U.S. Large-Cap Stocks | 20.0% |
| U.S. Small-Cap Stocks | 12.0% |
| Int’l Developed Large-Cap | 13.0% |
| Int’l Developed Small-Cap | 7.0% |
| Emerging Mkt Stocks | 8.0% |
| U.S. REITs | 3.0% |
| Int’l REITs | 2.0% |
| U.S. Corp. High Yield Bonds | 8.0% |
| Int’l Emerging Mkt Bonds | 7.0% |
| U.S. Securitized Bonds | 3.0% |
| Int’l Developed Bonds | 2.5% |
| U.S. Invstmnt Grade Corp. Bonds | 1.0% |
| Gold and Precious Metals | 5.0% |
| Cash | 8.5% |
|
Table 7. TradeKing Advisors: Average AAII Member Result |
|
| Medium/High Risk | |
| U.S. Bonds | 17.0% |
| Int’l Bonds | 2.0% |
| Cash | 1.0% |
| Real Estate | 1.0% |
| Int’l Stocks | 29.0% |
| U.S. Stocks | 50.0% |
|
Table 8. Wealthfront: Average AAII Member Result |
|
| Medium Risk - Taxable | |
| U.S. Stocks | 32.0% |
| Foreign Stocks | 14.0% |
| Emerging Markets | 11.0% |
| Dividend Stocks | 5.0% |
| Natural Resources | 5.0% |
| Municipal Bonds | 33.0% |
| Medium Risk - Retirement | |
| U.S. Stocks | 18.0% |
| Foreign Stocks | 13.0% |
| Emerging Markets | 9.0% |
| Dividend Stocks | 15.0% |
| Real Estate | 8.0% |
| Corporate Bonds | 28.0% |
| Emerging Market Bonds | 9.0% |
Performance
Although asset allocation concerns many investors, I frequently get questions about how the robos perform. Unfortunately, not every robo-adviser displays their performance.
Even though some services display the performance of their strategies, comparing performance between robo firms is difficult. First of all, each investor has different inception dates, which makes an apples-to-apples comparison rather difficult. Secondly, allocations change over time and only the company and its clients know when that happens. For some robo-advisers, rebalancing is done at specific time intervals. But a vast majority state that a portfolio is rebalanced when the investor deposits, withdraws, or receives dividends. Different rebalancing thresholds also make comparison more difficult.
Additionally, many companies post backtested or model-based performance. This is likely because each client’s portfolio is “customized,” and also because not many of the robo-advisers have been around long enough to post significant longer-term performance figures.
Of the companies I analyzed in my original robo article in the AAII Journal, only a handful post performance figures on their websites: AssetBuilder, Betterment, Hedgeable, Personal Capital and TradeKing Advisors. Of these, TradeKing Advisers was the only one that stated its performance was not backtested or model-based. Alpha Architect doesn’t post its performance figures, but offers to send performance data to inquiring investors.
Robo-advising firm Covestor posts performance figures on its website; however, there are well over 50 strategies and many different portfolios could be included in a particular risk-reward ranking. To see Covestor’s performance, click here.
Hedgeable and TradeKing Advisors are the only companies that display a risk figure.
Tables 9 through 13 show performance figures that were provided by the individual companies on their websites.
| Table 9. AssetBuilder: Performance | |||
| Portfolio | 3 Yr. Annualized | 5 Yr. Annualized | Since Inception |
| Portfolio 5 | 3.00% | 2.79% | 5.61% |
| Portfolio 6 | 2.87% | 2.91% | 5.97% |
| Portfolio 7 | 3.95% | 3.94% | 6.77% |
| Portfolio 8 | 4.27% | 4.34% | 7.17% |
| Portfolio 9 | 4.59% | 4.75% | 7.60% |
| Portfolio 10 | 4.73% | 4.99% | 7.82% |
| Portfolio 12 | 5.32% | 5.60% | 8.35% |
| Portfolio 14 | 5.86% | 6.06% | 8.80% |
|
Inception May 1998 Data as of July 2016 |
|||
| Table 10. Betterment: Performance | |||
| Portfolio | Avg Annual Return | Cumulative Return | Last 12 Months |
| S&P 500 | 7.20% | 137.50% | 4.00% |
| Betterment 100% Stock | 6.60% | 121.10% | -3.70% |
| Betterment 90% Stock | 6.50% | 117.50% | -2.30% |
| Betterment 80% Stock | 6.30% | 113.00% | -1.00% |
| Betterment 70% Stock | 6.10% | 107.60% | 0.30% |
| Betterment 60% Stock | 5.90% | 102.60% | 1.60% |
| Betterment 50% Stock | 5.60% | 97.20% | 2.60% |
| Betterment 40% Stock | 5.30% | 90.30% | 3.40% |
| Betterment 30% Stock | 4.70% | 76.20% | 3.30% |
| Avg. private client investor 80-100% equity risk | 4.30% | 67.90% | -4.20% |
| Avg. private client investor 60%-80% equity risk | 4.00% | 62.90% | -3.70% |
| Betterment 20% Stock | 3.90% | 60.70% | 3.00% |
| Avg. private client investor 40%-60% equity risk | 3.40% | 50.70% | -3.10% |
| Betterment 10% Stock | 2.90% | 43.20% | 2.30% |
| Avg. private client investor 0%-40% equity risk | 2.70% | 39.40% | -0.90% |
| Five-year U.S. Treasury Bills | 2.50% | 35.10% | 1.40% |
| Betterment 0% Stock | 1.10% | 15.10% | 0.10% |
|
Inception January 2004 Data as of June 2016 |
|||
| Table 11. Hedgeable: Performance | ||
|
Types |
Your Allocation | 40/60 Blend |
| Low Risk | ||
| Year-to-date Return | 7.58% | 6.45% |
| Since Inception Return | 3.02% | 6.71% |
| Annualized Return | 1.73% | 3.83% |
| Low to Medium Risk | ||
| Year-to-date Return | 6.96% | 5.68% |
| Since Inception Return | -0.47% | 3.61% |
| Annualized Return | -0.27% | 2.07% |
| Medium Risk | ||
| Year-to-date Return | 6.88% | 5.82% |
| Since Inception Return | -0.06% | 2.42% |
| Annualized Return | -0.03% | 1.39% |
| Medium to High Risk | ||
| Year-to-date Return | 8.17% | 7.79% |
| Since Inception Return | -0.28% | -0.96% |
| Annualized Return | -0.16% | -0.55% |
| High Risk | ||
| Year-to-date Return | 8.17% | 7.79% |
| Since Inception Return | -0.28% | -0.96% |
| Annualized Return | -0.16% | -0.55% |
|
Inception 12/22/2010 |
||
| Table 12. Personal Capital: Performance | ||||||
| Types | 2012 | 2013 | 2014 | 2015 | 2016 YTD* | Since Inception (Annualized) |
| Aggressive | ||||||
| Composite Personal Strategy | 18.30% | 22.10% | 3.90% | -1.50% | 5.80% | 12.10% |
| Comparative Benchmark | 16.10% | 21.40% | 5.80% | -2.40% | 4.20% | 11.20% |
| Growth | ||||||
| Composite Personal Strategy | 16.90% | 18.00% | 3.20% | -2.00% | 6.00% | 10.60% |
| Comparative Benchmark | 14.60% | 18.10% | 5.60% | -2.20% | 4.60% | 10.10% |
| Moderate | ||||||
| Composite Personal Strategy | 15.50% | 14.00% | 2.60% | -2.50% | 6.30% | 7.80% |
| Comparative Benchmark | 13.00% | 14.40% | 5.40% | -2.10% | 5.00% | 7.80% |
| Balanced | ||||||
| Composite Personal Strategy | 13.50% | 10.20% | 2.20% | -2.70% | 6.30% | 6.40% |
| Comparative Benchmark | 11.30% | 10.80% | 5.10% | -2.00% | 5.50% | 6.70% |
| Conservative | ||||||
| Composite Personal Strategy | 11.30% | 7.40% | 2.00% | -2.90% | 6.30% | 5.20% |
| Comparative Benchmark | 10% | 7.90% | 4.90% | -1.90% | 5.90% | 5.90% |
| Tactical America | ||||||
| Composite Personal Strategy | 17.80% | 34.00% | 7.10% | 1.80% | 6.20% | 16.30% |
| Comparative Benchmark | 16.40% | 33.50% | 12.50% | 0.40% | 3.70% | 16.20% |
| S&P 500 Proxy ETF (SPY) | 16.00% | 32.30% | 13.50% | 1.20% | 3.80% | 16.20% |
|
Inception for Aggressive, Growth, Tactical America 9/30/2011 Inception for Moderate, Balanced, Conservative 12/30/2011 Data as of June 30, 2016* |
||||||
| Table 13. TradeKing Advisors | |||||||||
| Portfolio | 2011 | 2012 | 2013 | 2014 | 2015 | Jan-Mar 2016 | Annualized Return | Cumulative Return | Standard Deviation |
| Conservative | 3.59% | 5.55% | 3.42% | 2.56% | -1.08% | 2.17% | 2.79% | 17.22% | 2.18% |
| Moderate | 1.88% | 8.14% | 7.92% | 3.92% | -1.20% | 2.06% | 4.07% | 24.58% | 3.58% |
| Moderate Growth | -0.14% | 10.65% | 13.24% | 4.85% | -1.51% | 1.75% | 5.26% | 31.46% | 5.79% |
| Growth | -2.14% | 13.05% | 18.71% | 5.02% | -2.05% | 1.32% | 6.20% | 36.88% | 8.27% |
| Aggressive Growth | -4.02% | 14.98% | 22.82% | 5.49% | -2.17% | 1.12% | 6.94% | 41.43% | 10.21% |
|
Inception 9/30/2007 |
|||||||||
In terms of comparing performance, investors can look at data from mutual funds, ETFs and popular indexes. Below are tables sourced from AAII’s Second Quarter 2016 Quarterly Mutual Fund Update and 2016 ETF Guide. Table 14 shows index performance and Tables 15 and 16 shows category average returns for funds and ETFs. Additionally, target date funds can be applicable because of their portfolio compositions and because they adjust allocation based on age. Generally speaking, the further away the target date of retirement, the more aggressive the fund’s asset allocation will be. Wealthfront states, “We believe the next best option to having your portfolio managed by Wealthfront is investing in Vanguard’s target date funds.”
| Table 14. Popular Index Benchmark Returns | |||||||||
|
|
Avg Annual Return (%) | 2016 Return (%) | 2015 Return (%) | 2014 Return (%) | 2013 Return (%) | 2012 Return (%) | |||
|
|
1 Yr | 3 Yr | 5 Yr | 10 Yr | |||||
| S&P 500 TR USD | 4.0 | 11.7 | 12.1 | 7.4 | 3.8 | 1.4 | 13.7 | 32.4 | 16.0 |
| S&P 500 Equal Weighted TR USD | 2.7 | 11.6 | 11.9 | 8.7 | 5.8 | (2.2) | 14.5 | 36.2 | 17.6 |
| S&P MidCap 400 TR | 1.3 | 10.5 | 10.6 | 8.6 | 7.9 | (2.2) | 9.8 | 33.5 | |
| S&P SmallCap 600 TR USD | (0.0) | 10.2 | 11.2 | 7.9 | 6.2 | (2.0) | 5.8 | 41.3 | 16.3 |
| USTREAS Stat US T-Bill 90 Day | 0.2 | 0.1 | 0.1 | 0.9 | 0.1 | 0.1 | 0.0 | 0.1 | 0.1 |
| Barclays US Agg Bond TR USD | 6.0 | 4.1 | 3.8 | 5.1 | 5.3 | 0.6 | 6.0 | (2.0) | 4.2 |
| MSCI World GR USD | (2.2) | 7.5 | 7.2 | 5.0 | 1.0 | (0.3) | 5.5 | 27.4 | 16.5 |
| Russell 1000 TR USD | 2.9 | 11.5 | 11.9 | 7.5 | 3.7 | 0.9 | 13.2 | 33.1 | 16.4 |
|
Source: AAII Quarterly Mutual Fund Update Q2 2016, Morningstar. |
|||||||||
| Table 15. Exchange-Traded Fund (ETF) Category Average Returns | |||||||||
|
|
Avg Annual Return (%) | 2016 Return (%) | 2015 Return (%) | 2014 Return (%) | 2013 Return (%) | 2012 Return (%) | |||
|
|
1 Yr | 3 Yr | 5 Yr | 10 Yr | |||||
| Large-Cap Stock | 3.1 | 11.1 | 11.8 | 7.6 | 4.5 | 0.0 | 13.1 | 32.8 | 15.1 |
| Mid-Cap Stock | (1.7) | 9.6 | 9.7 | 7.3 | 4.5 | (3.5) | 9.9 | 35.6 | 15.8 |
| Small-Cap Stock | (3.9) | 7.9 | 9.2 | 7.0 | 4.7 | (5.1) | 5.3 | 39.7 | 17.0 |
| Real Estate Sector | 18.9 | 11.6 | 11.4 | 6.6 | 12.2 | 0.6 | 27.7 | 1.9 | 19.5 |
| Real Estate Global Sector | 3.6 | 6.1 | 5.8 | -- | 6.1 | (1.0) | 9.7 | 4.5 | 33.4 |
| Balanced: Global | (0.1) | 3.0 | 3.0 | -- | 6.0 | (6.6) | 3.0 | 6.2 | 8.2 |
| Global Stock | (3.3) | 5.8 | 3.6 | 2.6 | 4.5 | (5.4) | 3.3 | 20.4 | 13.7 |
| Foreign Stock | (8.3) | 2.3 | 0.9 | 1.8 | (0.9) | (3.3) | (4.2) | 19.0 | 15.3 |
|
Foreign Stock: Emerging Mkts |
(11.8) | (4.2) | (5.9) | 3.2 | 7.3 | (16.6) | (7.0) | (0.7) | 17.6 |
| General Bond: Short-Term | 1.6 | 1.5 | 1.6 | -- | 2.0 | 0.5 | 0.9 | 1.5 | 4.2 |
| General Bond: Intermediate-Term | 5.8 | 4.2 | 4.6 | 4.9 | 5.8 | 0.2 | 5.6 | (1.2) | 7.9 |
| General Bond: Long-Term | 10.4 | 6.7 | 7.5 | 6.3 | 9.5 | (1.7) | 11.3 | (4.8) | 10.9 |
| Corporate Bond: High-Yield | 0.5 | 3.0 | 4.3 | -- | 7.0 | (4.3) | 0.8 | 6.5 | 15.0 |
| Inflation-Protected Bond | 2.3 | 0.9 | 2.4 | 4.6 | 4.5 | (1.9) | 1.3 | (6.9) | 5.7 |
| Gov’t Bond: Short-Term | 1.2 | 1.4 | 1.0 | 2.3 | 1.6 | 0.5 | 0.8 | 0.1 | 0.3 |
| Gov’t Bond: Intermediate-Term | 9.2 | 5.6 | 5.4 | -- | 8.0 | 1.7 | 8.5 | (5.8) | 4.2 |
| Gov’t Bond: Long-Term | 27.2 | 13.4 | 13.7 | 7.7 | 21.2 | (3.0) | 38.1 | (18.0) | 3.8 |
| International Bond: General | 5.3 | 2.3 | 2.3 | -- | 7.3 | (4.8) | 1.9 | (1.0) | 8.2 |
| International Bond: Emerging | 3.7 | 2.2 | 1.0 | -- | 8.2 | (3.7) | 0.3 | (4.7) | 13.8 |
|
Source: AAII 2016 ETF Guide, Morningstar. |
|||||||||
| Table 16. Mutual Fund Category Average Returns | |||||||||
|
|
Avg Annual Return (%) | 2016 Return (%) | 2015 Return (%) | 2014 Return (%) | 2013 Return (%) | 2012 Return (%) | |||
|
|
1 Yr | 3 Yr | 5 Yr | 10 Yr | |||||
| Domestic Taxable Stock | (1.3) | 8.4 | 8.6 | 6.3 | 4.2 | (2.6) | 8.4 | 32.7 | 15.4 |
| Domestic Taxable Bond | 3.5 | 3.1 | 3.5 | 4.8 | 4.7 | (0.8) | 4.5 | (0.1) | 6.8 |
| Global Stock | (4.7) | 5.7 | 5.8 | 4.5 | (0.3) | (0.8) | 3.1 | 27.1 | 16.4 |
| Foreign Stock | (8.6) | 2.9 | 2.4 | 2.5 | (2.7) | 0.3 | (4.9) | 22.1 | 20.3 |
| Emerging Stock | (10.6) | (1.3) | (3.7) | 1.9 | 7.2 | (14.4) | (3.0) | (0.5) | 20.6 |
| Balanced: Domestic | 0.5 | 5.7 | 6.1 | 5.5 | 3.3 | (1.7) | 6.1 | 16.1 | 11.2 |
| Balanced: Global | (1.5) | 3.9 | 4.0 | 4.6 | 3.7 | (3.8) | 3.3 | 11.9 | 12.3 |
| Target Date: In Retirement | 1.8 | 4.8 | 4.7 | 4.7 | 3.7 | (0.6) | 4.9 | 8.6 | 9.3 |
| Target Date: 2010-2019 | 1.2 | 5.8 | 5.7 | 5.3 | 3.3 | (0.3) | 5.5 | 13.0 | 11.7 |
| Target Date: 2020-2029 | 0.2 | 6.1 | 6.1 | 5.4 | 2.9 | (0.7) | 5.9 | 15.7 | 13.0 |
| Target Date: 2030-2039 | (1.2) | 6.7 | 6.8 | 5.5 | 2.1 | (0.8) | 6.2 | 20.3 | 14.6 |
| Target Date: 2040-2049 | (2.1) | 7.0 | 7.0 | 5.6 | 1.8 | (0.9) | 6.4 | 22.7 | 15.5 |
| Target Date: 2050-2059 | (2.2) | 7.1 | 7.0 | 5.1 | 1.9 | (1.1) | 6.5 | 23.0 | 15.8 |
| Target Date: 2060+ | (1.6) | 7.4 | -- | -- | 2.5 | (1.7) | 7.1 | 24.3 | -- |
|
Source: AAII Quarterly Mutual Fund Update Q2 2016, Morningstar. |
|||||||||
Comparing robo returns to mutual fund returns can also show whether an active manager is able to outperform the robo advisers.
Conclusion
Overall, robo-advisers are a great tool for investors who do not want to deal with managing money themselves.
Most robo-advisers aren’t designed to “beat the market,” so if that’s your goal you will likely be disappointed.
The benefits of robo-advisers include automated investment, automated deposits, automated rebalancing, tax-efficient investing, tax-loss harvesting (in some cases), diversification and simplicity.
Robo-advisers’ fees tend to be much lower than a traditional financial adviser; however, you don’t get the “full” experience that you do with traditional financial advisers. It is difficult to customize the particular asset allocation that a robo-adviser recommends for you, and your brokerage accounts held outside of the robo-adviser may not be taken into account.
Discussion
FREE REPORT

A Brunskill from WA posted over 9 years ago:
ehn from PA posted over 9 years ago:
Jonathan Bates from NY posted over 9 years ago:
Michael Daillak from CA posted over 9 years ago:
Jackie McClellan from IL posted over 9 years ago:
George Purvis from FL posted over 9 years ago:
Bud from Nevada posted over 9 years ago:
You need to log in as a registered AAII user before commenting.
Log InCreate an account