


Wayne Thorp leads a class in AAII's new Essential Investing Video Course. Go to https://www.aaii.com/ves for more information and to subscribe.

Value investing traces its roots to Benjamin Graham who, in 1934, advocated buying stocks at a deep discount to their intrinsic value. It is important to realize that this does not mean buying cheap stocks. Instead, Graham sought to identify high-quality, long-term assets. However, researchers have been hard-pressed to come up with a measure of financial strength as successful in selecting stocks poised to outperform the market as value measures such as the low price-to-book-value ratio.
That may have changed, however, with new research from Robert Novy-Marx, an assistant professor at the Simon Graduate School of Business at the University of Rochester. He found that gross profitability does as good a job at predicting a company’s future returns as conventional value measures. Furthermore, since this test for “quality” is not highly correlated with value measures such as the price-to-book-value ratio or the price-earnings ratio, investors can combine growth and value tests to build more diversified portfolios. He presented his results in two related research papers: “The Quality Dimension of Value Investing” and “The Other Side of Value: The Gross Profitability Premium.”
In the April 2013 issue of the AAII Journal, John Bajkowski outlined Novy-Marx’s approach. The article, “Combining Quality Growth With Value and Momentum,” is available online at AAII.com. In this CI feature, we outline the steps you can use to implement Novy-Marx’s quality growth, value and momentum approach using Stock Investor Pro, AAII’s fundamental stock screening and research database program, and Microsoft’s Excel spreadsheet program.
Gross Profits to Assets
Novy-Marx uses a “gross profitability” or “quality” measure to identify companies that will potentially earn money in the future: gross profits. Gross profit is simply revenue less cost of goods sold (COGS) and represents the amount of profit a company earns by selling its products or services. Cost of goods sold is the cost a firm incurs by manufacturing or producing an item, such as material and direct labor costs. Gross profit reflects a firm’s basic pricing decisions and its material costs. The greater the gross profit and the more stable it is over time, the greater the company’s expected profitability.
Investors normally scale or calculate a ratio from gross income in order to track it over time and to make it comparable to firms of different sizes. A gross margin figure is usually computed by dividing gross income by total revenue. This percentage then reflects the proportion of gross profits earned from each dollar of revenue a firm generates.
Novy-Marx, however, scaled gross income to total assets instead of total revenue, such that gross profit to assets is revenue minus cost of goods sold divided by total assets. By comparing gross profit to assets, investors can see whether or not a firm’s assets are profitable.
Looking at profitability is nothing new, as today’s more profitable companies tend to be the more profitable companies tomorrow. However, investors and analysts alike typically focus their attention on bottom-line performance, or earnings, to measure a company’s success and growth. Novy-Marx contends, however, that the further one goes down the income statement, the more figures are impacted by subjective management decisions or outright accounting trickery. Furthermore, by focusing on the bottom line, you are ignoring the investments a company is making in its future growth—research and development, marketing, etc.—which may pay off in years to come. As a result, simple screens for earnings growth or earnings profitability have a difficult time distinguishing firms that have reduced earnings because they are investing in future growth from firms with lower overall product sales and profitability.
Screening for the Novy-Marx Universe
Using AAII’s Stock Investor Pro software to build portfolios of stocks described by Novy-Marx, we begin by focusing on large-cap stocks, specifically those stocks that are part of the S&P 500 index. We then exclude firms designated as being in the financial sector, per Thomson Reuters’ designation, as well as foreign stocks marked as ADRs (American depositary receipts, foreign stocks traded on American exchanges). Lastly, we exclude any firms with negative common equity at the end of their latest fiscal quarter. Table 1 lists the criteria as used specifically in Stock Investor Pro. As of August 9, 2013, our initial stock universe consisted of 422 non-financial, large-cap stocks.
Novy-Marx calls stocks with high gross profits to assets “quality” growth stocks. His research shows that while these stocks trade with high price-to-book-value ratios, they still have strong future performance. However, the returns on these stocks tend to be uncorrelated, so when you combine them into a portfolio you get higher returns for the same level of risk (or lower risk for the same return).
| Data Category | Conn | ( | Field | Operator | Factor | Compare to (Field, Value, Industry) |
| Company Information | Standard and Poor stock | Equals | 500 | |||
| Company Information | And | Sector | Not Equal | Financial | ||
| Company Information | And | ADR/ADS Stock | Is False | |||
| Balance Sheet - Quarterly | And | Equity (common) Q1 | > | 0 |
Using Stock Investor Pro, we created a custom field for gross profits to assets that divides gross profit over the trailing 12 months by total assets for the most recent fiscal quarter. Table 2 shows the formula Stock Investor Pro subscribers can use to recreate the field. Of the 422 companies in our Novy-Marx universe as of August 9, 2013, six companies did not have reported cost of goods sold data in the Stock Investor Pro database. Since this variable serves as the cornerstone of Novy-Marx’s research, we excluded the six firms that did not have a valid gross-profit-to-assets ratio, leaving us with 416 companies to consider.
| Custom Field Name | Formula |
| Gross profit to assets 12m | ([Gross income 12M]/[Total assets Q1])*100 |
| Stock Investor Pro subscribers can download a text file of this field at www.aaii.com/files/ci/customfield.txt for cutting and pasting into the Custom Field Editor. | |
Ranking the Stocks
Stock Investor Pro gives users the ability to export select data on a group of stocks, including a portfolio, the results of a screen or the entire universe of companies. Using the program’s View Editor, we created a custom view with data points that included our custom field Gross profit to assets 12m, Price/Book and Price Change 52 week, which are measures of quality, value and momentum, respectively. We also included in the view a top-line profit margin figure (gross margin, which is gross profits divided by revenues) and bottom-line net margin and exported the contents of this view for the 416 companies that passed the Novy-Marx analysis.
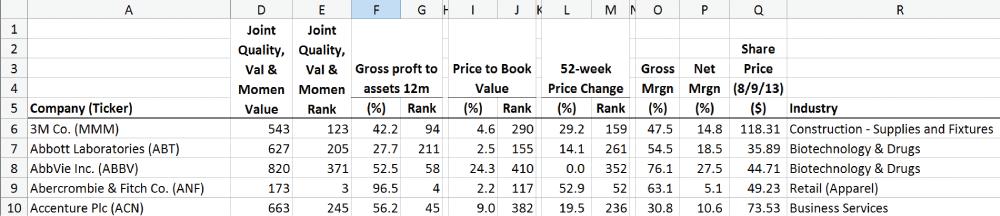
Once we exported the data into Excel, the next step was to run a series of rankings on each data variable—gross-profit-to-assets ratio for quality growth, price-to-book-value ratio for value and 52-week price change for momentum.
Figure 1 is a partial listing of our data export from Stock Investor Pro, with the companies ranked in alphabetical order. [Note that we used Microsoft Excel 2010 for this article.]
Quality Growth
We began our analysis by ranking the 416 companies based on their gross-profit-to assets ratio, which is column F in Figure 1. In cell G6 we entered the following formula to calculate the rankings based on gross profit to assets:
=RANK(F6,$F$6:$F$421,0)
Where F6 is the number whose rank we want to find; $F$6:$F$421 is the array against which the value in F6 is ranked; and 0 indicates that the ranking is in descending order (higher gross profit to assets values received higher rankings).
After entering this formula in cell G6 and hitting Enter, the value 94 was returned. This means that 3M Co’s gross-profit-to-asset ratio value of 42.2% (from cell F6) ranks 94th out of the 416 companies.
The final step is to copy this formula down the gross-profit-to-assets data column for all the other 415 companies. To do this, we clicked in cell G6, held the cursor over the bottom-right corner of the cell until we saw a cross-hair, and then dragged the cell down to G421, the final row of company data.
Table 3 shows the top-ranked stocks for each variable—quality growth, value and momentum. The top third of the table lists the 10 stocks with the highest gross profits to assets (quality). Interestingly, the quality growth list is dominated by retail stocks, perhaps helped by their high asset turnovers. While these stocks rank highly in terms of quality growth, they tend to also have high price-to-book-value ratios and poor price momentum (as measured by 52-week price change).
High Value
Based on academic studies that point to the price-to-book-value ratio as the best value predictor of stock price performance, Novy-Marx created portfolios consisting of the high value (low price-to-book-value ratio) and low value (high price-to-book-value ratio) groups in the universe of 500 non-financial large-cap stocks. The portfolio with low price-to-book-value stocks (high value) had a monthly excess return that was actually higher than that of his high quality (high gross profit to assets) portfolio. However, the volatility was also higher, resulting in a lower risk-adjusted performance figure.
To rank the 416 companies in our data export based on price-to-book value (column I in Figure 1), we entered this formula in Cell J6:
=RANK(I6,$I$6:$I$421,1)
Where I6 is the number whose rank we want to find; $I$6:$I$421 is the array against which the value in I6 is ranked; and 1 indicates that the ranking is in ascending order (lower price-to-book-value ratios received higher rankings). We again copied this formula down the column to cell G421.
The middle third of Table 3 highlights the 11 non-financial S&P 500 stocks with the lowest price-to-book-value ratios. These stocks tend to have low gross-profit-to-assets ratios as well as generally weak price performance. In fact, six of the 11 stocks in the middle section of Table 3 have seen their share price drop over the 52-week period ending August 9, 2013. This group also has a high concentration of natural resource and industrial firms.
Price Momentum
Novy-Marx noted that price momentum is another “robust capital market anomaly” that has been shown to work profitably when used by itself as well as when it is combined with value strategies. Price momentum strategies seek out stocks with strong recent price performance with the hope that the price momentum will continue into the future.
To construct high price momentum portfolios, Novy-Marx ranked stocks by their performance in the first 11 months of the year preceding the annual portfolio formation.
To rank the 416 companies in our data export based on 52-week price change, we entered this formula into cell M6 of Figure 1:
=RANK(L6,$L$6:$L$421,0)
Where L6 is the number whose rank we want to find; $L$6:$L$421 is the array against which the value in L6 is ranked; and 0 indicates that the ranking is in descending order (higher 52-week price change values received higher rankings). Once again we copied this formula down the column to cell M421.
|
Joint Quality, Val & Momen Value |
Joint, Quality, Val & Momen Rank |
|||||||||||
|
Gross-Profit- to-Assets Ratio |
Price-to- Book-Value Ratio |
52-Week Price Change |
Share Price (8/9) ($) |
|||||||||
|
Gross Mrgn (%) |
Net Mrgn (%) |
|||||||||||
| Company (Ticker) | (%) | Rank | (%) | Rank | (%) | Rank | Industry | |||||
|
Stocks Ranked by Gross-Profit-to-Assets Ratio |
||||||||||||
| Robert Half Int’l (RHI) | 465 | 64 | 117.2 | 1 | 6.1 | 348 | 36.9 | 116 | 40.3 | 5.4 | 38.55 | Business Services |
| Estee Lauder Cos. (EL) | 599 | 174 | 113.3 | 2 | 8.1 | 373 | 20.5 | 224 | 80.1 | 9.7 | 66.59 | Personal & House Prods |
| Coach, Inc. (COH) | 723 | 310 | 104.7 | 3 | 6.2 | 350 | -3.1 | 370 | 72.9 | 20.4 | 53.37 | Retail (Apparel) |
| Abercrombie & Fitch (ANF) | 173 | 3 | 96.5 | 4 | 2.2 | 117 | 52.9 | 52 | 63.1 | 5.1 | 49.23 | Retail (Apparel) |
| Dollar Tree, Inc. (DLTR) | 706 | 296 | 96.2 | 5 | 6.8 | 359 | 2.4 | 342 | 35.9 | 8.4 | 52.92 | Retail (Depart & Disc) |
| Apollo Group Inc. (APOL) | 528 | 110 | 90.6 | 6 | 2.0 | 109 | -29.2 | 413 | 56.6 | 7.9 | 20.15 | Schools |
| Family Dollar Stores (FDO) | 622 | 201 | 90.5 | 7 | 5.4 | 324 | 10.1 | 291 | 34.0 | 4.1 | 71.47 | Retail (Spec Non-Apparel) |
| Avon Products, Inc. (AVP) | 516 | 100 | 86.2 | 8 | 8.1 | 374 | 33.7 | 134 | 61.4 | -0.5 | 21.98 | Personal & House Prods |
| Fossil Group Inc. (FOSL) | 459 | 61 | 85.9 | 9 | 6.2 | 349 | 39.3 | 101 | 56.6 | 12.2 | 120.60 | Jewelry & Silverware |
| Gap Inc., The (GPS) | 535 | 120 | 85.2 | 10 | 6.5 | 356 | 28.1 | 169 | 39.9 | 7.8 | 44.10 | Retail (Apparel) |
|
Stocks Ranked by Price-to-Book-Value Ratio |
||||||||||||
| Alcoa Inc. (AA) | 786 | 352 | 8.8 | 396 | 0.7 | 1 | -7.2 | 389 | 14.5 | 0.6 | 8.22 | Metal Mining |
| WPX Energy Inc. (WPX) | 548 | 128 | 15.2 | 346 | 0.7 | 2 | 22.7 | 200 | 48.9 | -9.1 | 19.16 | Oil & Gas Operations |
| Cliffs Natural Res (CLF) | 826 | 376 | 6.9 | 407 | 0.8 | 3 | -45.9 | 416 | 16.5 | -22.8 | 24.35 | Metal Mining |
| Nabors Industries (NBR) | 674 | 257 | 18.5 | 312 | 0.8 | 4 | -0.3 | 358 | 35.1 | 3.0 | 15.58 | Oil Well Serv & Equip |
| United States Steel (X) | 805 | 364 | 8.6 | 397 | 0.8 | 4 | -19.5 | 404 | 7.0 | -0.9 | 18.85 | Iron & Steel |
| NRG Energy Inc. (NRG) | 601 | 176 | 6.9 | 408 | 0.9 | 6 | 26.2 | 187 | 25.4 | 3.3 | 26.35 | Electric Utilities |
| First Solar, Inc. (FSLR) | 387 | 29 | 12.3 | 367 | 0.9 | 7 | 89.0 | 13 | 26.4 | 10.5 | 41.02 | Semiconductors |
| Rowan Cos. PLC (RDC) | 751 | 328 | 9.0 | 394 | 1.0 | 8 | 1.1 | 349 | 46.6 | 15.4 | 36.08 | Oil Well Serv & Equip |
| J.C. Penney Co. (JCP) | 556 | 139 | 35.6 | 132 | 1.0 | 9 | -41.8 | 415 | 29.6 | -9.4 | 12.87 | Retail (Depart & Disc) |
| Apache Corp. (APA) | 668 | 252 | 21.8 | 277 | 1.0 | 10 | -6.0 | 381 | 81.3 | 14.8 | 83.20 | Oil & Gas Operations |
| Corning Incorporated (GLW) | 534 | 117 | 12.1 | 369 | 1.0 | 10 | 30.2 | 155 | 43.1 | 24.3 | 15.09 | Electronic Instruments & Controls |
|
Stocks Ranked by 52-Week Price Change |
||||||||||||
Netflix, Inc.  (NFLX) (NFLX) |
644 | 224 | 24.7 | 245 | 13.3 | 398 | 336.5 | 1 | 28.0 | 1.2 | 252.75 | Broadcasting & Cable TV |
| GameStop Corp. (GME) | 181 | 5 | 72.2 | 23 | 2.5 | 156 | 191.0 | 2 | 30.1 | -3.3 | 48.97 | Retail (Technology) |
| Tripadvisor Inc. (TRIP) | 440 | 46 | 58.0 | 38 | 13.6 | 399 | 123.7 | 3 | 98.3 | 25.9 | 80.94 | Recreational Activities |
| Sealed Air Corp. (SEE) | 496 | 82 | 28.0 | 207 | 4.3 | 285 | 114.8 | 4 | 33.5 | -17.3 | 30.09 | Containters & Packaging |
| Gilead Sciences (GILD) | 524 | 105 | 34.1 | 144 | 8.2 | 375 | 108.1 | 5 | 74.9 | 28.4 | 59.21 | Biotechnology & Drugs |
| Boston Scientific (BSX) | 342 | 19 | 28.7 | 201 | 2.3 | 135 | 106.4 | 6 | 68.4 | -11.6 | 11.35 | Medical Equip & Supplies |
| Micron Technology (MU) | 490 | 78 | 9.7 | 390 | 2.0 | 93 | 105.4 | 7 | 16.6 | -9.3 | 13.99 | Semiconductors |
| Electronic Arts Inc. (EA) | 282 | 8 | 52.4 | 59 | 3.3 | 215 | 103.1 | 8 | 63.7 | 3.1 | 26.65 | Software & Programming |
| Celgene Corp. (CELG) | 475 | 68 | 46.9 | 73 | 10.9 | 393 | 99.4 | 9 | 94.7 | 26.1 | 142.07 | Biotechnology & Drugs |
| Tyson Foods, Inc. (TSN) | 398 | 34 | 18.7 | 311 | 1.8 | 77 | 98.2 | 10 | 6.7 | 2.6 | 31.36 | Food Processing |
| Source: AAII Stock Investor Pro/Thomson Reuters. Data as of 8/9/2013. | ||||||||||||
We ranked the non-financial S&P 500 stocks by their 52-week price change and present the top 10 stocks in the bottom third of Table 3. Netflix Inc. (NFLX) tops the list with a 336.5% price increase over the last 52 weeks. Biotech and technology stocks also appear on the list.
Combining the Variables
Novy-Marx constructed portfolios that brought together the stocks with the highest scores of quality, value and price momentum by combining the three individual rankings to form a single composite rank, or score. His research paper indicates that all three rankings were given equal weighting for the sake of simplicity, although you might be able to improve performance by changing the weights.
To arrive at a composite rank for quality, value and momentum, we first add together the individual company rankings for the three data fields. In cell D6 of Figure 1, we entered:
=G6+J6+M6
Where this is the sum of the gross-profit-to-asset rank (G6), price-to-book-value rank (J6) and 52-week price change rank (M6). To calculate this value for all the other companies, we copied this formula down the column to row 421 by clicking in cell D6, holding the cursor over the bottom-right corner of the cell until we saw a cross-hair, and then dragged the cell down to D421, the final row of company data.
The final step is to rank all the companies based on their combined quality, value and momentum score. In cell E6, we entered:
=RANK(D6,$D$6:$D$421,1)
Where D6 is the number whose rank we want to find; $D$6:$D$421 is the array against which the value in D6 is ranked; and 1 indicates that the ranking is in ascending order (lower joint quality, value and momentum values received higher rankings). One final time we copied this formula down the column to cell E421.
Table 4 displays the 20 non-financial S&P 500 stocks with the best combined quality, value and momentum ranking. While you will see stocks on this list from industries such as airlines, schools and semiconductors, many of the companies are in the oil and gas and retail industries.
Conclusion
For nearly 80 years, academics and practitioners have been trying to identify reasonably priced firms with above-average performance prospects. Novy-Marx offers his “quality” investing approach as an alternative to traditional value investing. He seeks out high-quality assets that can be bought without overpaying for them, instead of buying cheap stocks that could be bad. He is fond of using one of Warren Buffett’s sayings, “It’s far better to buy a wonderful business at a fair price than to buy a fair business at a wonderful price.”
|
Joint Quality, Val & Momen Value |
Joint, Quality, Val & Momen Rank |
|||||||||||
|
Gross-Profit- to-Assets Ratio |
Price-to- Book-Value Ratio |
52-Week Price Change |
Share Price (8/9) ($) |
|||||||||
|
Gross Mrgn (%) |
Net Mrgn (%) |
|||||||||||
| Company (Ticker) | (%) | Rank | (%) | Rank | (%) | Rank | Industry | |||||
| Safeway Inc. (SWY) | 156 | 1 | 74.5 | 21 | 1.9 | 85 | 53.7 | 50 | 26.4 | 1.3 | 25.05 | Retail (Grocery) |
| Washington Post (WPO) | 171 | 2 | 44.0 | 84 | 1.6 | 56 | 68.0 | 31 | 53.7 | 2.4 | 584.97 | Schools |
| Abercrombie & Fitch (ANF) | 173 | 3 | 96.5 | 4 | 2.2 | 117 | 52.9 | 52 | 63.1 | 5.1 | 49.23 | Retail (Apparel) |
| Southwest Airlines (LUV) | 176 | 4 | 44.6 | 82 | 1.5 | 40 | 52.0 | 54 | 50.2 | 2.2 | 13.74 | Airline |
| GameStop Corp. (GME) | 181 | 5 | 72.2 | 23 | 2.5 | 156 | 191.0 | 2 | 30.1 | -3.3 | 48.97 | Retail (Technology) |
| Phillips 66 (PSX) | 184 | 6 | 57.2 | 42 | 1.7 | 67 | 46.1 | 75 | 16.3 | 2.7 | 58.92 | Oil & Gas - Integrated |
| Hess Corp. (HES) | 253 | 7 | 30.5 | 183 | 1.1 | 14 | 51.0 | 56 | 45.8 | 13.2 | 74.89 | Oil & Gas Operations |
| Electronic Arts Inc. (EA) | 282 | 8 | 52.4 | 59 | 3.3 | 215 | 103.1 | 8 | 63.7 | 3.1 | 26.65 | Software & Programming |
| Gannett Co., Inc. (GCI) | 286 | 9 | 38.8 | 110 | 2.5 | 150 | 70.9 | 26 | 45.0 | 8.5 | 25.77 | Printing & Publishing |
| Walgreen Co. (WAG) | 300 | 10 | 57.9 | 39 | 2.5 | 150 | 37.5 | 111 | 29.1 | 3.0 | 49.61 | Retail (Drugs) |
| Western Digital. (WDC) | 302 | 11 | 31.1 | 176 | 1.9 | 83 | 56.9 | 43 | 28.4 | 10.8 | 67.50 | Computer Storage Devs |
| Best Buy Co., Inc. (BBY) | 304 | 12 | 69.2 | 25 | 3.6 | 240 | 59.6 | 39 | 23.1 | -1.6 | 30.63 | Retail (Technology) |
| Staples, Inc. (SPLS) | 314 | 13 | 52.2 | 60 | 1.8 | 82 | 27.4 | 172 | 26.5 | -0.2 | 16.95 | Office Supplies |
| Tesoro Corp. (TSO) | 322 | 14 | 28.3 | 204 | 1.6 | 59 | 50.3 | 59 | 11.6 | 1.9 | 53.08 | Oil & Gas Operations |
| Valero Energy Corp. (VLO) | 324 | 15 | 27.4 | 213 | 1.1 | 18 | 40.9 | 93 | 8.8 | 2.0 | 37.13 | Oil & Gas Operations |
| Murphy Oil Corp. (MUR) | 325 | 16 | 37.3 | 119 | 1.5 | 41 | 28.7 | 165 | 23.3 | 4.0 | 70.90 | Oil & Gas Operations |
| Kroger Co., The (KR) | 327 | 17 | 83.0 | 15 | 4.4 | 288 | 72.7 | 24 | 20.6 | 1.6 | 38.88 | Retail (Grocery) |
| Lowe’s Companies (LOW) | 340 | 18 | 49.9 | 63 | 3.8 | 248 | 69.8 | 29 | 34.3 | 3.9 | 45.68 | Retail (Home Improv) |
| Boston Scientific Corp. (BSX) | 342 | 19 | 28.7 | 201 | 2.3 | 135 | 106.4 | 6 | 68.4 | -11.6 | 11.35 | Medical Equip & Supplies |
| Symantec Corp. (SYMC) | 357 | 20 | 43.8 | 88 | 3.4 | 227 | 57.8 | 42 | 82.9 | 10.8 | 26.82 | Software & Programming |
| Source: AAII Stock Investor Pro/Thomson Reuters. Data as of 8/9/2013. | ||||||||||||
Novy-Marx’s research indicates that a portfolio of value, momentum and profitability stocks provides a much higher reward per unit of risk than traditional value approaches, as well as significant reduction in extreme risk or losses. However, keep in mind that quantitative stock screening such as this only marks the first step in the analysis process. It is up to the individual investor to perform their own due diligence to confirm that these stocks are the right fit for their own portfolios.
John Bajkowski, AAII president, contributed to this article.
Discussion
FREE REPORT

Lee Martin from CA posted over 13 years ago:
John Wiley from AZ posted over 13 years ago:
Stan Deutsch from CA posted over 12 years ago:
G2 from NY posted over 12 years ago:
Arnold Siemsen M D from HI posted over 12 years ago:
VAIDY B from CAN posted over 5 years ago:
Wayne T from IL posted over 5 years ago:
VAIDY B from CAN posted over 5 years ago:
You need to log in as a registered AAII user before commenting.
Log InCreate an account