

Related

Financial Statements
Secular growth companies increase earnings in both good and bad economic cycles. This screen is designed to identify such companies.
by John Bajkowski | May 2012

Many growth stocks have performed strongly during the recent uncertain economic times. Investors have been attracted to companies that have been able to improve net income while other firms struggle.
However, the allure of buying into a stock with the potential for a tenfold increase in price must be balanced with the potential for substantial price declines if the company fails to meet the market’s growth expectations. As long as a firm maintains its earnings per share momentum and exceeds the market’s growth expectations, its stock price can be expected to outpace the market. When expectations are high, a small deviation from market expectations in a quarterly earnings announcement can send the price flying in either direction. Over the long run, stock prices are driven by proven company earnings and cash flow, while in the short term, changes in expectation can move stock prices sharply. If you seek out high return potential, then you must be willing to take on additional risk.
Investors seeking out growth stocks like to separate secular growth from cyclical growth. Companies expanding on a secular basis are growing without regard to the overall business economic cycle. In contrast, the fortunes of a cyclical company depend upon the business cycle. Positive cyclical growth occurs as the economy moves from a recession to expansion. Cyclical auto manufacturers such as Ford Motor Co. (F) have shown strong growth in earnings over the last three years as the economy has come out of its deep recession. True growth companies expand throughout the economic cycle.
Growth companies expand at a rate above that of the overall economy. Practically speaking, however, the minimum benchmark for being classified as a growth stock is at least a 10% annual growth rate in earnings per share, with many investors requiring a 20% annual growth rate. To maintain growth rates this high over any extended period, capital spending is required; for this reason, growth stocks tend to retain most of their earnings, paying little or no cash dividends.
Screening can be used as the first step in indentifying growth stock prospects. Screening is the process of applying a set of criteria to a universe of stocks to filter out those securities that merit a closer look. AAII’s Stock Investor Pro fundamental stock screening and research database program was used to perform the screening for this article.
While there are many ways to measure company growth, most investors focus on earnings growth, with an emphasis on a high and expanding growth rate. A common first screen is to specify a high absolute minimum growth rate. Unfortunately, most studies indicate that portfolios constructed using just high levels of historical or expected earnings growth tend to underperform the market. An analysis of the successful stock strategies tracked on AAII.com shows greater success with growth strategies that seek out consistent year-after-year growth. Requiring consistently rising earnings each year can help identify more stable growth companies.
The primary growth filter constructed for this article focuses on year-to-year changes in earnings per share from continuing operations, looking for steady and increasing earnings annually. A screen requiring increased earnings for each of the last five fiscal years was specified. Only 207 stocks out of a universe of over 10,015 companies passed this filter. If you want to be more stringent in your screening, you might require an increase in the year-to-year growth rate for the past few years. The acceleration of the growth rate is referred to as momentum. In our case, simply looking for companies that were able to keep increasing earnings while the world went through a severe recession seemed stringent enough.
In selecting a time period for historical analysis, the economic environment should be kept in mind. Earnings growth should be examined over longer time periods that cover at least one economic cycle to make sure you are focusing on true secular growth companies, not cyclical firms during an economic upswing.
We also established a filter that required that the trailing 12-month earnings be equal to or greater than earnings for the last fiscal year. Note that for one quarter of the year these two figures will be the same. As a firm starts to report quarterly results during the course of the year, the trailing 12-month earnings number will encompass a time frame different from the prior year’s annual figure.
Investors examining growth stocks look toward any signs that a trend in growth may be broken. Quarterly earnings are closely examined and deviations from expected results are quickly rewarded or severely punished. The seasonality of sales and earnings for most firms, however, does not allow investors to compare one quarter to the preceding quarter in a meaningful way. To deal with seasonality, it is best to compare one quarterly figure to the figure for the same quarter one year prior. A decrease from the same quarter one year ago is a warning flag that merits investigation. In our screening process, higher quarterly earnings than that for the same quarter one year ago (quarter over quarter) was required for each of the last four quarters.
Beyond examining overall growth, or momentum, many investors examine how a company compares to its industry peers.
The ability to grow faster than the industry group may point to a firm that has a competitive edge. Even a firm in a cyclical industry may have a period of secular growth as it expands its market share.
Therefore, we established a filter that required the five-year annual growth in earnings for the company to be above that of its industry median (midpoint).
Screening based upon earnings requires careful analysis of a firm’s reports, which can highlight how the growth was achieved.
Was the growth due to acquisition or internal expansion? Most growth companies report on their “organic” growth rates during quarterly earnings reviews. Did currency translation impact earnings? How are same-store sales for retail stocks?
Looking at sales growth will also provide a confirmation of how earnings were achieved. Growing sales create growing earnings as long as profit margins are not severely sacrificed. A truly attractive growth stock must be able to demonstrate top-line sales growth. A screen requiring increased sales for each of the last five fiscal years was specified. We also established a filter that requires trailing 12-month sales to be equal to or greater than sales for the last fiscal year. And as with earnings, higher quarterly sales than that of the same quarter one year ago (quarter over quarter) was required for each of the last four quarters.
The final screen we applied simply required that stocks be listed on an exchange. Around 50 stocks passed all of these criteria. To highlight a cross-section of companies, the firms passing the screen were divided up into groups based upon size as measured by market capitalization. The largest number of passing stocks fell into the large-cap range, so the 20 large-cap stocks with the highest five-year annual historical growth rate are presented in Table 1 along the 10 fastest-growing mid-cap stocks and the 10 fastest-growing small-cap stocks. Medians for the companies in the S&P 500 index, MidCap 400 index, and SmallCap 600 index are provided for comparison.
Table 1. Companies Passing the Consistent and High Earnings Growth Screen
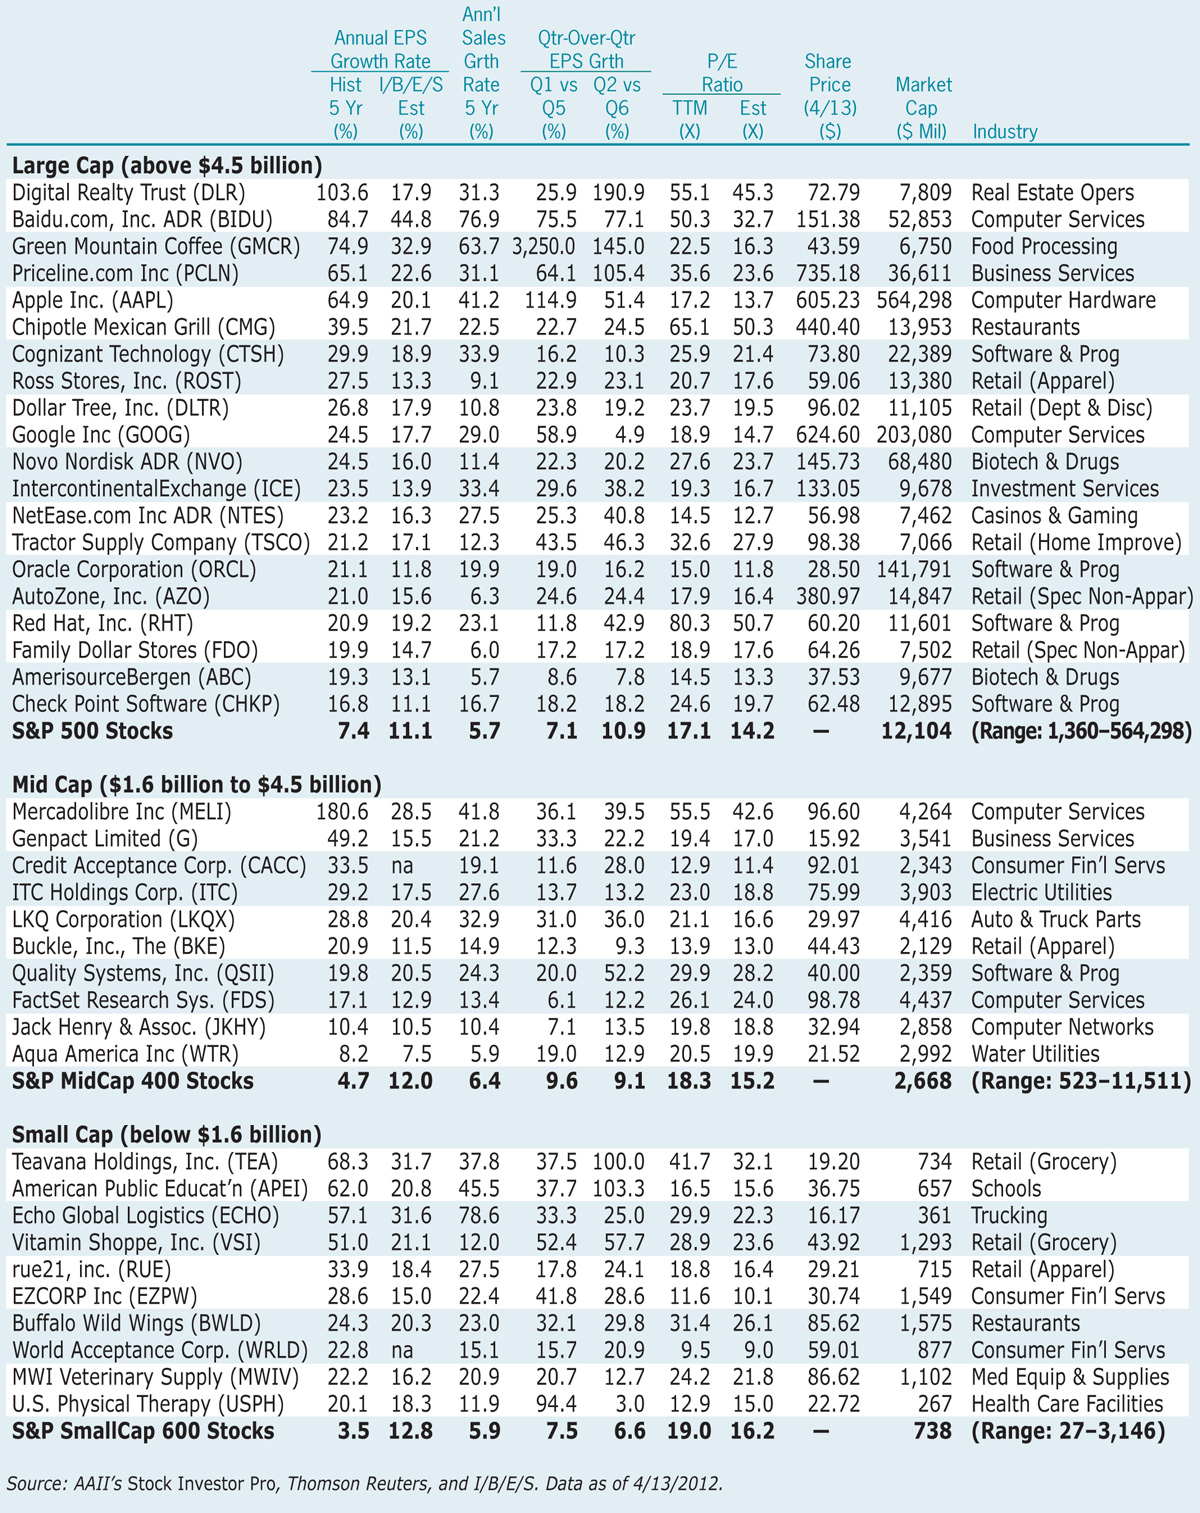
Annual EPS Growth Rate—Hist 5 Yr (%): Annual growth in earnings per share from continuing operations over the last five fiscal years. A measure of how successful the company has been in generating and expanding its bottom line, net profit.
Annual EPS Growth Rate—I/B/E/S Est (%): The consensus annual estimate of earnings per share growth over the next three to five years that is forecasted by analysts polled by I/B/E/S. An indication of the market’s growth expectation for a company.
Ann’l Sales Growth Rate 5 Yr (%): Annual growth in sales (revenue) over the last five fiscal years. Used to provide a confirmation of the quality of the historical earnings per share growth rate.
Qtr-Over-Qtr EPS Growth (%): The change in earnings per share for the a quarter relative to the same quarter a year ago, expressed as a percentage. Helps to provide an indication of the recent trend in earnings per share growth and signals if growth is accelerating.
P/E Ratio—TTM: Share price divided by the most recent 12 months’ earnings per share from continuing operations. A measure of the market’s expectations regarding the company’s earning prospects and risk. Firms with very high price-earnings ratios are being valued by the market on basis of high growth potential.
P/E Ratio—Est: Share price divided by the average earnings per share from continuing operations expected by analysts for the current fiscal year. A measure of the market’s expectations regarding the company’s earning prospects and risk. Firms with very high forward price-earnings ratios are being valued by the market on basis of high growth potential.
Market Cap ($ Mil): Current share price multiplied by the number of shares outstanding, expressed in millions of dollars. A measure of company size.
Industry: Primary industry as classified by Thomson Reuters.
Our screen focuses on historical performance, but growth stock investors also focus on expected performance. Looking at market consensus forecast figures helps to provide an indication of the expectations built into the valuation. It is the company’s ability to meet and, more importantly, exceed these expectations that leads to strong returns. Digital Realty Trust (DLR), the firm with the highest historical earnings growth among large-cap stocks, is a real estate investment trust (REIT) that specializes in leasing data centers. The growth in computer server farms and cloud computing has helped earnings expand more than 100% annually over the last five years. This type of growth is not sustainable. Looking forward, the average long-term growth estimate is 17.9%, but the range of estimates varies from a low of 5.0% to high of 45.6%.
The price-earnings ratios for the passing stocks tended to be above the market average, as would be expected for companies with above-average prospects. To better judge price-earnings ratios, many analysts look at price compared to forecasted earnings. While this helps to lower the price-earnings ratio for these growth stocks, many of these firms still have very high forward price-earnings ratios. Promising growth stocks attract a great deal of attention, and therefore prices tend to be bid up with high anticipation. It is not uncommon to see highly touted growth stocks with price-earnings ratios two to four times that of the market.
Investing in growth stocks can be an extremely rewarding experience. Success, however, requires careful analysis and constant monitoring of the portfolio.
Financial Statements

Stock Strategies

James from AL posted over 14 years ago:
Vernon from AR posted over 14 years ago:
Jerry from AZ posted over 14 years ago:
Leroy from CO posted over 14 years ago:
Michael from CA posted over 14 years ago:
Bob from TX posted over 14 years ago:
Larry from MI posted over 14 years ago:
Jean from IL posted over 14 years ago:
Nick` from NJ posted over 14 years ago:
John from KS posted over 14 years ago:
John from KS posted over 14 years ago:
Peter from FL posted over 14 years ago:
Mike from OH posted over 13 years ago:
Jim B from WA posted over 13 years ago:
You need to log in as a registered AAII user before commenting.
Log InCreate an account