




Alex Reisman of Stock Rover gives an overview of the online stock research platform.
At a glance:
- Online stock research software
- Screening, stock comparison & portfolio analysis
- Link to brokerage for automatic portfolio syncing
- Free & paid membership plans
Stock Rover is an interactive “dashboard” where you can engage in robust stock research. Stock Rover’s goal is to help individual investors make informed, independent decisions and to support them in their investing goals.
There are two membership levels: Basic (free) and Premium ($249.99/year or $74.99/quarter). Both levels provide detailed data on North American tickers, using the same integrated, comparison-oriented format. The major advantages that Premium offers over Basic are more Financial Metrics, 10 years of historical data rather than five, data export to offline CSV files, more flexible screening, deeper portfolio analysis, portfolio planning tools, and an ad-free environment. A 14-day free trial of Premium is available to all users (no payment information is needed; learn how to start the trial here).
Let’s take a look at how Stock Rover can help you fine-tune your investing.
Comparison
Comparison is a cornerstone of Stock Rover, so opportunities to compare tickers against peers, benchmarks, or other stocks of interest can be found throughout the user interface.
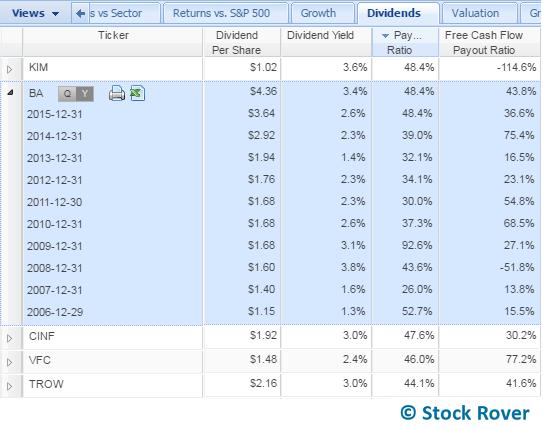
The table is an interactive and customizable spreadsheet where you can input individual tickers or data sets (such as a portfolio or watchlist) for direct comparison in hundreds of columns of financial data. To keep this wealth of data from becoming overwhelming, the columns are organized into themed “views” such as Growth, Dividends, and Historical Returns, which can be modified to your liking. Rows can be expanded to reveal historical data, as illustrated in Figure 1. The Navigation panel and Quotes box, to the left of the table, control what rows are displayed, while the selected view tab at the top of the table controls what columns are displayed.
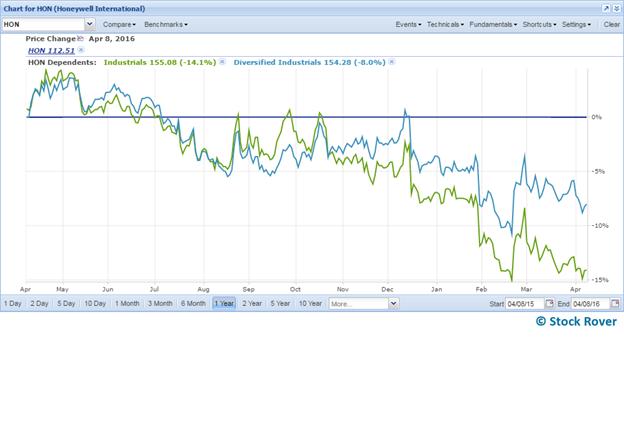
In the chart area of the interface you can see the performance of individual stocks, or whole sectors, portfolios, watchlists, and more, with or without dividends. A particularly popular feature is the Set as a Baseline option, which lets you set any charted item as a zero-line against which others are compared. For example, in Figure 2, you can see exactly how much Honeywell International (HON), set as a baseline in dark blue, has outperformed its sector and industry over a one-year period.
Comparison is even possible in the stock detail panel (called the Insight panel). In the Summary tab, the stock is compared with its industry and the S&P 500 index and in a variety of key metrics such as pricings-ratio ratio (P/E), operating margin and earnings per share (EPS) growth. In the Peers tab, there is a table similar to the main table that shows industry peers for the selected ticker so you can see where a stock falls within its industry on any metric of your choice (use the “Add Column” button to add to the displayed columns).
Screening
The screener found in Stock Rover’s Basic program provides the ability to screen all stocks in North American exchanges using over 250 metrics. You can see how many stocks pass your screener as you add criteria, and you can save the screener so that you can run it at the click of a button anytime.
The Premium service unlocks several additional screening tools. The foremost tool is ranking, which lets you distribute weight (up to 100%) among different metrics. For example, you could rank for a high return on invested capital (ROIC) or a low price-earnings ratio. The weighted criteria then generate a score and rank for stocks. You can also apply the weighted criteria to an existing portfolio or watchlist to see how those stocks score.
Another Premium feature is equation screening. Equation screening allows you to go beyond simple filters and construct equations that directly compare metrics to each other and to historical data. For example, you could look for stocks that have increased their dividend per share since last year.
For more detail on all of these methods, see the Stock Rover blog post 3 Ways to Screen for a GARP Stock.
Portfolio Tools
You can link Stock Rover to your brokerage for automatic portfolio syncing or you can manually update a portfolio, either by importing a common-separated value (CSV) from your brokerage or by simply updating the positions in Stock Rover’s portfolio editor. You can also easily create virtual portfolios to test ideas, which Stock Rover is currently doing with two strategy portfolios: Dividend Growers and Large Cap Capital Appreciation.
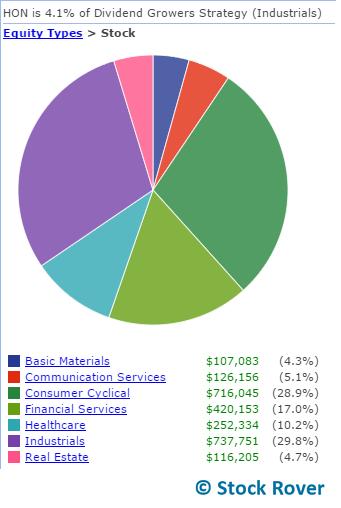
Once you have your portfolio(s) in Stock Rover, you have many options for tracking and analyzing performance. The table’s Portfolio Performance view gives an overview of, not surprisingly, portfolio performance. When any portfolio is selected in the table, you’ll find a portfolio allocation pie chart in the Summary tab of the Insight panel, as shown in Figure 3.
The Premium service provides a significant uplift in portfolio reporting and planning capabilities, adding three features that open in separate windows: Portfolio Analysis, Portfolio Rebalancing, and Trade Planning.
Portfolio Analysis
The Portfolio Analysis window offers a wide range of metrics for understanding and comparing portfolio performance and risk. It includes return on investment (ROI); internal rate of return (IRR), which is especially useful for a portfolio that has had a lot of inflows or outflows; the Sharpe ratio; risk-adjusted return; a correlation table; and performance details for individual holdings so you can see which holdings contribute the most (or least) to your total return.
Portfolio Rebalancing
Portfolio Rebalancing is another handy tool that makes it easy to get your portfolio back into balance after it has drifted. Enter your desired stock or sector balances—for example, to keep all holdings within a range of 3% to 5% of your total portfolio—and then Stock Rover will calculate what trades are necessary to achieve that balance.
Trade Planning
Similarly, the Trade Planning window allows you to enter possible trades and test their effect on your portfolio’s valuation, dividend yield, expected earnings per share and sector allocation. It also shows you how your portfolio would have performed had you made the trade in the past. Both Trade Planning and Rebalancing provide quick, clear insights into how certain trades will affect your portfolio as a whole.
Stock Rover Markets
While we are very proud of the depth and flexibility that Stock Rover brings to the marketplace, we recognize that most non-professional investors don’t need heavy-hitting stock comparison and portfolio planning on a daily basis. Therefore, we created Stock Rover Markets, which is designed for quick, frequent market check-ins and quotes, while still supporting deeper stock investigation. It provides much of the same data that you might find on other finance news sites, plus more, and it’s formatted in a clean, attractive way that is not burdened with distracting advertisements. It links with your Stock Rover account and is completely free to use.
Summary
Our company aims to enhance and support the stock research experience for investors of all stripes. In addition to our two stock research platforms, Stock Rover and Stock Rover Markets, we provide unbiased, in-depth investing content on our blog and in our webinars.
Discussion
FREE REPORT

No comments have been added yet. Add your thoughts to the discussion!
You need to log in as a registered AAII user before commenting.
Log InCreate an account