


Wayne Thorp leads a class in AAII's new Essential Investing Video Course. Go to https://www.aaii.com/ves for more information and to subscribe.
In the last installment of Technically Speaking, we introduced the McClellan Oscillator. This breadth indicator is derived from net advances, which is the number of advancing issues of an exchange or index less the number of declining issues. The McClellan Oscillator is the difference between the 19-day exponential moving average of net advances and the 39-day exponential moving average. Traders use the indicator as both as a momentum indicator and a measure of breadth.
This month, we look at another indicator that is based on the McClellan Oscillator, the McClellan Summation Index. Developed by Sherman and Marian McClellan, the McClellan Summation Index is also a breadth indicator based on net advances (advancing issues less declining issues). This time, however, we are looking at a running total of the McClellan Oscillator values. The oscillator fluctuates above and below zero. Traders can use the indicator to identify bullish and bearish divergences, directional movement, and centerline (zero) crossovers.
Calculation
The McClellan Summation Index is calculated as follows:
= Previous day’s Summation Index* + Current day’s McClellan Oscillator
* The very first Summation Index value is that period’s value of the McClellan Oscillator.
Keep in mind that the McClellan Summation Index is based on net advances, but this original indicator has gone through several manipulations to arrive at the Summation Index. In all, it takes three separate calculations to arrive at the McClellan Summation Index:
1. Calculate the 19-day exponential moving average (EMA) of net advances and the 39-day EMA of net advances
2. Calculate the McClellan Oscillator, which is the 19-day EMA of net advances less the 39-day EMA of net advances
3. Calculate the McClellan Summation Index, which is a cumulative McClellan Oscillator
Ratio-Adjusted Net Advances
One drawback of using net advances is that the total number of issues trading on an exchange such as the New York Stock Exchange (NYSE) or NASDAQ will change over time. One way to account for the dynamic nature of the total number of issues is to ratio-adjust net advances as a percentage of total advancing and declining issues. As we did for the previous article, we focus on ratio-adjusted net advances when calculating the McClellan Oscillator for use in the Summation Index.
Interpreting the McClellan Summation Index
Figure 1 shows the McClellan Oscillator and the McClellan Summation Index for the NASDAQ Composite Index for the six-month period ending August 22, 2014. As we can see from this chart, the Summation Index (top panel) rises when the McClellan Oscillator (bottom panel) is positive for an extended period. Between late May and early July, the McClellan Oscillator was above zero, except for a brief period in late June. During that same period, the Summation Index rose from roughly -550 to just over +300. Conversely, extended periods where the McClellan Oscillator is negative will cause the Summation Index to fall. From early-July until mid-August, the McClellan Oscillator was negative, and during that time the Summation Index fell from roughly +300 to below -400.
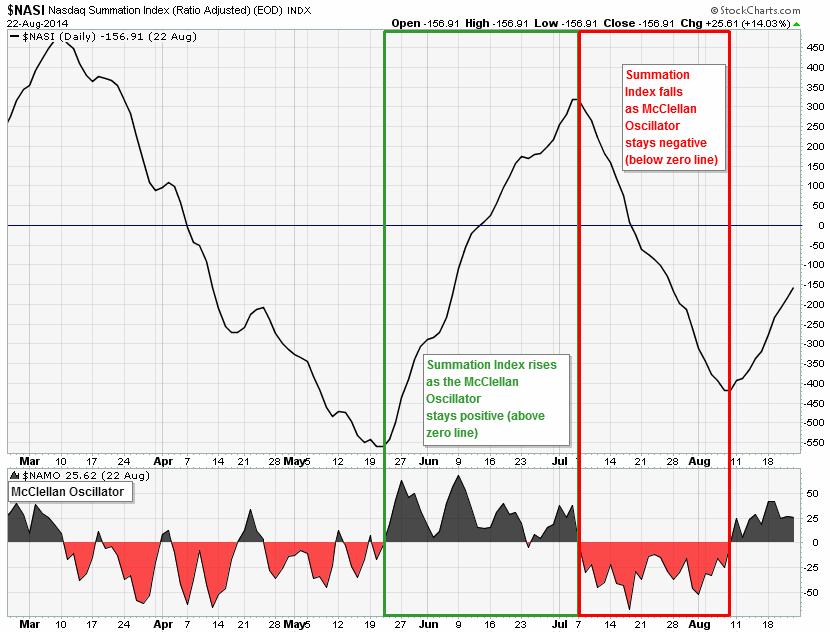
This chart also shows us that the Summation Index moves more slowly than the McClellan Oscillator, since it is cumulative in nature. Over this six-month period, the Summation Index crossed the zero line only three times—in early April, mid-June and mid-July. In contrast, the McClellan Oscillator crossed the zero line 16 times. The speed with which the McClellan Oscillator reacts to net advances data makes it better suited for short- and medium-term trading, whereas the Summation Index is typically used for medium- and long-term trading.
Summation Index signals take on three basic forms:
1. The Summation Index is bullish when positive and bearish when negative;
2. Bullish and bearish divergences between price and the Summation Index may augur reversals;
3. The direction of the Summation Index can be used to identify bullish or bearish biases in the underlying index
Negative Bias of NASDAQ Summation Index
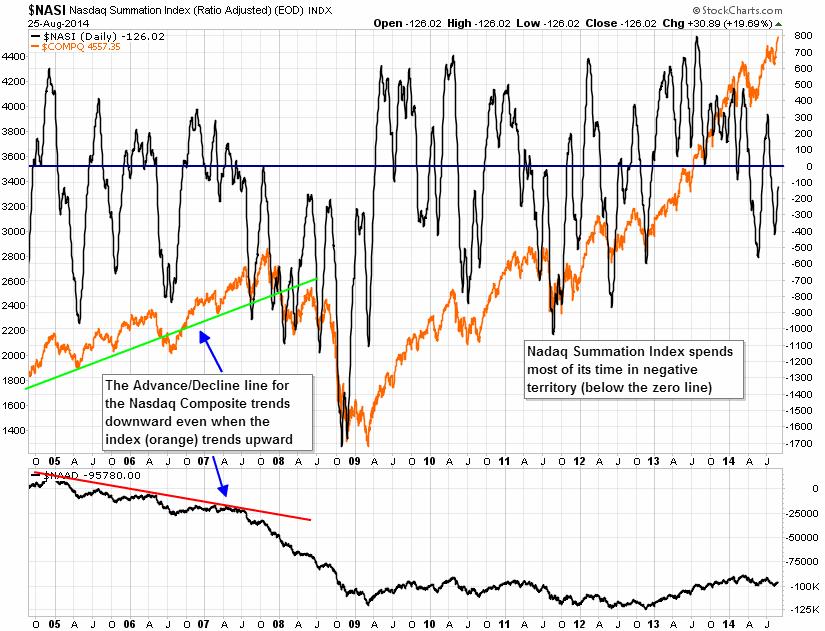
Before we start talking about how we can use the Summation Index, it is worth pointing out that the NASDAQ Summation Index has a long-term negative bias. This is illustrated in Figure 2, which is a 10-year daily chart of the NASDAQ Composite Index ($COMPQ, in orange in the top panel), the NASDAQ Summation Index ($NASI, in black in the top panel), and the NASDAQ cumulative advance/decline line ($NAAD, in black in the bottom panel). Here we see that, from late 2005 through late 2007, the NASDAQ Composite was in a general uptrend, yet during that same period the advance/decline line for the NASDAQ Composite was in a pronounced downtrend. In addition, even during prolonged upward movements in the NASDAQ Composite, the NASDAQ Summation Index spends most of its time in negative territory (below the zero line). Why is this? It stems from the NASDAQ having less stringent listing requirements than the NYSE. Furthermore, the NASDAQ tends to have more companies involved in cutting-edge technologies, which makes them more prone to failure. Companies that are near failure will see their stock prices fall, and while companies that fail are removed from an index, their negative impact on breadth measures such as the Summation Index remains.
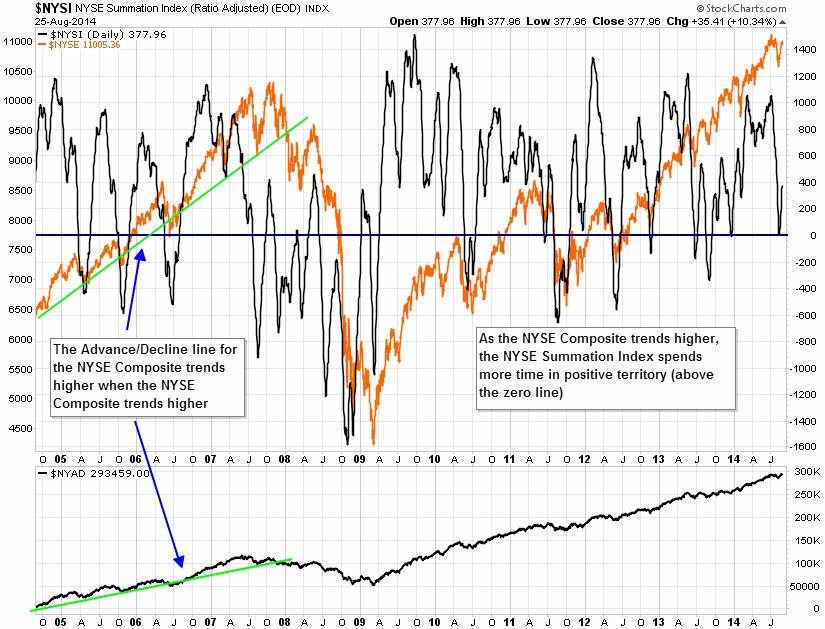
In contrast, Figure 3 shows the 10-year daily chart of the NYSE Composite Index ($NYSE, in orange in the top panel), the NYSE Summation Index ($NYSI, in black in the top panel), and the NYSE cumulative advance/decline line ($NYAD, in black in the bottom panel). Unlike what we saw in Figure 2, the advance/decline rises when the NYSE Composite is in a general uptrend between 2005 and 2007 and the NYSE Summation Index is generally positive during prolonged upward movements in the NYSE Composite.
Positive vs. Negative
We can use the McClellan Summation Index to identify bullish or bearish bias, based on whether the index is above or below the zero line. Remember that it takes prolonged moves by the underlying index to move the Summation Index. Therefore, the Summation Index will be positive only after the McClellan Oscillator has been mainly positive for an extended period of time. Again, this is why the Summation Index is better suited for medium- or long-term analysis.
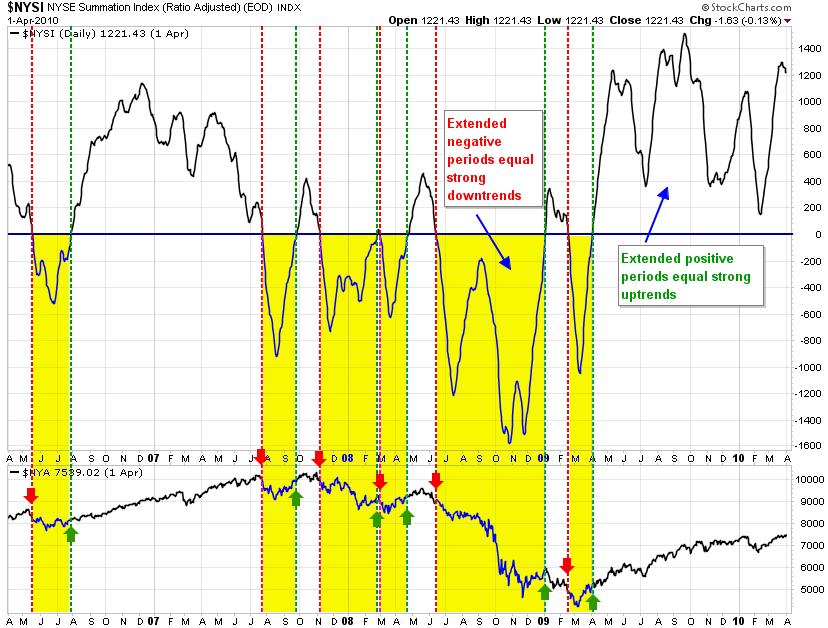
Figure 4 illustrates this point. Here we have a four-year daily price chart for the period ending April 1, 2010, for the NYSE Summation Index ($NYSI, in the top chart panel) and the NYSE Composite ($NYA, in the lower chart panel). The yellow highlighting indicates when the $NYSI went negative (below the zero line). Each time, the move was precipitated by a downward move in the NYSE Composite. The sustained negative values in the $NYSI from June through December 2009 coincided with a steep decline in the NYSE Composite. Likewise, the prolonged period of positive values in the $NYSI that began in April 2009 coincided with an extended uptrend in the NYSE Composite.
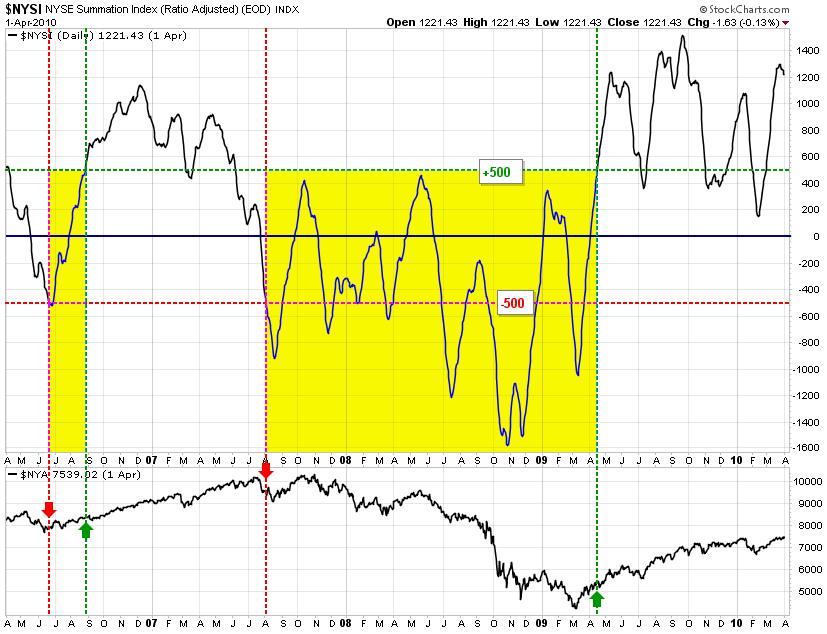
Traders also adjust the positive and negative thresholds used to denote bullish and bearish bias in an index. Figure 5 is again a four-year daily chart of the NYSE Summation Index and the NYSE Composite for the period ending April 1, 2010. However, instead of using the zero line as the indicator of bullish/bearish bias, we have moved the bearish threshold down to -500 and the bullish threshold up to +500. So now, a bullish signal is triggered when the Summation Index moves above +500, and it remains valid until the Summation Index falls to -500, thereby triggering a bearish signal. The bearish signal then remains valid until the index rises to +500. Making this type of adjustment to the bullish/bearish thresholds reduces the number of signals: in Figure 4 there were 12 signals using the zero line cross; using the +500/-500 thresholds, the number of signals dropped to four. Even then, however, the Summation Index is not infallible. In June 2006, the Summation Index dipped below -500 for four days, triggering a bearish signal. However, this whipsaw would have had you selling near the intermediate bottom of the NYSE Composite.
Directional Movement
Another way traders use the McClellan Summation Index is by applying a moving average to it in order to identify upturns and downturns. The length and type of moving average you use depends on your trading style and time horizon. Shorter moving averages will generate quicker signals, with the trade-off of potentially more whipsaws. A longer moving average will reduce the number of whipsaws, but will also lag, meaning the signals will be later.
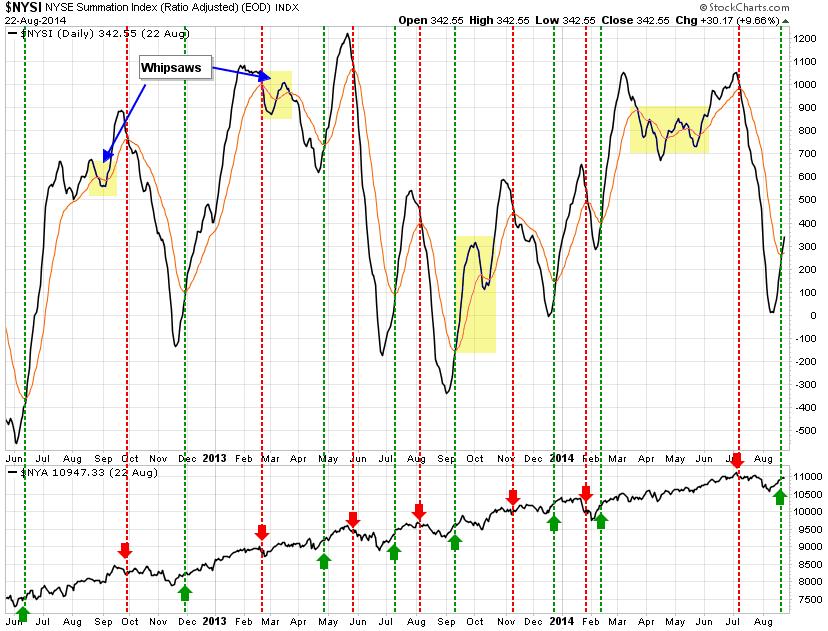
In Figure 6, we plotted 27 months of the daily NYSE Summation Index ($NYSI in black in upper panel), a 20-day exponential moving average of $NYSI (the orange line in the upper panel), and the NYSE Composite Index ($NYA, in the lower chart panel). A 20-day moving average is generally considered a medium-term moving average, compared to a short-term five-day moving average or a long(er)-term 50- or 200-day moving average. Over the 27 months, this moving average crossover system generated 15 signals. We did not include the whipsaws that were generated by the system, which we have highlighted in yellow.
Bullish & Bearish Divergences
The third way traders use the McClellan Summation Index is to identify divergences between the indicator and the underlying index. Divergences may foreshadow a reversal in the underlying index. A bullish divergence occurs when the Summation Index forms higher lows while the underlying index is forming lower lows. Likewise, a bearish convergence takes place when the Summation Index is forming higher lows while the underlying index is making lower highs. As the underlying index is moving lower, the Summation Index is showing improving breadth (it is rising).
A bearish divergence develops when the Summation Index is forming lower highs while the underlying index is forming higher highs. Bullish convergences are also indicated by the Summation Index making lower highs while the underlying index is making higher lows. Here, the underlying index may be moving higher but the Summation Index is showing declining breadth by moving lower.
It is important to keep in mind that not all apparent divergences lead to a reversal in the underlying index. In addition, the degree of magnitude of the reversal can also vary greatly. Generally speaking, the longer it takes for the divergence to form, the more likely it is that a reversal will take place. Finally, bearish divergences that form in the middle of a strong uptrend in the index are more likely to fail, as are bullish divergences that form in a strong downtrend.
Figure 7 shows a daily chart of the NASDAQ Summation Index ($NASI, in black in the upper panel), a 20-day exponential moving average of $NASI (the orange line in the upper panel), and the NASDAQ Composite ($COMPQ in the lower chart panel) from the start of 2008 through the end of June 2010.
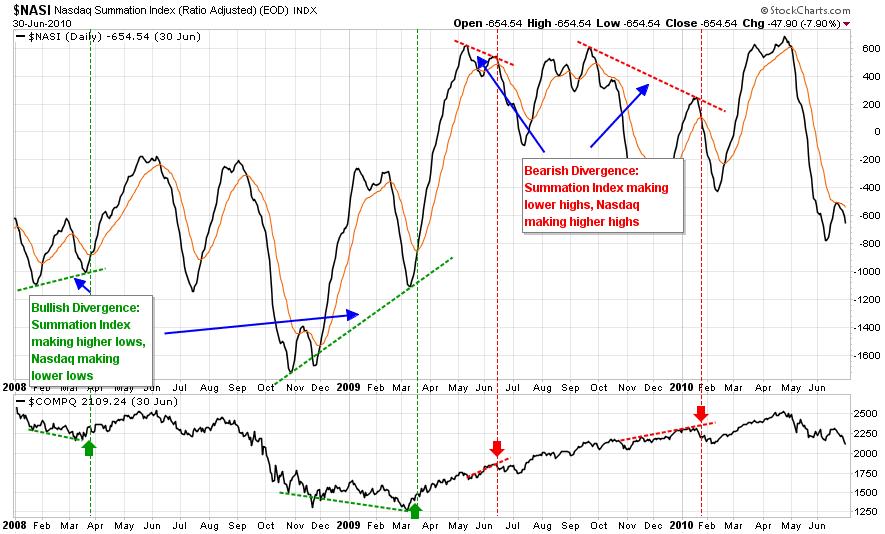
Over the period, we identified two bullish divergences and two bearish divergences. The first bullish divergence took place between January and March 2008. From the chart we see the Summation Index made two higher intermediate lows while the NASDAQ Composite was making a series of lower intermediate highs. The vertical green dotted line in late March indicates where the Summation Index crossed above the 20-day exponential moving average, a confirming bullish signal. After this divergence took place, the NASDAQ Composite entered a two-month uptrend. The second bullish divergence developed during the tail end of the market collapse of the Great Recession of 2008-2009. Between October 2008 and March 2009, the Summation Index made two higher lows while the NASDAQ Composite made two lower intermediate highs. In mid-March, the Summation Index crossed above its 20-day exponential moving average, offering bullish confirmation. This took place less than two weeks after the market bottom of March 9, 2009.
The two bearish divergences in Figure 7 developed in the midst of the prolonged market rebound that started in early March 2009. As we noted earlier, this increases the likelihood of the divergence failing. The first bearish divergence developed between May and June 2009, as the Summation Index made a subsequent lower intermediate high while the NASDAQ Composite made a subsequent higher intermediate low. The bearish crossover by the Summation Index of the 20-day exponential moving average confirmed the divergence (as indicated by the red vertical line), and the NASDAQ Composite moved marginally lower over the next several weeks. The second bearish divergence developed shortly thereafter, between September 2009 and January 2010. Again, the Summation Index made a lower intermediate high while the NASDAQ Composite made a higher intermediate low. After the bearish crossover of the 20-day exponential moving average by the Summation Index, the NASDAQ Composite trailed downward for a couple of weeks. In the end, however, neither bearish divergence foreshadowed an extended downward reversal of the underlying index.
Conclusion
Over the last two Technically Speaking columns, we have shown you how you can use net advancing issues in your trading. We started by taking the 19-day and 39-day exponential moving averages (EMA) of net advances and arrived at the McClellan Oscillator by deducting the 39-day EMA of net advances from the 19-day EMA. This time around, we took a cumulative McClellan Oscillator to arrive at the McClellan Summation Index. This indicator may be used in three ways: you can use it to identify bullish or bearish levels in an underlying index; by applying a moving average to the Summation Index, you may identify upturns or downturns in the underlying index; or you can use it to identify bearish or bullish divergences that may signal reversals in the underlying index. However, as is always the case when performing technical analysis, it is a good idea to look for confirming signals from other indicators. No single indicator is correct all of the time.
Discussion
FREE REPORT

Jackie McClellan from IL posted over 12 years ago:
You need to log in as a registered AAII user before commenting.
Log InCreate an account