


Wayne Thorp leads a class in AAII's new Essential Investing Video Course. Go to https://www.aaii.com/ves for more information and to subscribe.
You don’t need to be a math genius to understand that successful investing consists of buying low and selling high.
Accomplishing this feat, however, depends a great deal on the strategy and tactics one uses. Numerous studies have shown that value-oriented investing has been better at this than most other strategies over the long term.
Value investors believe that, while the market may be efficient in the long term, emotions often dictate market prices in the short term. These emotions can overtake rational analysis, pushing a stock’s price above its intrinsic value during periods of “irrational exuberance” and below its true worth in reaction to bad news. In addition, the market sometimes ignores many companies, which also leads to mispricings. Value investors seek to profit from these mispricings. However, it is imperative to have discipline when following a contrarian, value-oriented investment approach.
Value screens, such as a price-earnings-ratio screen, typically look for low prices relative to actual measures of company performance.
A simple search for low price-earnings ratios, however, can be a misleading screen for undervalued stocks. Typically, firms with a high growth potential trade at high price-earnings ratios, while those with low growth potential trade at low price-earnings ratios. A screen that simply seeks stocks with low price-earnings ratios may leave you with a list of companies that have little or no growth prospects or stocks concentrated in industries with low price-earnings ratios.
One of the most popular techniques to search for both value and growth centers around stocks with low price-earnings ratios relative to their earnings growth rates. The price-earnings-to-growth ratio—popularly known as the PEG ratio—is computed by dividing the price-earnings ratio by the earnings per share growth rate. The rule of thumb is that ratios below 1.0 indicate that a stock may be undervalued, while stocks with ratios above 1.0 may be overvalued. The idea is to purchase a stock with some demonstrated earnings growth before the market recognizes the company’s potential and bids up the price-earnings ratio.
Stock Investor Pro—AAII’s fundamental stock screening program and research database—includes two built-in screens that seek potential value companies that are exhibiting a level of price momentum.
What It Takes: Value on the Move Criteria
|
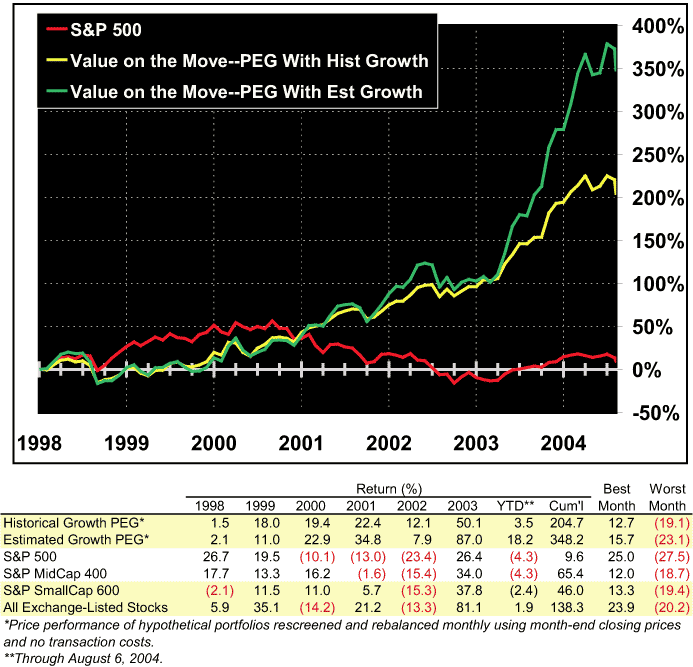
The companies passing the two Value on the Move/PEG screens have been reported and tracked on the AAII Web site for over seven years, with results that far outpace the broad market indexes.
Figure 1 shows that the stocks passing both the historical growth and estimated growth PEG ratio screens have surpassed the performance of the S&P 500 index since December of 1997, as well as the MidCap 400 and SmallCap 600 indexes.
Overall, the Historical Growth PEG Ratio screen has generated a cumulative return of 204.7% over the period of December 31, 1997 to August 6, 2004, while the Estimated Growth PEG Ratio screen has returned 348.2% over the same period. Note that this performance does not include transaction costs or dividend payments/reinvestments.
Interestingly, until April 2003, the two strategies generated similar returns. Since then, however, a tremendous divergence has taken place.
| Table 1. Value on the Move Screen Portfolio Characteristics | |||
| Portfolio Characteristics | PEG Ratio |
Exchange- Listed Stocks |
|
| Hist Grth |
Est Grth |
||
| Price-earnings ratio | 17.4 | 16.2 | 18.4 |
| Price-to-book-value ratio | 3.0 | 2.5 | 1.9 |
| EPS 5-yr. historical growth rate | 29.5% | 21.8% | 7.6% |
| EPS 3-5 yr. estimated growth rate | 15.4% | 17.0% | 14.3% |
| PEG ratio (hist EPS growth) | 0.6 | 0.7 | 1.1 |
| PEG ratio (est EPS growth) | 1.2 | 0.9 | 1.3 |
| Market cap (million) | $1,210.2 | $1,400.5 | $310.0 |
| Relative strength vs. S&P; 500 | 31.5% | 38.0% | 5.0% |
| Monthly Observations | |||
| Average no. of passing stocks | 102 | 49 | |
| Highest no. of passing stocks | 216 | 138 | |
| Lowest no. of passing stocks | 11 | 10 | |
| Monthly turnover | 37.2% | 46.4% | |
| Data as of August 6, 2004. | |||
The characteristics of all the stocks passing the two Value on the Move screens are presented in Table 1.
The screens’ value orientation is evident in the median price-earnings ratios for those companies currently passing both the Historic Growth PEG and Estimated Growth PEG screens. The price-earnings ratio for the historical growth PEG universe is 17.4, versus 16.2 for the estimated growth PEG universe. Compare this to the price-earnings ratio of 18.4 for all exchange-listed stocks.
The median market capitalizations of companies passing the Historical Growth PEG screen ($1,210.2 million) as well as the median for the Estimated Growth PEG screen ($1,400.5 million) surpass that of the median for exchange-listed companies ($310.0 million).
Value screens are good at identifying neglected firms, but secondary screens for earnings growth are helpful in identifying stocks that are either poised for or are participating in an upturn. The median historical long-term earnings growth rate for companies passing the Historical Growth PEG screen is 29.5%, compared to 21.8% for those passing the Estimated Growth PEG screen. The median value for all exchange-listed stocks is 7.6%.
As we have shown, the companies that have passed the two Value on the Move PEG screens have been able to outperform the market over the last several years. Additionally, Table 1 shows that the current passing companies have outperformed the market before passing the screen. The Historical Growth PEG companies have outperformed the S&P 500 by 31.5% and the Estimated Growth PEG companies have outpaced the S&P by 38.0%. In contrast, exchange-listed stocks have outperformed the index by only 5.0%.
Table 2 lists the 10 companies for both the Historical Growth PEG and Estimated Growth PEG screens that have the highest 26-week relative strength ranks as of August 6, 2004.
For both groups, the companies are ranked in descending order by their 26-week relative strength rank.
Historically, an average of 102 companies have passed the Historical Growth PEG screen and 49 passed the Estimated Growth PEG screen (Table 1). Specific criteria for the two screens are listed in the What It Takes box on page 51.
The cornerstone of the strategy is that, for both screens, the PEG ratio is less than or equal to 1.0 and is greater than 0.2. From the list in Table 2, Air T, Inc. and BP Prudhoe Bay Royalty Trust have the lowest historical growth PEG ratio in their group at 0.4, while Valero Energy Corp., a fuel refining and marketing firm, has the lowest estimated growth PEG ratio in its group at 0.4.
The two Value on the Move screens also require that firms have positive earnings for each of the last five fiscal years, and that each of the last four fiscal quarters’ earnings per share be higher than the same quarter one year earlier. When comparing the companies passing the two PEG screens, we see that the Historical Growth PEG screen companies as a whole have a higher median historical earnings growth rate (29.5%) than that of the Estimated Growth PEG companies (21.8%). Leading the way for the historical growth screen is Trend Micro Incorporated—a maker of antivirus and Internet security software—at 84.4%.
However, it is important to consider the base number when examining growth rates. It is much easier for a firm to have a very large growth rate when the starting point is low. Trend Micro has increased its earnings per share from $0.03 to $0.64.
On the flipside, the median estimated growth rate in earnings for the companies passing the Estimated Growth PEG screen surpasses that of the Historical Growth PEG screen, 17.0 to 15.4. Only five of the 10 companies passing the Historical Growth PEG screen and listed in Table 2 have a reported estimated growth rate in earnings. This would lead us to speculate that the companies passing the Historical Growth PEG screen have less of an analyst following than those companies passing the Estimated Growth PEG screen.
While the two Value on the Move screens require that companies have a 26-week relative price strength rank in the top 70% of the entire database, current market price as a percentage of the 52-week high price is another popular price momentum indicator. If a firm’s stock price continues to be strong, it should be trading near its 52-week high. As a group, the companies passing the Historical Growth PEG ratio screen are exhibiting slightly stronger price momentum, with a median price-as-a-percentage-of-52-week-high figure of 89, compared to 87 for those companies passing the Estimated Growth PEG screen. Both Tom Brown, Inc., a natural gas exploration and production company, and Community Bancorp, Inc., a bank holding company, have latest prices that are at their 52-week high. (Note: It has been announced that Unit Company has agreed to acquire Tom Brown.)
Value screens attempt to identify undervalued stocks. However, patience is required while waiting for the market to recognize the value of a stock. In fact, one of the greatest risks of value investing is that the market never realizes the value and the price continues to languish. Combining value with price and earnings momentum screens should help identify reasonably priced stocks that are on the move. However, keep in mind that the purpose of these screens is to illustrate, with real firms, a potential useful combination of value and momentum analysis. Stock screening is merely a first step in the stock selection process. You should not view those companies that pass a screen as a buy list. Instead, they should serve as a stepping-off point from which you perform additional due diligence before committing your investment dollars.
| Table 2. Value on the Move Firms | |||||||||
| Company (Exchange: Ticker) | PEG Ratio |
Current P/E Ratio (X) |
EPS Growth Rate |
EPS Growth Rate Q5 to Q1* (%) |
Relative Strength Rank 26-Wk (%) |
Price as % of 52-Wk High (%) |
Description | ||
| Hist Grth (X) |
Est Grth (X) |
||||||||
| Hist (%) |
Est (%) |
||||||||
| Historical Earnings Growth PEG | |||||||||
| Air T, Inc. (M: AIRT) | 0.4 | 13.9 | 33.3 | 57.9 | 98 | 53 | air cargo carrier | ||
| BP Prudhoe Bay Royalty Trust (N: BPT) | 0.4 | 13.6 | 30.4 | 21.4 | 96 | 92 | oil royalties | ||
| Tom Brown, Inc. (N: TBI) | 0.8 | 2.2 | 20.5 | 27.0 | 7.7 | 71.7 | 96 | 100 | oil & gas |
| San Juan Basin Royalty Trust (N: SJT) | 0.5 | 13.3 | 24.8 | 4.8 | 94 | 88 | oil royalties | ||
| Trend Micro Incorporated (M: TMIC) | 0.5 | 44.5 | 84.4 | 92.0 | 94 | 86 | antivirus software | ||
| United Fire & Casualty (M: UFCS) | 0.7 | 0.7 | 11.5 | 17.3 | 13.0 | 65.4 | 94 | 96 | prop, cas & life ins |
| CB Bancshares, Inc. (M: CBBI) | 0.5 | 11.8 | 22.4 | 144.1 | 93 | 97 | bank holding co | ||
| Penn National Gaming, Inc. (M: PENN) | 0.5 | 1.1 | 21.0 | 39.1 | 15.5 | 26.5 | 93 | 94 | gaming props |
| SFBC International, Inc. (M: SFCC) | 0.6 | 1.0 | 25.3 | 47.9 | 23.3 | 38.9 | 93 | 79 | contract research servs |
| Aeropostale, Inc. (N: ARO) | 0.5 | 0.9 | 28.8 | 55.2 | 23.9 | 175.0 | 92 | 91 | teen apparel |
| Median for Top 15 Value Movers | 0.5 | 1.1 | 19.5 | 33.3 | 15.0 | 53.8 | 93 | 90 | |
| Median for All Hist Growth PEG Screen Firms | 0.6 | 1.2 | 17.4 | 29.5 | 15.4 | 31.6 | 83 | 89 | |
| Estimated Earnings Growth PEG | |||||||||
| United Fire & Casualty (M: UFCS) | 0.7 | 0.7 | 11.5 | 17.3 | 13.0 | 65.4 | 94 | 96 | prop, cas & life ins |
| Mandalay Resort Group (N: MBG) | 1.1 | 1.0 | 22.7 | 21.8 | 16.9 | 83.3 | 93 | 92 | hotel-casino operator |
| SFBC International, Inc. (M: SFCC) | 0.6 | 1.0 | 25.3 | 47.9 | 23.3 | 38.9 | 93 | 79 | contract research servs |
| Aeropostale, Inc. (N: ARO) | 0.5 | 0.9 | 28.8 | 55.2 | 23.9 | 175.0 | 92 | 91 | teen apparel |
| Old Dominion Freight Line (M: ODFL) | 1.4 | 1.0 | 19.4 | 13.9 | 16.0 | 59.3 | 91 | 88 | motor carrier |
| Penn Virginia Corporation (N: PVA) | 0.9 | 0.5 | 18.8 | 21.1 | 37.0 | 9.8 | 91 | 87 | minerals, oil, gas, coal, timber |
| Valero Energy Corp. (N: VLO) | 0.1 | 0.4 | 7.6 | 53.0 | 15.5 | 337.5 | 91 | 86 | environ clean fuel prods |
| XTO Energy Inc. (N: XTO) | 0.5 | 0.6 | 17.9 | 37.5 | 19.3 | 57.7 | 91 | 84 | oil & gas |
| American Dental Partners (M: ADPI) | 1.9 | 0.8 | 16.3 | 7.6 | 15.0 | 75.0 | 90 | 84 | dental practice manage servs |
| Community Bancorp Inc. (M: CMBC) | 0.6 | 1.0 | 16.0 | 26.8 | 15.0 | 34.4 | 90 | 100 | small business admin loans |
| Median for Top 15 Value Movers | 0.9 | 0.8 | 17.9 | 21.1 | 16.9 | 59.3 | 91 | 87 | |
| Median for All Est Growth PEG Screen Firms | 0.7 | 0.9 | 16.2 | 21.8 | 17.0 | 47.6 | 85.5 | 87 | |
|
*Growth rate in earnings per share for most recent quarter compared to same
quarter a year ago.
Exchange Key:
Statistics are based upon figures as of August 6, 2004. For an expanded list of stocks passing these screens, go to the Stock Screens area of AAII.com. |
|||||||||
Wayne A. Thorp, CFA, is financial analyst at AAII and associate editor of Computerized Investing.
Discussion
FREE REPORT

No comments have been added yet. Add your thoughts to the discussion!
You need to log in as a registered AAII user before commenting.
Log InCreate an account