


Wayne Thorp leads a class in AAII's new Essential Investing Video Course. Go to https://www.aaii.com/ves for more information and to subscribe.
Technical analysis, in broad terms, is the analysis of historical price and volume data to help identify trends that may predict future price movements. Technicians use technical indicators and charts in their analysis. Technical indicators are mathematical manipulations of price and/or volume data, whereby trends in the values or extreme maximum or minimum values of these indicators are monitored. With chart analysis, we are often looking for specific patterns that may indicate future price behavior. In this installment of Technically Speaking, we discuss the cup-with-handle pattern.
Overview
The cup-with-handle pattern was developed by William O’Neil, the founder of Investor’s Business Daily and developer of the CAN SLIM investment approach, which uses both fundamental and technical analysis to identify potential investment opportunities. O’Neil introduced the cup with handle in his 1988 book, “How to Make Money in Stocks.” The book is now in its fourth edition (McGraw-Hill, 2009).
As with most chart patterns, the cup-with-handle pattern derives its name from the way it appears on a stock chart: A well-formed cup-with-handle pattern resembles the profile of a coffee cup. However, the cup with handle pattern is preceded by a strong upward move, which eventually loses steam. At that point, a sell-off takes place and prices move sideways for an extended period of time. This is where the cup with handle pattern develops. The pattern consists of two distinct parts: the cup and the handle. The left side of the cup is a downtrend correcting the previous price advance. Eventually, a bottom forms and prices once again begin to advance, forming the right side of the cup. In a cup-with-handle pattern, prices will rebound to a level near the high of the left side of the cup, completing the cup shape.
This price rebound on the right side of the cup, however, will lose momentum as those who bought at the cup’s bottom start taking profits when the price nears the highs of the left side of the cup. Also, those who bought near the previous highs are anxious to cut their losses, so they add to the selling pressure, causing the rally from the cup’s bottom to stall.
Following the formation of the cup, prices make a relatively smaller downward move, often forming a trading range on the right side of the cup, which is the handle. Volume should dry up in this phase, indicating a lack of selling pressure. As a result, prices should only fall into the upper half or third of the cup. A handle where prices fall lower than that indicates that there are still enough sellers to prevent a meaningful move to the upside, which is needed for the pattern to complete itself. During the handle formation, new buyers step in to support the stock.
Eventually, this inflow of buyers will cause a breakout from the handle’s trading range, signaling that the pattern formation is compete and the prior advance continues. For this reason, the cup with handle is considered a bullish continuation pattern.
Components
As the cup with handle develops, there are several components to monitor to see whether or not this is a valid pattern.
- Trend: As mentioned, the cup with handle is a bullish continuation pattern. Therefore, a prior uptrend should exist. Ideally, the trend should be a few months old, but not too mature. According to O’Neil, prices should have advanced at least 30% from the last intermediate low. However, the more mature the trend and the greater its magnitude, the less chance that the pattern marks a continuation or the less upside potential.
- Cup: The cup should be “U” shaped and resemble a bowl or rounding bottom. A “V” shaped bottom would be considered too sharp of a reversal to qualify. The softer “U” shape ensures that the cup is a consolidation pattern with valid support at the bottom of the “U.” In addition, an ideal pattern will have roughly equal high prices on both sides of the cup, but this is not always the case.
-
Cup Depth: Ideally, the depth of the cup should retrace 1/3 or less of the previous advance. However, with volatile markets and overreactions, the retracement could range from 1/3 to 1/2. In extreme situations, the maximum retracement could be 2/3. For example, if the previous upward trend sent prices from $20 to $40, the depth or height of the cup should be at least
$6 [($40 - $20) × 33%] and at most $13 ($20 × 66%). - Handle: After the high forms on the right side of the cup, there is a pullback that forms the handle. This handle may resemble a flag or pennant that slopes downward; other times it is just a short pullback. The handle represents the final consolidation/pullback before the big breakout and can retrace up to 1/3 of the cup’s advance, but usually not more. The smaller the retracement, the more bullish the formation and more significant the breakout. A breakout above the resistance line established by the highs of the cup is considered the confirmation of the pattern.
- Duration: The cup can extend from one to six months, sometimes longer on weekly charts. The handle, ideally, completes within one to four weeks.
- Volume: Like many chart patterns, volume is an important confirmation of the pattern itself and its signal. There should be a “substantial” increase in volume on the breakout above the handle’s resistance. If there is not an increase in volume on the breakout, the likelihood that the continuation continues is reduced. The spike in volume at breakout is added confirmation that the continuation has validity.
- Target: The projected advance in price after breakout can be estimated by measuring the distance from the right peak of the cup to the bottom of the cup. So if the depth or height of the cup is $20, the initial price target following the handle breakout would be $20 above that resistance level.
Example Using DISH Network
Figure 1 is an example of the cup-with-handle pattern. This weekly chart is for DISH Network Corp. (DISH) from June 2011 through December 2012.
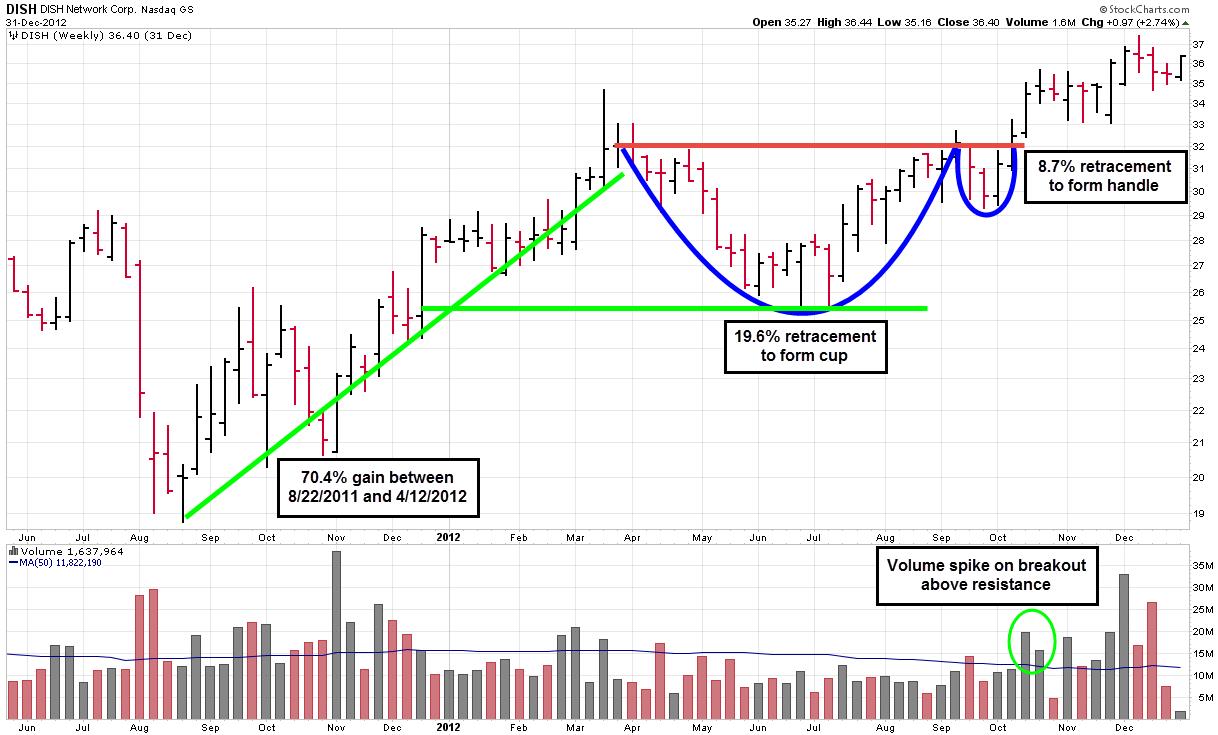
Between August 2011 and March 2012, DISH shares gained roughly 70%, reaching a high closing price of $32.67 on April 2, 2012. From there, the stock begins its pullback, forming the left side of the cup.
For most of May, June and July, DISH consolidates, trading in a roughly $3 range between $25 and $28. The bottom of the cup forms on June 25, 2012, when the price closes at $26.26. As we see on the price chart, a “U” shape forms from this trading activity. In addition, the volume bars below the price chart also show that trading volume was below average. During this time, weekly trading volume is below the blue moving average volume line.
In mid-July, shares gain some strength. At this point, buying pressure outweighs selling pressure. As the stock price rises, the right side of the cup forms. On September 13, 2013, the price reaches a high close of $32.25, nearly identical to the $32.67 high of the left side of the cup.
Prices once again retreat, forming the handle. On October 1, 2012, prices bottom out with a close at $29.44, which is nearly 9% below the high of the right side of the cup. Because the retracement of the handle was less than one-third of the cup, the possibility of a bullish outcome still exists.
Four weeks after the right side of the cup was formed, the price breaks above the resistance line drawn between the highs that formed the two sides of the cup. We also see that there is a spike in trading volume above the average volume line, adding confirmation to the pattern completion.
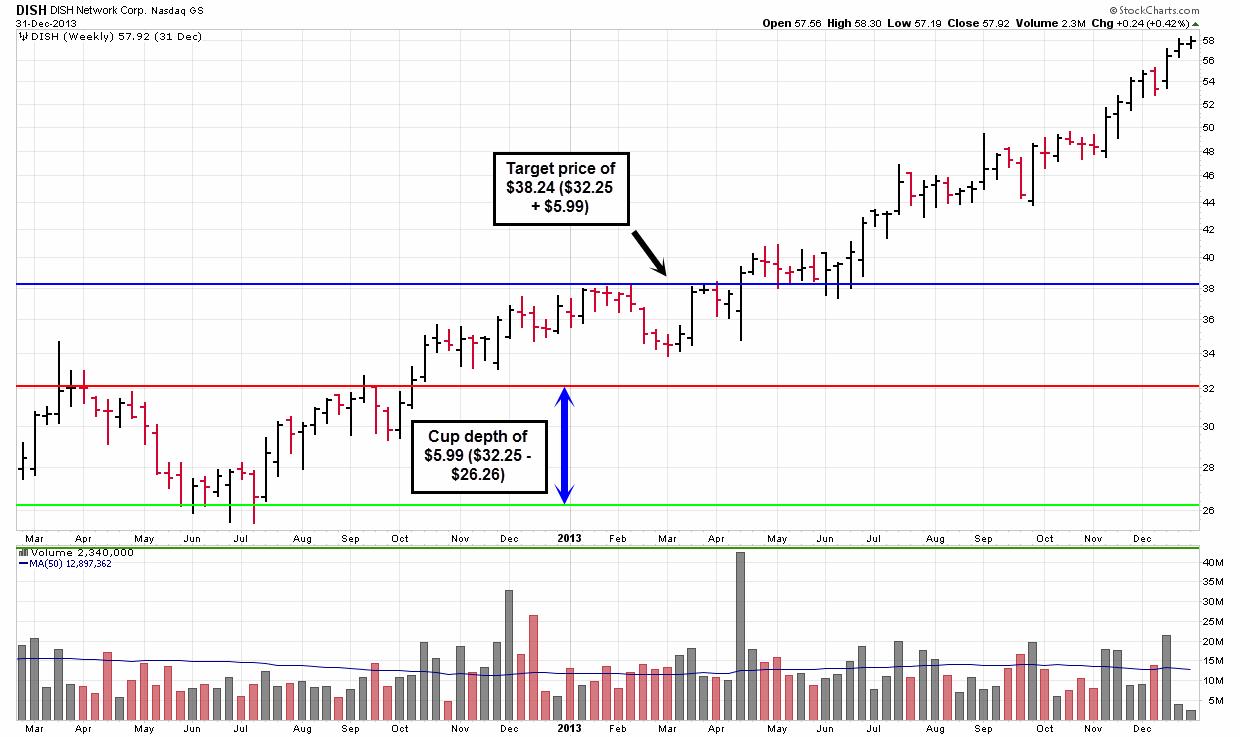
Figure 2 shows a continuation of the weekly price chart for DISH Network from Figure 1. The depth of the cup was nearly $6, which was the difference between the high of the right side of the cup ($32.25) and the bottom of the cup ($26.26). Therefore, the target price once the price breaks through the handle’s resistance line is $32.25 + $5.99. On April 18, 2013, the price closed above this target price of $38.24. Eventually, the price would continue upward a total of 146.2% from the high of $32.25 on the right side of the cup.
Signs of a Questionable Pattern
As is the case with all chart patterns, you will run across instances when a cup-with-handle pattern appears, yet the expected results do not carry through. Some of the more common warning signs that a cup-with-handle pattern will not ultimately carry through include:
- A poorly-formed cup that is too deep over a short period, giving it a “V” shape
- A cup with price retreat of more than 50% from the high of the left side
- A handle that falls too far into the cup—into the lower half
- A lack of volume confirmation at the breakout
Conclusion
In the short term, individual securities and the overall market are driven largely by investor emotions. Chart patterns, most of which are short-term in nature, capture this investor psychology. They reflect the fact that, when faced with similar situations or circumstances, investors will behave in the same manner again and again.
The cup-with-handle pattern, like many chart patterns, can provide investors insight for a myriad of investment decisions, including when to enter, the direction in which to trade and, potentially, when to exit a trade. However, diligence is required to make sure that the pattern you think is forming actually does follow through. For this reason, it is highly recommended to study the mechanics of various chart patterns before risking actual capital. Once you become more versed in these techniques, they could become a useful addition to your investment strategy.
Discussion
FREE REPORT

Ellen Platamone from AZ posted over 10 years ago:
You need to log in as a registered AAII user before commenting.
Log InCreate an account