They won’t be obvious. When looking for the top-performing stocks of the next five or 10 years, you shouldn’t look at the Microsofts or Wal-Marts of the stock universe.
Instead, you need to look at stocks that have yet to cross the radar of most investors: mainly small-cap stocks. Unfortunately, for every small-cap to large-cap success story, there are many others that fail to survive. As a result, many individual investors deem small-cap stocks too risky for their portfolios.
But there is an important reason not to ignore this market segment: Small-cap stocks do not garner much attention from analysts or institutional investors. As a result, they provide a unique opportunity for individual investors to venture into an area of the market that is neglected by larger investors.
Several years ago, the founders of the Motley Fool Web site derived a method for seeking out small-cap companies. The resulting strategy, dubbed the Foolish 8, attempts to isolate profitable, rapidly growing small-cap companies whose stock the market as a whole has yet to discover.
Foolish Small Cap 8 Screen
The screen Tom and David Gardner created attempts to locate potential growth companies instead of growth stocks. They began with a universe of companies with annual sales of less than $500 million and applied a series of both market- and business-related factors, including:
- Historical sales and earnings growth;
- Net profit margin;
- Operating cash flow;
- Insider ownership;
- Daily dollar trading value;
- Share price; and
- Relative price strength.
Using Stock Investor Pro, AAII’s fundamental stock screening and research database, we created a screen based on the Gardners’ Foolish 8 approach. You will find the exact criteria for this screen at the end of this article.
Screen’s Performance
On a monthly basis, AAII.com lists the companies passing the Foolish Small Cap 8 screen and tracks the performance of these stocks in a hypothetical portfolio.
Figure 1.
Performance of
Foolish Small
Cap 8 Screen
|
|
CLICK ON IMAGE TO
SEE FULL SIZE.
|
|
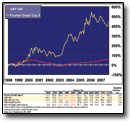
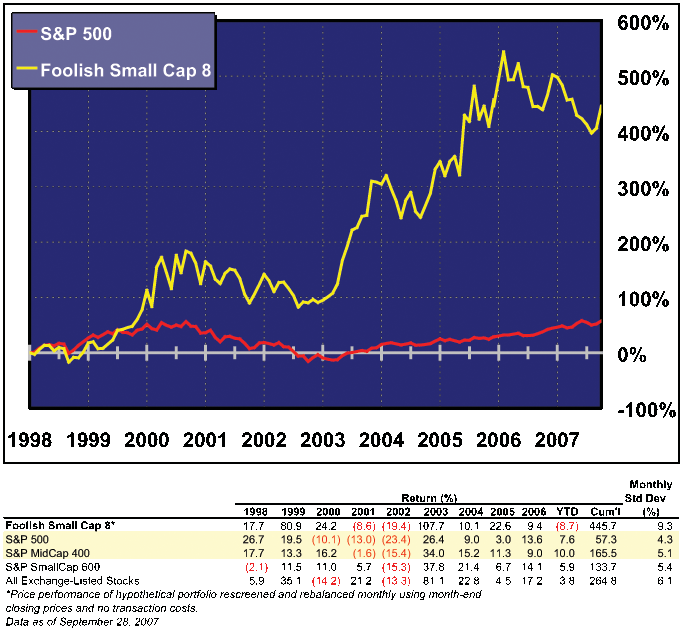
Figure 1 illustrates that the Foolish Small Cap 8 screen has outperformed the overall market since the beginning of 1998. In fact, between January 1998 and the end of September 2008, the Foolish Small Cap 8 screen returned 445.7% while the S&P; 500 generated a return of 57.3% over the same period.
Profile of Passing Companies
Table 1 presents the characteristics of the companies passing the Foolish Small Cap 8 screen as of October 5, 2007.
The Foolish 8 screen seeks companies that have had sales and earnings growth of at least 25% over the trailing 12 months and rank in the top 10% of the stock universe in terms of relative price strength. Inevitably, such requirements will lead to results with high valuations.
| Table 1. Foolish Small Cap 8 Portfolio Characteristics
|
| Portfolio Characteristics (Median) |
Foolish Small Cap 8 Stocks |
Exchange-Listed Stocks |
| Price-earnings ratio (X) |
30.8 |
19.5 |
| Price-to-book-value ratio (X) |
5.91 |
2.14 |
| Price-to-sales ratio (X) |
5.68 |
1.94 |
| PE-to-EPS est growth (X) |
1.80 |
1.50 |
| EPS 5-yr. historical growth rate (%) |
27.7 |
15.5 |
| EPS 3-5 yr. estimated growth rate (%) |
22.5 |
14.9 |
| Market cap. ($ million) |
425.5 |
499.6 |
| Relative strength vs. S&P (S&P;=0) (%) |
90 |
–4 |
| Monthly Observations |
| Average no. of passing stocks |
23 |
|
| Highest no. of passing stocks |
62 |
|
| Lowest no. of passing stocks |
6 |
|
| Monthly turnover (%) |
35.7 |
|
The stocks currently passing the Foolish Small Cap 8 screen have a lofty median price-earnings ratio of 30.8, compared to the median P/E for exchange-listed companies of 19.5.
The same is true for two other popular value measures—price-to-book-value ratio and price-to-sales ratio. In both instances, the Foolish 8 companies have significantly higher values than the typical exchange-listed stock.
While the Foolish Small Cap 8 screen only looks at earnings growth over the last 12 months, the current group of passing companies has an impressive five-year earnings growth rate of 27.7%. By comparison, the median five-year earnings growth rate for exchange-listed companies is 15.5%.
Looking forward, analysts do not expect the stellar growth of these companies to continue, as they have a median forecasted earnings growth rate of 22.5%. However, this still outpaces the growth rate expectation for exchange-listed stocks, which is 14.9%.
The screen the Gardner brothers created uses annual sales as a proxy for company size, capping it at $500 million. The median market capitalization for the current Foolish 8 companies—$425.5 million—places them firmly in the small-cap universe. By comparison, the median market cap for exchange-listed stocks is almost $500 million.
Since the Foolish Small Cap 8 screen requires passing companies to be in the top 10% of the stock universe in terms of relative price strength, it is no surprise that the current group of passing companies has outperformed the S&P; 500 by 90% over the last 52 weeks. At the same time, the typical exchange-listed stock has underperformed the S&P; by 4% over the same period. However, be aware that strong past performance does not guarantee the same results going forward, as the Foolish Small Cap 8 screen has generated a monthly compounded return of only 1.2% over the last 12 months while the S&P; 500 has generated a 14.3% return.
Passing Companies
Table 2 lists the 17 companies that passed the Foolish Small Cap 8 screen as of October 5, 2007. They are ranked in descending order by the 52-week relative strength percentile.
As a measure of company size, the Foolish 8 screen limits annual sales to $500 million. For the companies in Table 2, DealerTrack Holdings (TRAK) has the highest level of sales over the last 12 months at $202.2 million, while Life Partners Holdings (LPHI), with sales of $19.1 million, is at the opposite end of the spectrum.
The Foolish Small Cap 8 screen requires companies to have sales and earnings growth rates over the last 12 months of at least 25%. Transcend Services (TRCR) has the lowest 12-month sales growth rate at 26.3% and Lifeway Foods (LWAY) ranks lowest in earnings growth at 29.4%. In contrast, Universal Insurance Holdings (UVE) outpaces the current passing companies with a 12-month sales growth rate of 417.4%, as sales grew from $28.7 million to $148.5 million. Meanwhile, the “smallest” company, Life Partners Holdings, grew its earnings from $0.07 per share to $0.66 per share over the last 12 months—an increase of 842.9%.
Looking for minimum levels of profitability, the Foolish 8 screen also calls for a net profit margin of at least 7%, meaning a company needs to earn at least seven cents for every $1 of sales. Here again, we find Life Partners Holdings at the top with a 12-month profit margin of 40.8%. North American Galvanizing & Coatings (NGA) just cleared the 7% hurdle with its 7.6% profit margin.
| |

|
One potential pitfall of small-cap investing is illiquidity—low trading volume and high bid-ask spreads. Often, screening strategies attempt to avoid illiquid shares by requiring a minimum trading volume or a minimum level of shares outstanding. However, the Foolish Small Cap 8 screen takes an opposing stance, capping the average daily dollar trading volume—the current price of a stock multiplied by its average daily trading volume. By purposely seeking companies that are relatively illiquid—an average daily dollar trading volume between $1 million and $25 million—the Gardners hope to force investors to take the extra time when analyzing small stocks, as the costs of “trading out of mistakes” are higher.
For this requirement, American Oriental Bioengineering (AOB) is at the top with daily dollar volume of almost $22 million. Tutogen Medical (TTG) has the lowest dollar volume at $1.1 million. By means of comparison, at the time of this writing, Apple Computer had an average daily dollar trading volume of $6.6 billion.
Lastly, the Foolish 8 screen requires insiders to own at least 10% of their company’s shares. Ideally, the more shares insiders own of a company, the more their interests are aligned with those of “outsider” shareholders. Silicom Ltd. (SILC) has the lowest level of insider ownership at 12.3% while both Lifeway Foods and Global Sources (GSOL) have the highest insider ownership at 70.9%.
Conclusion
Stock investing in general carries with it certain risks. Small-cap investing has its own set of unique risks and, therefore, is not intended for all investors. The companies passing this or any other screen mark only the beginning of the analysis process. It is important to understand the risks involved and whether or not stocks such as these fit your risk tolerances and time horizon. Only then should you consider adding them to your investment portfolio.
Wayne A. Thorp, CFA, is financial analyst at AAII and editor of Computerized Investing.




No comments have been added yet. Add your thoughts to the discussion!
You need to log in as a registered AAII user before commenting.
Log InCreate an account