


Sentiment indicators have always been popular among traders, but as the market undergoes seemingly endless gyrations these days, more and more investors are looking at measures of sentiment to provide some insight into where the market may be headed next. One sentiment measure that garners a lot of attention is the put-call ratio: It is widely recognized as being one of the most reliable indicators of future market direction.
The put-call ratio is called a sentiment measure because it signals the possibility of market reversals by measuring the “feelings” of options traders. When options traders become too bullish, the likelihood of a market downturn increases, and vice versa.
The put-call ratio is a contrarian sentiment indicator, meaning that the market tends to move against the mood of the investors. The put-call ratio is used to gauge the feelings of options traders who, by some estimates, lose about 90% of the time. Since this group as a whole has such a poor track record, it is perhaps not surprising that the put-call ratio is considered a contrarian indicator. When options traders are feeling especially good about the market, history shows that it is due for a downturn. Likewise, when traders are feeling especially bearish, a market bottom may be upon us.
Options traders typically buy puts when they feel the market is going to decline. The buyer of a put has the right, but not the obligation, to sell the underlying asset to the writer or seller of the put for a specified strike price during a specified time period. By providing a guaranteed buyer and price for the underlying asset, put options offer insurance against excessive losses.
Alternatively, traders buy calls when they think the market is going to rise. The buyer of the call option has the right, but not the obligation, to buy an agreed quantity of the underlying asset from the seller of the option at or before a predetermined time at a predetermined strike price. The buyer of a call option wants the price of the underlying instrument to rise in the future prior to the exercise date.
When the market becomes overly bullish, most potential buyers are already in the market, meaning that the potential for new buyers entering the market has reached a limit. Likewise, the number of potential sellers looking to capitalize on the run-up in asset prices is on the rise. Since demand is a key driver of asset prices, the upward momentum of the market will begin to falter as demand dries up. In this case, extreme bullishness in the market is represented by high call option volume.
Likewise, when extreme bearishness sweeps the market, most people are out of the market, so selling pressure is at its peak. At this point, potential buyers are ready to come in and take advantage of the low prices. A sign that a market bottom may be near is a high level of put option buying.
Different Methods of Calculation
There are several different ways to calculate a put-call ratio, so it is important to know the methodology used when viewing this data on a website or in the newspaper. The “traditional” CBOE (Chicago Board Options Exchange) weekly put-call ratio uses the weekly total of the volume of all puts and calls of equity and index options. It is the ratio of the total volume of equity and index put options for the last week to the total volume of equity and index call options for the same period.
One drawback to using a measure that includes index option volume is that index options are a popular tool of professional money managers to hedge, or protect, their portfolios. Using options in this manner is not the speculative behavior we are trying to capture in the put-call ratio.
Therefore, there is also the CBOE equity-only put-call ratio, which measures the volume in equity options only and is considered to be a “purer” measure of the speculative fervor of options traders.
Tracking the day-to-day or week-to-week movements in the put-call ratio is not overly useful to traders. Furthermore, the put-call ratio can change drastically on a daily or weekly basis.
Figure 1. Smoothing the Put-Call Ratio With a Moving Average
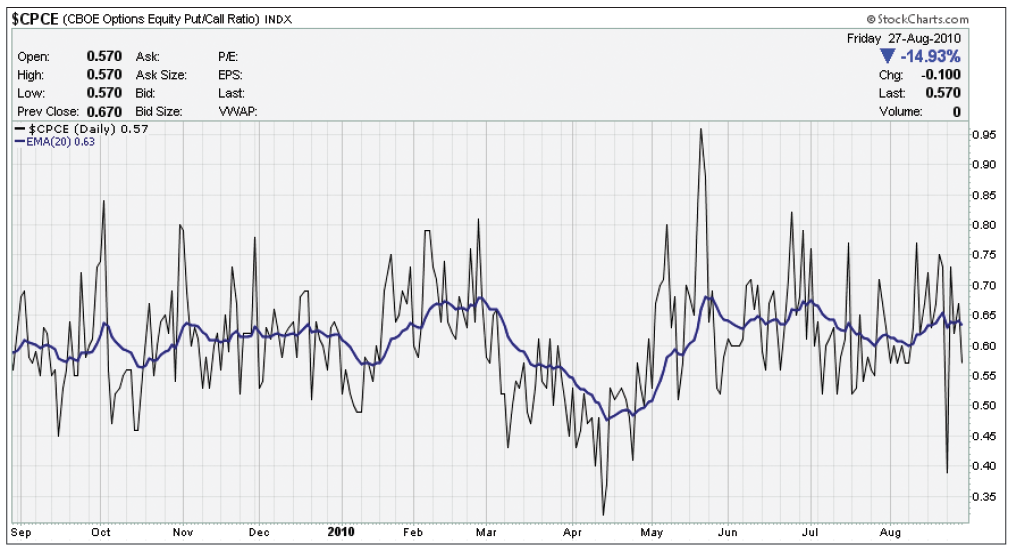
Figure 1 plots the CBOE equity-only put-call ratio for the last year. The black line is the daily value of the put-call ratio, while the blue line is the 20-day exponential moving average of the daily values. On a daily basis, the put-call ratio is quite volatile. Smoothing the data using the exponential moving average allows us to more easily identify trends in the ratio.
Interpreting the Put-Call Ratio
When bullish speculation reaches a peak in the market, the put-call ratio (whether the “traditional” or equity-only) will be low, as the volume in call options will far exceed that of put options. At this point, there is a likelihood of a market reversal to the downside.
The put-call ratio reaches high levels when buying of put options outstrips that of call options, which is what happens when traders are overly bearish. This is when traders should start looking for a market turnaround to the upside.
Going to Extremes
It is when the put-call ratio reaches extreme levels that the chance of a market reversal—either up or down—increases. The best way to determine when the put-call ratio enters “extreme zones” is by looking at historical activity.
Figure 2. Put-Call Ratio Trendlines
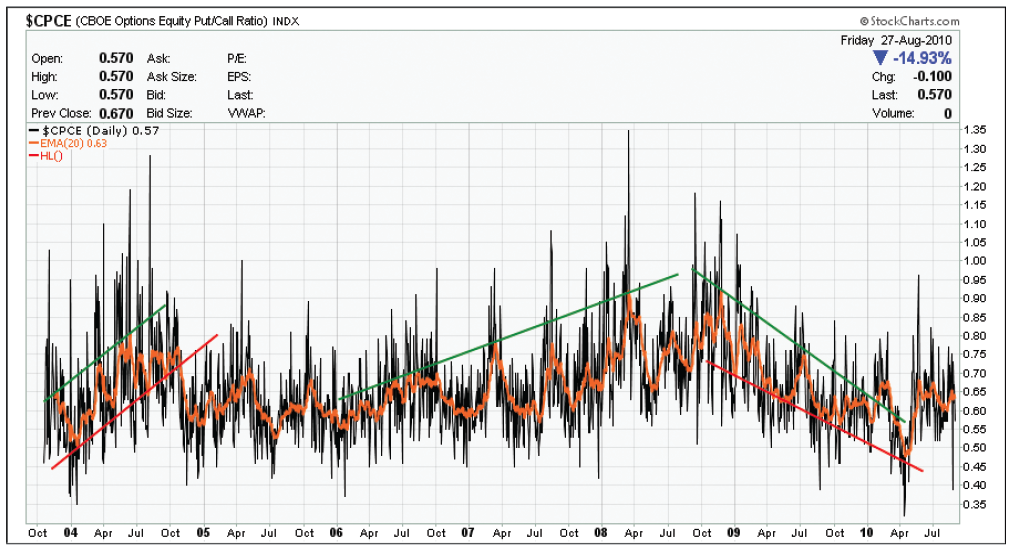
Figure 2 shows the daily values of the CBOE equity-only put-call ratio from its beginning in late 2003 through August 27, 2010. The orange line is, again, the 20-day exponential moving average of the put-call ratio. The red and green trendlines attempt to illustrate the “drift” in the extreme levels of the put-call ratio over the last seven years.
Figure 3 plots the weekly movements in the CBOE equity-only put-call ratio and the S&P 500 large-cap index over the last five years. This time we plot a four-week exponential moving average of the put-call ratio. The vertical lines on both charts indicate intermediate extremes for the put-call ratio, as represented by the moving average. As we can see, many of the intermediate market tops and bottoms over the last five years have corresponded with intermediate extremes in the put-call ratio.
Figure 3. Intermediate Extremes for the Put-Call Ratio
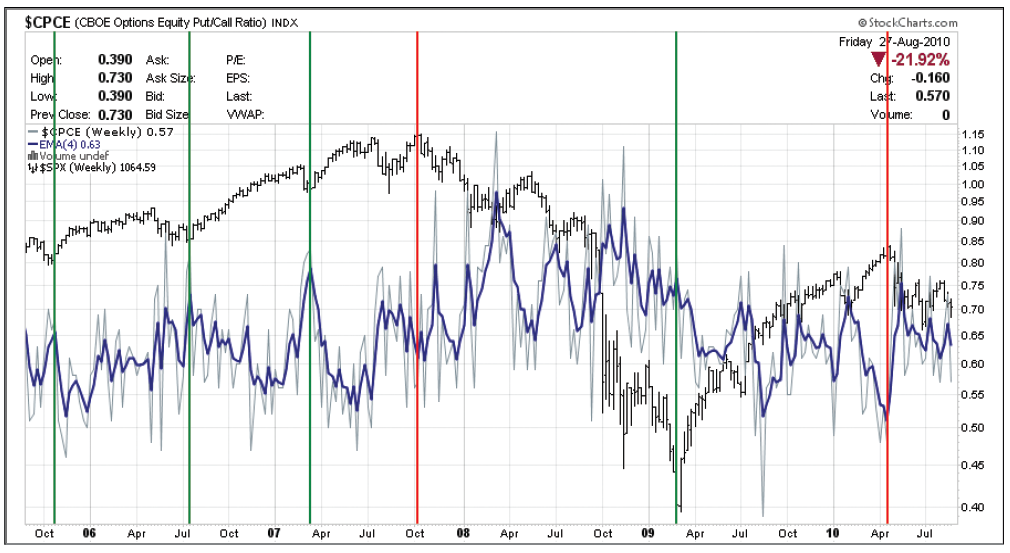
Most recently, in mid-April the put-call ratio’s moving average fell to its lowest level over the last five years. The following week, the S&P 500 peaked for the year. While the market bottom of March 2009 was not foretold by a long-term extreme high value in the put-call ratio, the ratio was still near extreme levels for the five-year period.
Conclusion
While not exact, the put-call ratio historically has been shown to be a good predictor of future market movement. It measures the speculative temperature of options traders, a group that, on the whole, is not overly successful.
It is important to view movements in put-call ratio values in the context of historical levels. Over time, these levels tend to be dynamic, as they adjust with trends in the data.
Like any indicator, it is best to use the put-call ratio in conjunction with other indicators, such as those measuring price momentum. Momentum indicators can provide confirmation that a market reversal is actually taking place.
Discussion
FREE REPORT

Charles from NY posted over 16 years ago:
John from MI posted over 15 years ago:
Wayne from IL posted over 15 years ago:
Dave from WA posted over 14 years ago:
Marjorie Holden Ph.D. from NY posted over 14 years ago:
Antonio Alvarez from PA posted over 13 years ago:
You need to log in as a registered AAII user before commenting.
Log InCreate an account