



Related

Portfolio Strategies
The timing of positive and negative returns significantly impacts wealth, particularly if withdrawals are taken or other changes are made.
by Charles Rotblut | May 2015

Charles Rotblut leads a class in AAII's new Essential Investing Video Course. Go to https://www.aaii.com/ves for more information and to subscribe.
One of the big uncertainties facing investors is the sequence of returns they will experience in the future.
Sequence of returns refers to the order in which positive and negative returns occur over a given time period. The sequence of returns is particularly important during the period surrounding the transition into retirement when an investor moves from accumulating assets to drawing down his or her savings.
The sequence of returns poses two challenges. First, it is impossible to predict how the markets will perform over an extended period. While valuation measures, for instance, can offer insight into the prevailing long-term attractiveness or elevated risk level of the market, they cannot accurately predict how stocks will actually perform in the future. Secondly, a period of negative absolute returns or low real (inflation-adjusted) returns can adversely affect an investor’s ability to withdraw a desired amount of cash flows.
This is the reason so many asset allocation models call for a portfolio to become more conservative as retirement approaches, and even continuing to get more conservative once in retirement. If large cash flows are needed and future returns (especially over the next one to five years) are unknown, it is prudent to take steps to minimize the chance of a large drop in portfolio value. A steep decline in wealth at an inopportune time can greatly increase a person’s longevity risk, meaning the risk of outliving one’s savings.
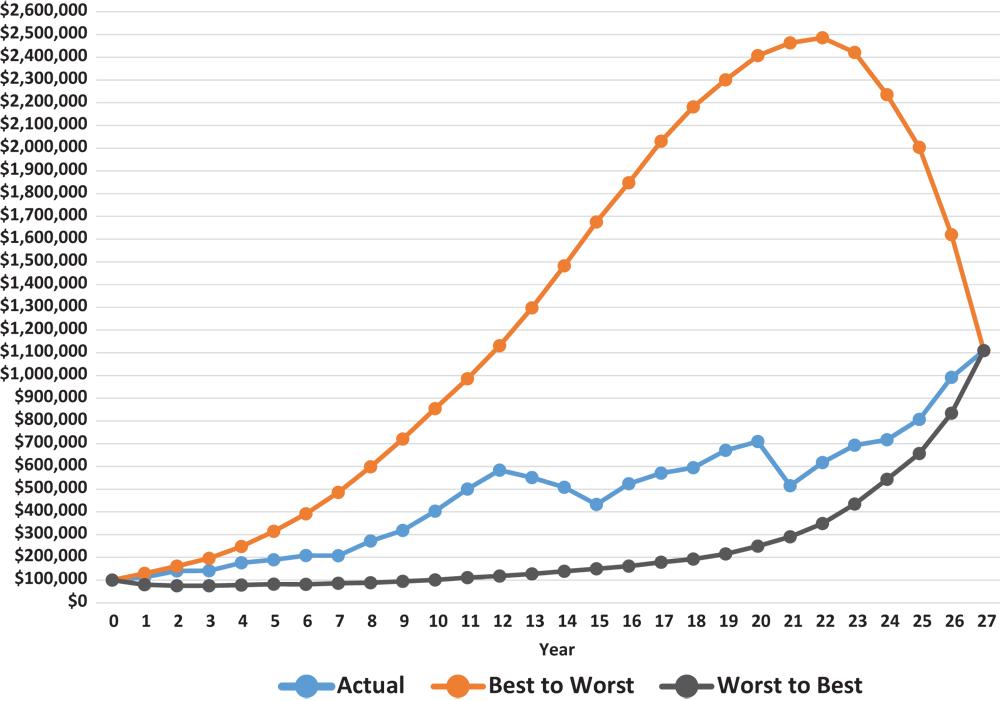
An easy way to understand the concept of sequence of returns is to look at the data. Figure 1 shows how a different order of returns would have affected the same portfolio over a period of time.
The portfolio starts with the “traditional allocation” of 60% stocks and 40% bonds, and was never rebalanced. Two mutual funds were used: the Vanguard S&P 500 Index (VFINX) and the Vanguard Total Bond Market Index (VBMFX). These funds were specifically chosen because they reflect the performance of the two asset classes, less a small fee for expenses. They are also unaffected by active management. They come with the trade-off of a limited number of years to base the analysis on. Though the corresponding stock and bond indexes could have been used, the funds’ performances better reflect the actual returns an investor would have realized, exclusive of any tax or transaction costs. No withdrawals were made in this first set of scenarios.
The data is run for the 27-year period of 1988 through 2014 (a period chosen based on the years that full-year data for the funds was available). Three scenarios were used. The first is the actual sequence of returns: the performance an investor would have realized if he or she had created the same portfolio at the start of 1988 and made no changes to it. The second scenario is “best to worst.” The best year for large-cap stocks, 1995, is assumed to have occurred first (Year 0) and each subsequent year has worse performance. The final year in this sequence is 2008 (Year 27). The third sequence reverses the order, going from the worst year for large-cap stocks (2008) to the best year (1995).
Figure 1 illustrates the different paths taken by each scenario to get to its ending result. The “actual sequence” scenario is volatile. The “best to worst” scenario starts with a long upward trend before crashing down in its final five years. The “worst to best” scenario drops initially before evolving into an extended rebound. The different paths followed by each scenario reflect the different sequence of returns they encountered.
Even though the paths are different, all three scenarios end up in the same place. This is because under hypothetical conditions, as long as no changes are made to the portfolio, the cumulative return is the same. The only thing that is altered is the order, or “sequence,” in which the annual returns occur. If any changes to the portfolio are made at a given point in the time, then two moving parts affect the eventual the outcome: the sequence of returns and the impact of making a change to the portfolio at one or multiple points over the specific period.
As noted previously, sequence of return matters greatly to a person transitioning into or currently in retirement (or otherwise intending to take withdrawals during a planned period of time, such as to fund college expenses). When withdrawals are being made, two big factors influence whether a portfolio will last a person’s lifetime. The first is the outflow of dollars to support a person’s (or a couple’s) lifestyle. These outflows reduce the portfolio’s size at the time the withdrawal is made. The second is the return on investments. A positive return, particularly one in excess of the withdrawal amount (e.g., 4% of portfolio value) can extend the number of years a portfolio lasts. A negative return can shorten a portfolio’s duration.
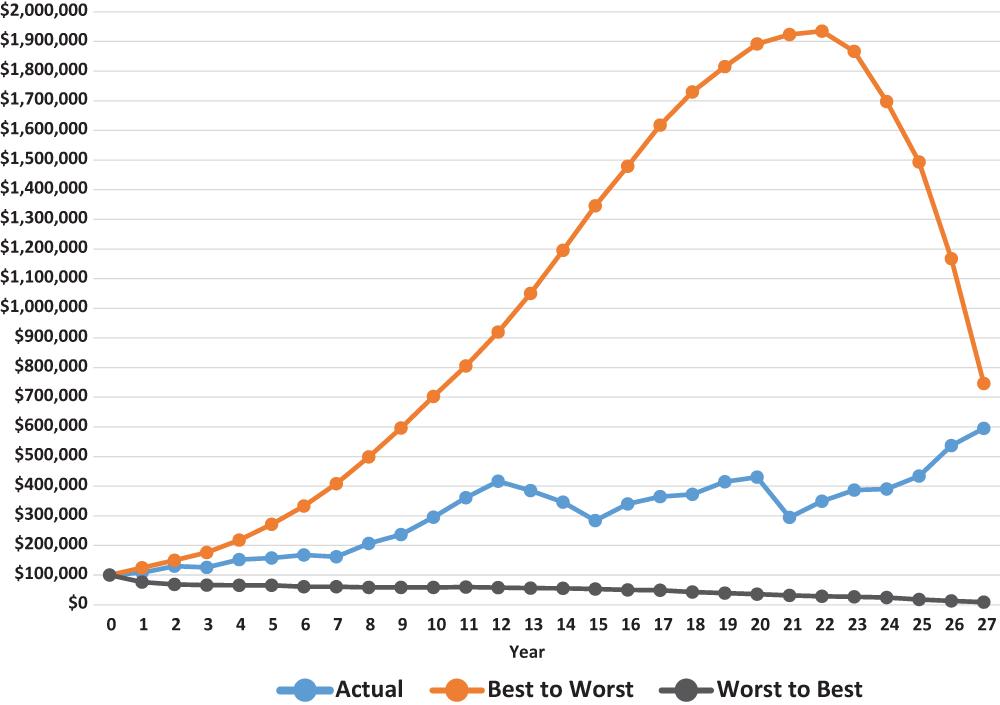
Figure 2 illustrates the same three scenarios—actual sequence, returns received in order of best to worst and returns received in order of worst to best—with retirement withdrawals factored in. A withdrawal rate equal to 4% of the initial portfolio balance, adjusted each year for inflation, is used. The withdrawal amount is based on studies showing 4% as the approximate maximum withdrawal rate a retiree can take without significantly increasing the odds of outliving living his or her money over a 30-year period.
Under the actual returns scenario, the retiree maintained a considerable amount of wealth relative to his or her savings at the start of retirement. The portfolio benefited by having the bad years dispersed throughout the time period. This dispersion allowed the portfolio to recover from the post-tech bubble (April 2000 through February 2003) and the financial crisis (November 2007 through February 2009) bear markets.
The best-to-worst scenario was also favorable for the retiree. The biggest gains in the equity markets coincided with the years the withdrawals were the smallest. This allowed the portfolio to take advantage of the big up years and grow considerably. The resulting gains were large enough to carry the portfolio through the big down years late in the scenario.
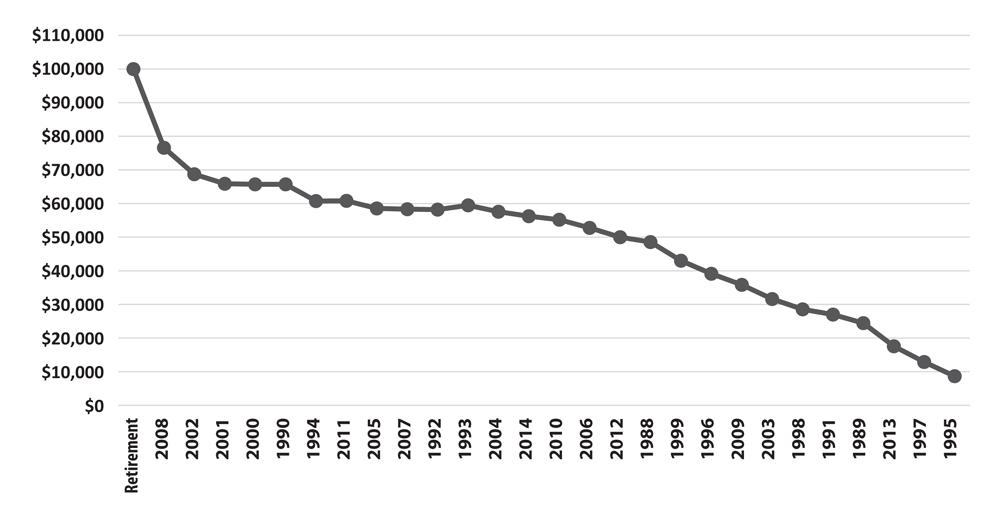
Conversely, the worst-to-best scenario (which is detailed in Figure 3) left the retiree with an ending portfolio value of approximately $8,700. Assuming withdrawals would continue to be increased with the rate of inflation, the portfolio would be completely drained in less than two additional years beyond the period used in the scenario—a disaster for a retiree with late-in-life expenses. It is the scenario that is the basis of the logic to make a portfolio more conservative as an investor ages.
Sequence of returns for a 60% stock/40% bond portfolio assuming the year with the worst return for large-cap stocks occurred first and each subsequent year had a higher rate of return. Initial withdrawal is 4% of year-end 1988 portfolio balance. Subsequent withdrawals were adjusted annually based on rate of inflation. Because no rebalancing or other related changes were made, the equity allocation was 0.0% at the beginning of 2014 (Year 13), causing the portfolio to only realize the return of an all-bond portfolio for the remainder of the test period.
Two simultaneous events coincided to wreck the portfolio under the worst-to-best scenario. The first is the span of five consecutive years with falling stock prices at the start of the scenario. These drops occurred when the allocation to stocks, in dollar terms, was at its largest. The second was the stream of withdrawals. The retiree increased the withdrawal amount at the same time that the portfolio was experiencing big drops in value. By the time the stock market’s returns reached positive double-digit percentages, the damage to the portfolio was done. The stock allocation was wiped out, leaving the portfolio completely dependent on its bond allocation.
Put another way, the best-to-worst scenario allowed the portfolio to benefit from the 37.5% gain the S&P 500 realized in 1995 when $60,000 was allocated to stocks. The year’s big upward surge in large-cap stock prices added $22,470 in wealth to the portfolio during that year, exclusive of the gain in bonds. The worst-to-best scenario saw its stock allocation dwindle to $1,808 by the 12th year and $0 by the 13th year. There was simply no money left in the stock allocation to benefit from the best years.
The aforementioned scenarios assume the portfolio allocations were never altered. Yet an investor can affect how the portfolio evolves by taking various actions. Even a simple strategy of rebalancing the portfolio can have a positive impact under the worst-to-best scenario.
Were the retiree to adjust the portfolio back to the 60/40 allocation at the end of every year, the ending value would rise from $8,700 to $92,000 under the worst-to-best scenario. Assuming inflation stays near its historical average of 2.9% and even modest positive returns in the future, this balance should be sufficient to prevent longevity risk from being incurred. (Late-in-life expenses and an unusually long lifespan are wildcard factors in any portfolio analysis.)
There are, of course, other levers that can be pulled. A variable withdrawal rate would help by reducing the withdrawal amounts during the bad years. Such a step could prove to be difficult to do in practice, especially if it reduces the amount of retirement income too severely. A retiree could seek out alternative sources of income, such as working part- or full-time, or tapping his or her home equity by downsizing, moving to a cheaper area and/or taking out a reverse mortgage. None of these may be ideal, but they could greatly reduce longevity risk in a scenario of bad returns early in one’s retirement.
Another option is to alter the portfolio’s allocation before retiring. This could, for example, mean changing to a bucket-type approach, which segments the portfolio based on when funds will be needed. Money needed for the first few years of retirement could be allocated to cash or other short-term investments, allowing a retiree to skip taking withdrawals from the long-term stock/bond allocation during the difficult early years of the worst-to-best scenario.
An investor could also go very conservative at retirement and then either gradually or aggressively increase the equity allocation once in retirement. This would allow the portfolio to effectively buy stocks on the cheap while avoiding much of the initial damage. A tactical approach could also be followed to limit the damage of a bad early sequence of returns, though this can be very risky if the decision to get back into the market is not made at the right time.
Be aware that the best-to-worst and worst-to-best scenarios are hypothetical. Though using actual return data, the sequence of returns in these scenarios reflects what could have potentially happened, not what did or will possibly happen. These scenarios are useful for demonstrating how a given sequence of returns effects a portfolio, but may not have any relation to the returns realized by stocks or bonds in the future.
The 27-year period used for the scenarios was, overall, favorable for investors. The Vanguard S&P 500 Index fund realized gains during 22 out of the 27 years and was down only during five years. There were certainly two very bad years, with the fund losing 22% of its value in 2002 and plunging by 37% in 2008. More than offsetting these down years were 10 years with gains in excess of 20%. The Vanguard Total Bond Market fund realized positive returns during 24 out of the 27 years analyzed. Four years (1989, 1991, 1995 and 2000) saw double-digit gains for the bond fund. The worst year was 1994, when shareholders in the fund lost 2.7%.
Long-term data should ease some worries about a potential lengthy period of negative returns. The 2014 Ibbotson SBBI Classic Yearbook does not show a single 20-year period where the return for a portfolio of either 70% large-cap stocks/30% long-term government bonds or 50% stocks/50% bonds was negative. The worst 20-year period (1929 to 1948) saw annualized gains of 4.3% and 4.6%, respectively. The worst 20-year rolling period annualized gain for a 100% stock portfolio was 3.1% (1929 to 1948). The worst 20-year rolling period annualized gain for a 100% long-term bond portfolio was 0.7% (1950 to 1969).
The Ibbotson portfolios were rebalanced, but withdrawals were not taken. The inclusion of withdrawals would have impacted the long-term returns reported for the aforementioned rolling periods. The most challenging environment would have been the 1928 to 1932 five-year period when large-cap stocks declined at an annualized rate of 12.5% (which was less severe than the 17.6% five-year drop used in the worst-to-best scenario). Long-term bonds gained 3.7% over the same period (1928 to 1932). The numbers also do not reflect the impact of any other events affecting an investor during such a difficult period (e.g., family members requiring financial assistance, the loss or severe reduction in income from other sources, etc.)
If we knew what the sequence of returns was going to be throughout the course of our life, including retirement, making asset allocation decisions would be much easier. Unfortunately, we do not. Compounding matters, we only have one run through life. Some people will be lucky to experience a market with a favorable sequence of returns early in their retirement or retire during a period when the bad years are dispersed enough to allow the portfolio to recover. Others will incur the bad luck of a negative sequence of returns occurring at inopportune times.
Since the long-term sequence of returns cannot be predicted, investors should pay attention to the historical odds and incorporate strategies designed to handle the volatility of the market. This means not only adhering to an appropriate long-term allocation, but also taking periodic (e.g., annual) actions to ensure the portfolio does not drift too far from its allocation targets. Investors should also incorporate flexibility into their financial plans, including budgeting for variability in withdrawal rates.
Finally, keep in mind that the allocations discussed here only used a large-cap stock fund and a total bond market fund in the examples. Annuities, bond ladders, one-to-five years of cash savings and other assets can also be used to help mitigate the risk of a negative sequence of returns for any specific asset class.
The big keys are to stay disciplined, never panic and realize that even in the worst-case scenario, there may be more than one action that can be taken to lessen the financial damage.
Portfolio Strategies

Retirement Planning

Stock Strategies

Steve Laube from GA posted over 11 years ago:
Jim Carson from ON posted over 11 years ago:
James Hogg from FL posted over 11 years ago:
Robert Ginsburgh from CA posted over 11 years ago:
Dave Gilmer from WA posted over 11 years ago:
Jim Linnemann from MI posted over 11 years ago:
Charles Rotblut from IL posted over 11 years ago:
Jack from SC posted over 11 years ago:
Dave Gilmer from WA posted over 10 years ago:
You need to log in as a registered AAII user before commenting.
Log InCreate an account